Support/Resistance Zones for ThinkorSwim

horserider

Well-known member
VIP
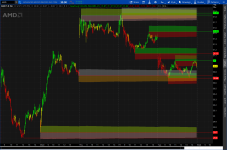
Support/Resistance or Supply/Demand whichever you prefer. Based on pivots and ATR. Change the n to get zones for the time you wish.

Update: ATR is now straight lines and user can input ATR multiple.
New share: https://tos.mx/Lv0FsZi

DfssJTt.png


https://tos.mx/VeGhwv
Code:
# Support/Resistance Zones around pivot S/R points.
#Added the zones using ATR to the Theotrade Pivots study.
#Additions by Horserider 9/30/2019

input length = 252;
input averageType = AverageType.WILDERS;

def ATR = MovingAverage(averageType, TrueRange(high, close, low), length);

# User Inputs
input n = 21; #hint n: periods used for pivot calculations.
def Num_Dev_Dn = ATR;
def Num_Dev_up = -ATR;


# Internal Script Reference
script LinePlot {
    input BarID = 0;
    input Value = 0;
    input BarOrigin = 0;
    def ThisBar = HighestAll(BarOrigin);
    def ValueLine = if BarOrigin == ThisBar
                then Value
                else Double.NaN;
    plot P = if ThisBar - BarID <= BarOrigin
             then HighestAll(ValueLine)
             else Double.NaN;
}
# Variables
def o = open;
def h = high;
def l = low;
def c = close;
def bar = BarNumber();
def BBar = bar == HighestAll(bar);
# Parent High
def ParentHigh = HighestAll(h);
def ParentHBarOrigin = if h == ParentHigh
                       then bar
                       else ParentHBarOrigin[1];
def ParentHBarID = bar - HighestAll(ParentHBarOrigin);
# R1
def hh = fold i = 1 to n + 1
         with p = 1
         while p
         do h > GetValue(h, -i);
def PivotH = if (bar > n and
                 h == Highest(h, n) and
                 hh)
            then h
            else Double.NaN;
def PHValue = if !IsNaN(PivotH)
              then PivotH
              else PHValue[1];
def PHBarOrigin = if !IsNaN(PivotH)
                  then bar
                  else PHBarOrigin[1];
def PHBarID = bar - PHBarOrigin;
# R2
def R2PHValue = if PHBarOrigin != PHBarOrigin[1]
              then PHValue[1]
              else R2PHValue[1];
def R2PHBarOrigin = if PHBarOrigin != PHBarOrigin[1]
                  then PHBarOrigin[1]
                  else R2PHBarOrigin[1];
def R2PHBarID = bar - R2PHBarOrigin;
# R3
def R3PHValue = if R2PHBarOrigin != R2PHBarOrigin[1]
              then R2PHValue[1]
              else R3PHValue[1];
def R3PHBarOrigin = if R2PHBarOrigin != R2PHBarOrigin[1]
                  then R2PHBarOrigin[1]
                  else R3PHBarOrigin[1];
def R3PHBarID = bar - R3PHBarOrigin;
# R4
def R4PHValue = if R3PHBarOrigin != R3PHBarOrigin[1]
              then R3PHValue[1]
              else R4PHValue[1];
def R4PHBarOrigin = if R3PHBarOrigin != R3PHBarOrigin[1]
                  then R3PHBarOrigin[1]
                  else R4PHBarOrigin[1];
def R4PHBarID = bar - R4PHBarOrigin;

# Parent Low
def ParentLow = LowestAll(l);
def ParentLBarOrigin = if l == ParentLow
                       then bar
                       else ParentLBarOrigin[1];
def ParentLBarID = bar - HighestAll(ParentLBarOrigin);
# S1
def ll = fold j = 1 to n + 1
         with q = 1
         while q
         do l < GetValue(l, -j);
def PivotL = if (bar > n and
                 l == Lowest(l, n) and
                 ll)
             then l
             else Double.NaN;
def PLValue = if !IsNaN(PivotL)
              then PivotL
              else PLValue[1];
def PLBarOrigin = if !IsNaN(PivotL)
                  then bar
                  else PLBarOrigin[1];
def PLBarID = bar - PLBarOrigin;
# S2
def S2PLValue = if PLBarOrigin != PLBarOrigin[1]
              then PLValue[1]
              else S2PLValue[1];
def S2PLBarOrigin = if PLBarOrigin != PLBarOrigin[1]
                  then PLBarOrigin[1]
                  else S2PLBarOrigin[1];
def S2PLBarID = bar - S2PLBarOrigin;
# S3
def S3PLValue = if S2PLBarOrigin != S2PLBarOrigin[1]
              then S2PLValue[1]
              else S3PLValue[1];
def S3PLBarOrigin = if S2PLBarOrigin != S2PLBarOrigin[1]
                  then S2PLBarOrigin[1]
                  else S3PLBarOrigin[1];
def S3PLBarID = bar - S3PLBarOrigin;
# S4
def S4PLValue = if S3PLBarOrigin != S3PLBarOrigin[1]
              then S3PLValue[1]
              else S4PLValue[1];
def S4PLBarOrigin = if S3PLBarOrigin != S3PLBarOrigin[1]
                  then S3PLBarOrigin[1]
                  else S4PLBarOrigin[1];
def S4PLBarID = bar - S4PLBarOrigin;

# Plots
plot PR1 = LinePlot(BarID = ParentHBarID,
                    Value = ParentHigh,
                    BarOrigin = HighestAll(ParentHBarOrigin));
PR1.SetDefaultColor(Color.GREEN);
#addChartBubble(Bar == HighestAll(ParentHBarOrigin), ParentHigh, "High", color.yellow, 1);
plot R1 = LinePlot(BarID = PHBarID,
                   Value = PHValue,
                   BarOrigin = PHBarOrigin);
R1.SetDefaultColor(Color.GREEN);
#AddChartBubble(bar == HighestAll(PHBarOrigin), PHValue, "R1", Color.GREEN, 1);

plot LowerBandr1 = R1 + Num_Dev_Dn ;
plot UpperBandr1 = R1 + Num_Dev_up ;
AddCloud(UpperBandr1, R1, Color.GREEN, Color.RED );
AddCloud(LowerBandr1, R1, Color.GREEN, Color.RED );
lowerbandr1.hide();
upperbandr1.hide();


plot R2 = LinePlot(BarID = R2PHBarID,
                   Value = R2PHValue,
                   BarOrigin = R2PHBarOrigin);
R2.SetDefaultColor(Color.GREEN);
#AddChartBubble(bar == HighestAll(R2PHBarOrigin), PHValue, "R2", Color.GREEN, 1);

plot LowerBandr2 = R2 + Num_Dev_Dn ;
plot UpperBandr2 = R2 + Num_Dev_up ;
AddCloud(UpperBandr2, R2, Color.GREEN, Color.RED);
AddCloud(LowerBandr2, R2, Color.GREEN, Color.RED);
lowerbandr2.hide();
upperbandr2.hide();

plot R3 = LinePlot(BarID = R3PHBarID,
                   Value = R3PHValue,
                   BarOrigin = R3PHBarOrigin);
R3.SetDefaultColor(Color.GREEN);
#AddChartBubble(bar == HighestAll(R3PHBarOrigin), PHValue, "R3", Color.GREEN, 1);

plot LowerBandr3 = R3 + Num_Dev_Dn ;
plot UpperBandr3 = R3 + Num_Dev_up ;
AddCloud(UpperBandr3, R3, Color.LIGHT_GRAY, Color.LIGHT_ORANGE);
AddCloud(LowerBandr3, R3, Color.LIGHT_GRAY, Color.LIGHT_ORANGE);
lowerbandr3.hide();
upperbandr3.hide();

plot R4 = LinePlot(BarID = R4PHBarID,
                   Value = R4PHValue,
                   BarOrigin = R4PHBarOrigin);
R4.SetDefaultColor(Color.GREEN);
#AddChartBubble(bar == HighestAll(R4PHBarOrigin), PHValue, "R4", Color.GREEN, 1);

plot LowerBandr4 = R4 + Num_Dev_Dn ;
plot UpperBandr4 = R4 + Num_Dev_up ;
AddCloud(UpperBandr4, R4, Color.LIME, Color.PINK);
AddCloud(LowerBandr4, R4, Color.LIME, Color.PINK);
lowerbandr4.hide();
upperbandr4.hide();


plot PS1 = LinePlot(BarID = ParentLBarID,
                   Value = ParentLow,
                   BarOrigin = HighestAll(ParentLBarOrigin));
PS1.SetDefaultColor(Color.RED);
#AddChartBubble(bar == HighestAll(ParentLBarOrigin), ParentLow, "Low", Color.YELLOW, 0);
plot S1 = LinePlot(BarID = PLBarID,
                   Value = PLValue,
                   BarOrigin = PLBarOrigin);
S1.SetDefaultColor(Color.RED);
#AddChartBubble(bar == HighestAll(PLBarOrigin), PLValue, "S1", Color.RED, 0);

plot LowerBands1 = S1 + Num_Dev_Dn ;
plot UpperBands1 = S1 + Num_Dev_up ;
AddCloud(UpperBands1, S1, Color.GREEN, Color.RED);
AddCloud(LowerBands1, S1, Color.GREEN, Color.RED);
lowerbands1.hide();
upperbands1.hide();

plot S2 = LinePlot(BarID = S2PLBarID,
                   Value = S2PLValue,
                   BarOrigin = S2PLBarOrigin);
S2.SetDefaultColor(Color.RED);
#AddChartBubble(bar == HighestAll(S2PLBarOrigin), PLValue, "S2", Color.RED, 0);

plot LowerBands2 = S2 + Num_Dev_Dn ;
plot UpperBands2 = S2 + Num_Dev_up ;
AddCloud(UpperBands2, S2, Color.GREEN, Color.RED);
AddCloud(LowerBands2, S2, Color.GREEN, Color.RED);
lowerbands2.hide();
upperbands2.hide();

plot S3 = LinePlot(BarID = S3PLBarID,
                   Value = S3PLValue,
                   BarOrigin = S3PLBarOrigin);
S3.SetDefaultColor(Color.RED);
#AddChartBubble(bar == HighestAll(S3PLBarOrigin), PLValue, "S3", Color.RED, 0);

plot LowerBands3 = S3 + Num_Dev_Dn ;
plot UpperBands3 = S3 + Num_Dev_up ;
AddCloud(UpperBands3, S3, Color.LIGHT_GRAY, Color.LIGHT_ORANGE);
AddCloud(LowerBands3, S3, Color.LIGHT_GRAY, Color.LIGHT_ORANGE);
lowerbands3.hide();
upperbands3.hide();


plot S4 = LinePlot(BarID = S4PLBarID,
                   Value = S4PLValue,
                   BarOrigin = S4PLBarOrigin);
S4.SetDefaultColor(Color.RED);
#AddChartBubble(bar == HighestAll(S4PLBarOrigin), PLValue, "S4", Color.RED, 0);

plot LowerBands4 = S4 + Num_Dev_Dn ;
plot UpperBands4 = S4 + Num_Dev_up ;
AddCloud(UpperBands4, S4, Color.LIME, Color.PINK);
AddCloud(LowerBands4, S4, Color.LIME, Color.PINK);
lowerbands4.hide();
upperbands4.hide();

plot BearScan = if (close crosses below S1) or
                   (close crosses below S2)
                then close
                else Double.NaN;
plot BullScan = if (close crosses above R1) or
                   (close crosses above R2)
                then close
                else Double.NaN;
# End Code Fractal Array
 
Last edited:

Join useThinkScript to post your question to a community of 21,000+ developers and traders.

BenTen

Administrative
Staff member
Staff
VIP
Lifetime
Thanks for sharing the script. Very useful. For anyone with a shrinking chart after adding this indicator, be sure to uncheck the "Fit Studies" option on your chart (you can do so by left-click > Chart Scale).

hwAMzuO.png


I checked the source code and it looks like the script contains some of Mobuis' work from his other indicators called WolfWave and/or Pivot Array. If that's the case I would recommend keeping his old header or give credit to the developer.
 

San

Member
2019 Donor
@mc01439, Currently N vaule set for 21. Do you know what is the value for other time frame like 1mts, 5mts,15mts,hour,day,week and Monthly.
 

mc01439

Well-known member
2019 Donor
VIP
@mc01439, Currently N vaule set for 21. Do you know what is the value for other time frame like 1mts, 5mts,15mts,hour,day,week and Monthly.

@San - Like @BenTen said you need to test what works best for you and your style. I like n @ 21 for 8 range bars. Someone else more than likely would use something else. I do not trade minute charts but 21 seems to paint a lot of lines, too many for my taste. I like a clean chart with only key points marked. More is not better from my experience. The best to you.
 
Last edited:

markos

Well-known member
VIP
@BenTen, what is the lookback period for this time frame " 1mts, 5mts,15mts,hour,day,week and Monthly."
@San, start at n=1 or 2 and add to it for each time frame until you get what works for you.
This is about you and your time frame & the way you like to see consolidation or pivots or S/R.
Trial and error until it is tuned in to your liking.
 
Last edited:

shizah

Member
I have looked in there and didn't find a supply/demand zone indicator. I'll go look at it again. Also, from what I've read supply and demand zones are different than supply and resistance lines. Regardless, I will not pay for an indicator...
 

horserider

Well-known member
VIP
@shizah Please tell us how they are different. You have a solution just adjust it to your trading plan.

I do not understand your statement "Anyway to just have certain S/R zones only the charts? Tried unticking plots and didn't work for me. " If you care to explain in detail maybe something can be adjusted to what you want.
 

horserider

Well-known member
VIP
@shizah My belief is you are falling for marketing jargon. Some one decided support/resistance is a common concept and I will call it supply/demand and act as if I have created something new and different. Then I can sell it as a new product. If you can explain the difference between supply/demand and support/resistance maybe someone can code it for you.
 

MBF

Active member
2019 Donor
Hi All
can someone send it as code
it is not working with me as file
here ya go :)

Code:
#Percent from ATH
#Mobius 4-2019 in TSL

def loc = isNaN(close[3]) and !isNaN(close[4]);
plot Highest_All = HighestAll(if high == HighestAll(high)
                              then high
                              else double.nan);
Highest_ALL.SetStyle(Curve.LONG_DASH);
Highest_All.SetDefaultColor(Color.gray);
Highest_All.HideBubble();
Highest_All.HideTitle();
addChartBubble(loc, Highest_ALL, "ATH", color.gray, no);
#plot OnePercent = HighestAll(if close crosses HighestAll(high) * #.99
#                           then HighestAll(high) * .99
#                           else double.nan);
#OnePercent.SetStyle(Curve.LONG_DASH);
#OnePercent.SetDefaultColor(Color.gray);
#OnePercent.HideBubble();
#OnePercent.HideTitle();
#addChartBubble(loc, OnePercent, "1%", color.gray, no);
#plot TwoPercent = HighestAll(if close crosses HighestALl(high) * #.98
#                             then HighestAll(high) * .98
#                             else double.nan);
#TwoPercent.SetStyle(Curve.LONG_DASH);
#TwoPercent.SetDefaultColor(Color.gray);
#TwoPercent.HideBubble();
#TwoPercent.HideTitle();
#addChartBubble(loc, TwoPercent, "2%", color.gray, no);
plot FivePercent = HighestAll(if close crosses HighestALl(high) * .95
                             then HighestAll(high) * .95
                             else double.nan);
FivePercent.SetStyle(Curve.LONG_DASH);
FivePercent.SetDefaultColor(Color.liME);
FivePercent.HideBubble();
FivePercent.HideTitle();
addChartBubble(loc, FivePercent, "5%", color.lime, no);
plot TenPercent =  HighestAll(if close crosses HighestALl(high) * .9
                             then HighestAll(high) * .9
                             else double.nan);
TenPercent.SetStyle(Curve.LONG_DASH);
TenPercent.SetDefaultColor(Color.lighT_ORANGE);
TenPercent.HideBubble();
TenPercent.HideTitle();
addChartBubble(loc, TenPercent, "10%", color.lighT_ORANGE, no);
plot TwentyPercent =  HighestAll(if close crosses HighestALl(high) * .8
                             then HighestAll(high) * .8
                             else double.nan);
TwentyPercent.SetStyle(Curve.LONG_DASH);
TwentyPercent.SetDefaultColor(Color.lighT_RED);
TwentyPercent.HideBubble();
TwentyPercent.HideTitle();
addChartBubble(loc, TwentyPercent, "20%", color.lIGHT_RED, no);
 
Last edited by a moderator:

WhiteWindows2

New member
Greetings. I'm new to this forum but not to trading and TOS. I just wanted to say "thanks" for automating the Support and Resistance lines. I do have some questions, naturally.
1) Is there a way to remove the red and green boxes? I would be very happy with just the bubbles showing S1 and R1.
2) If I were to set my charts to Daily 1 year and Daily 10 years, what should the "n" factor be? And the same for 5 minutes charts?
 

Similar threads

Not the exact question you're looking for?

Start a new thread and receive assistance from our community.

87k+ Posts
168 Online
Create Post

Similar threads

Similar threads

The Market Trading Game Changer

Join 2,500+ subscribers inside the useThinkScript VIP Membership Club
  • Exclusive indicators
  • Proven strategies & setups
  • Private Discord community
  • ‘Buy The Dip’ signal alerts
  • Exclusive members-only content
  • Add-ons and resources
  • 1 full year of unlimited support

Frequently Asked Questions

What is useThinkScript?

useThinkScript is the #1 community of stock market investors using indicators and other tools to power their trading strategies. Traders of all skill levels use our forums to learn about scripting and indicators, help each other, and discover new ways to gain an edge in the markets.

How do I get started?

We get it. Our forum can be intimidating, if not overwhelming. With thousands of topics, tens of thousands of posts, our community has created an incredibly deep knowledge base for stock traders. No one can ever exhaust every resource provided on our site.

If you are new, or just looking for guidance, here are some helpful links to get you started.

What are the benefits of VIP Membership?
VIP members get exclusive access to these proven and tested premium indicators: Buy the Dip, Advanced Market Moves 2.0, Take Profit, and Volatility Trading Range. In addition, VIP members get access to over 50 VIP-only custom indicators, add-ons, and strategies, private VIP-only forums, private Discord channel to discuss trades and strategies in real-time, customer support, trade alerts, and much more. Learn all about VIP membership here.
How can I access the premium indicators?
To access the premium indicators, which are plug and play ready, sign up for VIP membership here.
Top