# hilolines_08
# market session time period , high/low levels
# test with /es , it has bars 23 hours a day
# add default times for 3 markets.
# https://www.thebalance.com/stock-market-hours-4773216
# US 9:30am to 4:00pm EST
# UK 3:00am to 11:30am EST
# H.K. 9:30pm to 4:00am EST
#
# if choose is picked for a market, can enter your own start and stop times.
# can pick a RGB color for time period shading.
# same color used for label stats
# load study multiple times, and pick different times and colors
# ----------------------
# skip 6,7 , experimental code that didn't work out
# hilolines_05
# 2020-07-17
# halcyonguy
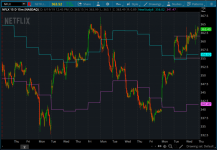
# draw shading, bounded by start/stop times and highest/lowest levels
# enter start and end times, (24 hour EST), for a period < 24 hours
# can choose to show several parameters , labels, lines, shading
# pick /es for testing. trades most of day
declare hide_on_daily;
#input market = { default "U.S." , "EU" , "H.K." , "-"};
input market = { default "U.S." , "EU" , "H.K." , "choose"};
def startx;
def stopx;
switch (market) {
case "U.S.":
# US 9:30am to 4:00pm EST
startx = 0930;
stopx = 1600;
case "EU":
# UK 3:00am to 11:30am EST
startx = 0300;
stopx = 1130;
case "H.K.":
# H.K. 9:30pm to 4:00am EST
startx = 2130;
stopx = 0400;
case "choose":
startx = 0;
stopx = 0;
}
# manual pick time period
input custom_start1_est = 0930;
input custom_end1_est = 1600;
def start1;
def end1;
if startx == 0 then {
start1 = custom_start1_EST;
end1 = custom_end1_est;
} else {
start1 = startx;
end1 = stopx;
}
input show_start_end_vertical_lines = yes;
def ssevl = show_start_end_vertical_lines;
input show_midnight_vertical_line = yes;
def smvl = show_midnight_vertical_line;
input show_current_period_labels = yes;
def scpl = show_current_period_labels;
def na = Double.NaN;
def hi = high;
def lo = low;
def bn = BarNumber();
# color alts gray 90,90,90 tan 70,70,70 grn 70,110,20
input show_shading = yes;
#input color_numbers_0to255 = yes;
#shading color is created by entering RGB color numbers, 0-255 , for red,green,blue
input shade_color_red_num0to255 = 70;
def cred = shade_color_red_num0to255;
input shade_color_green_num0to255 = 110;
def cgrn = shade_color_green_num0to255;
input shade_color_blue_num0to255 = 20;
def cblu = shade_color_blue_num0to255;
# show test data in labels and bubbles
input showtest = no;
def lastbar = !isnan(close[0]) and isnan(close[-1]);
# define the shading color
DefineGlobalColor( "shade1" , CreateColor(cred, cgrn, cblu));
addlabel(yes, market, GlobalColor( "shade1" ));
# -----------------------------------------------
# calc total minutes , from midnight , to each time
def start1hr = Floor(start1 / 100);
def start1min = start1 - (start1hr * 100);
def start1minttl = (start1hr * 60) + start1min;
AddLabel(showtest, start1 + ".." + "st hrs=" + start1hr + ".." + start1min + ".." + start1minttl, Color.CYAN);
def end1hr = Floor(end1 / 100);
def end1min = end1 - (end1hr * 100);
def end1minttl = (end1hr * 60) + end1min;
AddLabel(showtest, end1 + ".." + "end hrs=" + end1hr + ".." + end1min + ".." + end1minttl, Color.RED);
# ===========================>>>>>>>>>>>>>>>>>>>>
# elapsed min in current period
def stmin2 = SecondsFromTime(start1);
def stmin = stmin2 / (60);
AddLabel(showtest, "period min=" + stmin , Color.GREEN);
# ===========================>>>>>>>>>>>>>>>>>>>
# is bar in a time period? , minutes in a day , 24 x 60 = 1440
def daymin = 1440;
def endz = 2359;
def startz = 0000;
def first1 = if SecondsTillTime(start1) == 0 then 1 else 0;
def last1 = if SecondsFromTime(end1) == 0 then 1 else 0;
def period1min;
def period1;
if start1minttl > end1minttl
then {
# spans midnight , period=(24-start)+end , end to start
period1min = (daymin - start1minttl) + end1minttl;
period1 = if ((SecondsFromTime(start1) >= 0 and SecondsTillTime(endz) > 0) or ( SecondsFromTime(startz) >= 0 and SecondsTillTime(end1) > 0)) then 1 else 0;
} else {
# ok , period=end-start , start to end
period1min = (end1minttl - start1minttl);
period1 = if SecondsFromTime(start1) >= 0 and SecondsTillTime(end1) > 0 then 1 else 0;
}
# ====================================
AddVerticalLine(ssevl and first1, "Start " + start1 , Color.GREEN, Curve.MEDIUM_DASH);
AddVerticalLine(ssevl and last1, "End " + end1 , Color.ORANGE, Curve.MEDIUM_DASH);
# display time as hr:min , but trailing 0 not shown
#AddVerticalLine(ssevl and first1, "start " + start1hr + ":" + start1min , Color.GREEN, Curve.MEDIUM_DASH);
#AddVerticalLine(ssevl and last1, "end " + end1hr + ":" + end1min , Color.ORANGE, Curve.MEDIUM_DASH);
AddChartBubble(showtest, low - 1, period1, if period1 then Color.GREEN else Color.CYAN, no);
# midnight
def midn = 0000;
def midnite = if (smvl and SecondsTillTime(midn) == 0) then 1 else 0;
AddVerticalLine(midnite, "midnight" , Color.BLUE, Curve.MEDIUM_DASH);
AddLabel(showtest, "daymin=" + daymin + " end1minttl=" + end1minttl + " start1minttl=" + start1minttl, Color.GREEN);
AddLabel(showtest, "period1 min=" + period1min, Color.YELLOW);
AddLabel(scpl and period1, "hrs: " + round((period1min/60),1), GlobalColor("shade1"));
# -----------------------------------------------
# get chart agg minutes
def chagg = GetAggregationPeriod();
def aggmin = chagg / (1000 * 60);
AddLabel(showtest, "agg=" + aggmin, Color.CYAN);
# calc qty of bars of period1, for the current chart time
def period1bars = period1min / aggmin;
AddLabel(showtest, "period1 bars=" + period1bars, Color.YELLOW);
# ex. trade session = 6.5 hrs = 390 min
# 5 min chart = 390/5 = 78 bars over 6.5 hours
# def len = 78;
# =====================<<<<<<<<<<<<<<<<<<<<<<
# add check if in period and if last bar
def currentperiodbars = if (period1 and lastbar) then (stmin / aggmin) else 0;
AddLabel(showtest, "current period bars=" + currentperiodbars, Color.magenta);
AddLabel(scpl and period1, "bars " + currentperiodbars + "/" + period1bars, GlobalColor("shade1"));
# find the high of active period, only on last bar
def xhi = fold xi = 0 to currentperiodbars
with n = hi
do Max(n, GetValue(hi, xi));
AddLabel(scpl and period1, "highest: " + xhi , GlobalColor("shade1"));
# find the low of active period, only on last bar
def xlo = fold xj = 0 to currentperiodbars
with m = lo
do Min(m, GetValue(lo, xj));
AddLabel(scpl and period1, "lowest: " + xlo , GlobalColor("shade1"));
def len = period1bars - 1;
# ---------------------------------------------
# find high value for previous/complete time period, draw a line
def hi2 = if first1 then Highest(hi[-len], len + 1)
else if last1 then na
else if period1 then hi2[1]
else na;
plot hiline = hi2;
hiline.SetDefaultColor(Color.WHITE);
#hiline.SetStyle(Curve.MEDIUM_DASH);
hiline.SetLineWeight(1);
hiline.HideBubble();
# ------------------------------------------------
# find low value for previous/complete time period, draw a line
def lo2 = if first1 then Lowest(lo[-len], len + 1)
else if last1 then na
else if period1 then lo2[1]
else na;
plot loline = lo2;
loline.SetDefaultColor(Color.WHITE);
#loline.SetStyle(Curve.MEDIUM_DASH);
loline.SetLineWeight(1);
loline.HideBubble();
# ---------------------------------------------
# shading
def hiline2 = if show_shading then hiline else na;
def loline2 = if show_shading then loline else na;
#addcloud(hiline,loline,color.light_gray,color.light_gray);
AddCloud(hiline2, loline2, GlobalColor( "shade1" ), GlobalColor( "shade1" ) );
#