
how do use the Daily range vs atr? What am i looking for in terms of Drange vs ATR?This indicator displays the Average Daily Range for the last 5 days. Could potentially be useful for finding hidden support and resistance levels on intraday chart.

Notes:
- The blue line = high of average daily range
- The pink line = low of average daily range
thinkScript Code
Rich (BB code):#Hint: Average Daily Range def len = 2; def dayHigh = DailyHighLow(AggregationPeriod.DAY, len, 0, no).dailyhigh; def dayLow = DailyHighLow(AggregationPeriod.DAY, len, 0, no).DailyLow; def ADR_high = (dayHigh + dayHigh[1] + dayHigh[2] + dayHigh[3] + dayHigh[4]) / 5; def ADR_low = (dayLow + dayLow[1] + dayLow[2] + dayLow[3] + dayLow[4]) / 5; plot ADR_H = ADR_high; plot ADR_L = ADR_low;
Shareable Link
https://tos.mx/1yaAuM
Credit:
You are using an out of date browser. It may not display this or other websites correctly.
You should upgrade or use an alternative browser.
You should upgrade or use an alternative browser.
Average Daily Range Indicator for ThinkorSwim
- Thread starter BenTen
- Start date
-
- Tags
- supportxresistance
Join useThinkScript to post your question to a community of 21,000+ developers and traders.
DMacTrades
New member
Joshua... I don't know what part of the world you are in but should our paths ever cross dinner is on me. Working perfectly. Thank you so much. And, as I mentioned, we will be testing a specific setup around what you have helped with and I will make sure to reach out and share our findings with you as soon as we have meaningful data. Speak soon and have a great evening.
Hi Joshua - I hope that all is well for you. I had said back at the end of August (August 2021) that I would reach out once we had finished testing / live trading with the strategy that you were very kind to create a study for so here I am. Unfortunately, we were unable to demonstrate a statistical edge when using the parameters that the study was created around. On a positive note, however, the work that we did with what you created led us down a different path that has proven to have an edge. I will get a summary of it together and share it with you in the coming days in case you are interested. Keep well and thanks again for your help!Try this, it should take care of the weekend transitions and the alerts.
MagicQuotes
Member
In addition you might want to check out the Price Channel Indicator already on TOS. It consists of 2 bands drawn through the Highest Highes in the fixed period and the lowest lows in the same period. instead of an average aggregation period. Less Lag time and you can set it to any time period you want across any time from day to 5 minutes.. The concept of aggregation and price discovery can be viewed with additonal Time Continuity Studies.. like the StratThis indicator displays the Average Daily Range for the last 5 days. Could potentially be useful for finding hidden support and resistance levels on intraday chart.

Notes:
- The blue line = high of average daily range
- The pink line = low of average daily range
thinkScript Code
Rich (BB code):#Hint: Average Daily Range def len = 2; def dayHigh = DailyHighLow(AggregationPeriod.DAY, len, 0, no).dailyhigh; def dayLow = DailyHighLow(AggregationPeriod.DAY, len, 0, no).DailyLow; def ADR_high = (dayHigh + dayHigh[1] + dayHigh[2] + dayHigh[3] + dayHigh[4]) / 5; def ADR_low = (dayLow + dayLow[1] + dayLow[2] + dayLow[3] + dayLow[4]) / 5; plot ADR_H = ADR_high; plot ADR_L = ADR_low;
Shareable Link
https://tos.mx/1yaAuM
Credit:
morenoreyes
New member
Do you know why the HK box doesn't go to End lines in time frame 1M and other question is , the cloud should appear when the price get the end Line ?here is the code for the previous post, about market sessions.
i updated it to be able to pick 1 of 3 preset markets, US, UK, HK
can pick ' choose ' , if you want to enter custom times
input market = { default "U.S." , "EU" , "H.K." , "choose"};
https://www.thebalance.com/stock-market-hours-4773216
Ruby:# hilolines_08 # market session time period , high/low levels # test with /es , it has bars 23 hours a day # add default times for 3 markets. # https://www.thebalance.com/stock-market-hours-4773216 # US 9:30am to 4:00pm EST # UK 3:00am to 11:30am EST # H.K. 9:30pm to 4:00am EST # # if choose is picked for a market, can enter your own start and stop times. # can pick a RGB color for time period shading. # same color used for label stats # load study multiple times, and pick different times and colors # ---------------------- # skip 6,7 , experimental code that didn't work out # hilolines_05 # 2020-07-17 # halcyonguy # draw shading, bounded by start/stop times and highest/lowest levels # enter start and end times, (24 hour EST), for a period < 24 hours # can choose to show several parameters , labels, lines, shading # pick /es for testing. trades most of day declare hide_on_daily; #input market = { default "U.S." , "EU" , "H.K." , "-"}; input market = { default "U.S." , "EU" , "H.K." , "choose"}; def startx; def stopx; switch (market) { case "U.S.": # US 9:30am to 4:00pm EST startx = 0930; stopx = 1600; case "EU": # UK 3:00am to 11:30am EST startx = 0300; stopx = 1130; case "H.K.": # H.K. 9:30pm to 4:00am EST startx = 2130; stopx = 0400; case "choose": startx = 0; stopx = 0; } # manual pick time period input custom_start1_est = 0930; input custom_end1_est = 1600; def start1; def end1; if startx == 0 then { start1 = custom_start1_EST; end1 = custom_end1_est; } else { start1 = startx; end1 = stopx; } input show_start_end_vertical_lines = yes; def ssevl = show_start_end_vertical_lines; input show_midnight_vertical_line = yes; def smvl = show_midnight_vertical_line; input show_current_period_labels = yes; def scpl = show_current_period_labels; def na = Double.NaN; def hi = high; def lo = low; def bn = BarNumber(); # color alts gray 90,90,90 tan 70,70,70 grn 70,110,20 input show_shading = yes; #input color_numbers_0to255 = yes; #shading color is created by entering RGB color numbers, 0-255 , for red,green,blue input shade_color_red_num0to255 = 70; def cred = shade_color_red_num0to255; input shade_color_green_num0to255 = 110; def cgrn = shade_color_green_num0to255; input shade_color_blue_num0to255 = 20; def cblu = shade_color_blue_num0to255; # show test data in labels and bubbles input showtest = no; def lastbar = !isnan(close[0]) and isnan(close[-1]); # define the shading color DefineGlobalColor( "shade1" , CreateColor(cred, cgrn, cblu)); addlabel(yes, market, GlobalColor( "shade1" )); # ----------------------------------------------- # calc total minutes , from midnight , to each time def start1hr = Floor(start1 / 100); def start1min = start1 - (start1hr * 100); def start1minttl = (start1hr * 60) + start1min; AddLabel(showtest, start1 + ".." + "st hrs=" + start1hr + ".." + start1min + ".." + start1minttl, Color.CYAN); def end1hr = Floor(end1 / 100); def end1min = end1 - (end1hr * 100); def end1minttl = (end1hr * 60) + end1min; AddLabel(showtest, end1 + ".." + "end hrs=" + end1hr + ".." + end1min + ".." + end1minttl, Color.RED); # ===========================>>>>>>>>>>>>>>>>>>>> # elapsed min in current period def stmin2 = SecondsFromTime(start1); def stmin = stmin2 / (60); AddLabel(showtest, "period min=" + stmin , Color.GREEN); # ===========================>>>>>>>>>>>>>>>>>>> # is bar in a time period? , minutes in a day , 24 x 60 = 1440 def daymin = 1440; def endz = 2359; def startz = 0000; def first1 = if SecondsTillTime(start1) == 0 then 1 else 0; def last1 = if SecondsFromTime(end1) == 0 then 1 else 0; def period1min; def period1; if start1minttl > end1minttl then { # spans midnight , period=(24-start)+end , end to start period1min = (daymin - start1minttl) + end1minttl; period1 = if ((SecondsFromTime(start1) >= 0 and SecondsTillTime(endz) > 0) or ( SecondsFromTime(startz) >= 0 and SecondsTillTime(end1) > 0)) then 1 else 0; } else { # ok , period=end-start , start to end period1min = (end1minttl - start1minttl); period1 = if SecondsFromTime(start1) >= 0 and SecondsTillTime(end1) > 0 then 1 else 0; } # ==================================== AddVerticalLine(ssevl and first1, "Start " + start1 , Color.GREEN, Curve.MEDIUM_DASH); AddVerticalLine(ssevl and last1, "End " + end1 , Color.ORANGE, Curve.MEDIUM_DASH); # display time as hr:min , but trailing 0 not shown #AddVerticalLine(ssevl and first1, "start " + start1hr + ":" + start1min , Color.GREEN, Curve.MEDIUM_DASH); #AddVerticalLine(ssevl and last1, "end " + end1hr + ":" + end1min , Color.ORANGE, Curve.MEDIUM_DASH); AddChartBubble(showtest, low - 1, period1, if period1 then Color.GREEN else Color.CYAN, no); # midnight def midn = 0000; def midnite = if (smvl and SecondsTillTime(midn) == 0) then 1 else 0; AddVerticalLine(midnite, "midnight" , Color.BLUE, Curve.MEDIUM_DASH); AddLabel(showtest, "daymin=" + daymin + " end1minttl=" + end1minttl + " start1minttl=" + start1minttl, Color.GREEN); AddLabel(showtest, "period1 min=" + period1min, Color.YELLOW); AddLabel(scpl and period1, "hrs: " + round((period1min/60),1), GlobalColor("shade1")); # ----------------------------------------------- # get chart agg minutes def chagg = GetAggregationPeriod(); def aggmin = chagg / (1000 * 60); AddLabel(showtest, "agg=" + aggmin, Color.CYAN); # calc qty of bars of period1, for the current chart time def period1bars = period1min / aggmin; AddLabel(showtest, "period1 bars=" + period1bars, Color.YELLOW); # ex. trade session = 6.5 hrs = 390 min # 5 min chart = 390/5 = 78 bars over 6.5 hours # def len = 78; # =====================<<<<<<<<<<<<<<<<<<<<<< # add check if in period and if last bar def currentperiodbars = if (period1 and lastbar) then (stmin / aggmin) else 0; AddLabel(showtest, "current period bars=" + currentperiodbars, Color.magenta); AddLabel(scpl and period1, "bars " + currentperiodbars + "/" + period1bars, GlobalColor("shade1")); # find the high of active period, only on last bar def xhi = fold xi = 0 to currentperiodbars with n = hi do Max(n, GetValue(hi, xi)); AddLabel(scpl and period1, "highest: " + xhi , GlobalColor("shade1")); # find the low of active period, only on last bar def xlo = fold xj = 0 to currentperiodbars with m = lo do Min(m, GetValue(lo, xj)); AddLabel(scpl and period1, "lowest: " + xlo , GlobalColor("shade1")); def len = period1bars - 1; # --------------------------------------------- # find high value for previous/complete time period, draw a line def hi2 = if first1 then Highest(hi[-len], len + 1) else if last1 then na else if period1 then hi2[1] else na; plot hiline = hi2; hiline.SetDefaultColor(Color.WHITE); #hiline.SetStyle(Curve.MEDIUM_DASH); hiline.SetLineWeight(1); hiline.HideBubble(); # ------------------------------------------------ # find low value for previous/complete time period, draw a line def lo2 = if first1 then Lowest(lo[-len], len + 1) else if last1 then na else if period1 then lo2[1] else na; plot loline = lo2; loline.SetDefaultColor(Color.WHITE); #loline.SetStyle(Curve.MEDIUM_DASH); loline.SetLineWeight(1); loline.HideBubble(); # --------------------------------------------- # shading def hiline2 = if show_shading then hiline else na; def loline2 = if show_shading then loline else na; #addcloud(hiline,loline,color.light_gray,color.light_gray); AddCloud(hiline2, loline2, GlobalColor( "shade1" ), GlobalColor( "shade1" ) ); #
View attachment 10997
hal_ses
Thanks
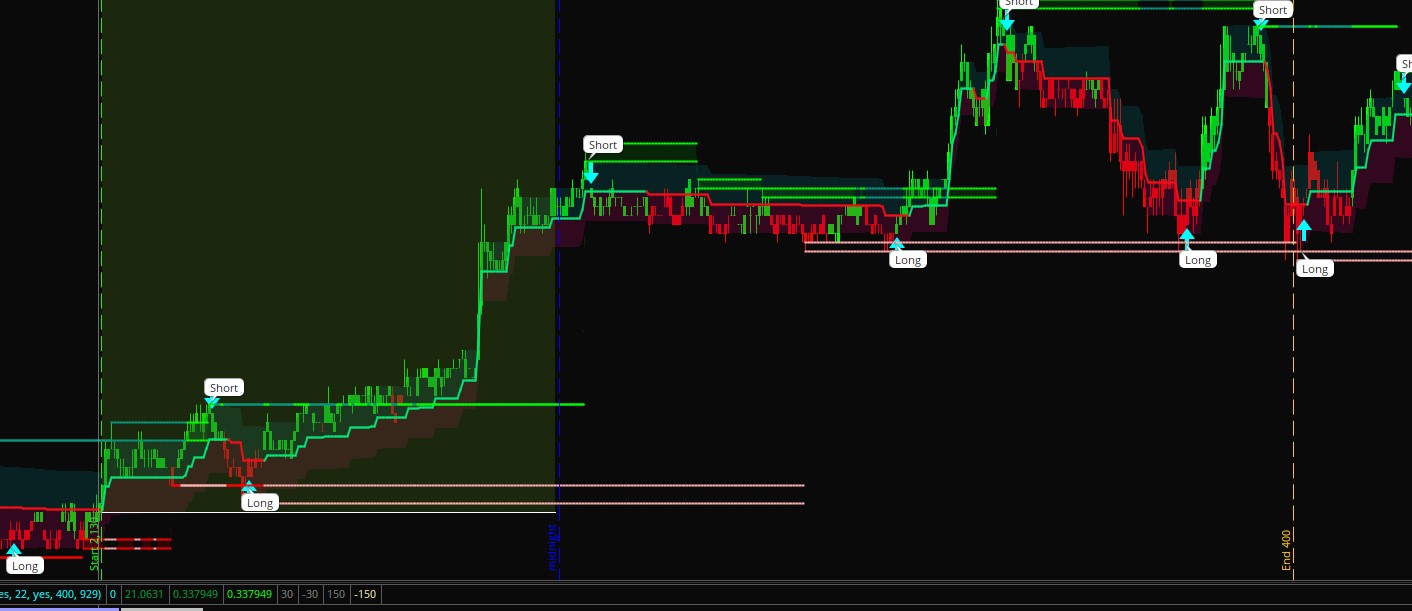
Do you know why the HK box doesn't go to End lines in time frame 1M and other question is , the cloud should appear when the price get the end Line ?
Thanks
The following edit that includes the minute when it is 2359 seems to work
Here is the full code with the editCode:def period1min; def period1; if start1minttl > end1minttl then { # spans midnight , period=(24-start)+end , end to start period1min = (daymin - start1minttl) + end1minttl; period1 = if ((SecondsFromTime(start1) >= 0 and SecondsTillTime(endz) >= 0) or ( SecondsFromTime(startz) >= 0 and SecondsTillTime(end1) >= 0)) then 1 else 0; } else { # ok , period=end-start , start to end period1min = (end1minttl - start1minttl); period1 = if SecondsFromTime(start1) >= 0 and SecondsTillTime(end1) >= 0 then 1 else 0; }
 Code:
Code:# hilolines_08 # market session time period , high/low levels # test with /es , it has bars 23 hours a day # add default times for 3 markets. # https://www.thebalance.com/stock-market-hours-4773216 # US 9:30am to 4:00pm EST # UK 3:00am to 11:30am EST # H.K. 9:30pm to 4:00am EST # # if choose is picked for a market, can enter your own start and stop times. # can pick a RGB color for time period shading. # same color used for label stats # load study multiple times, and pick different times and colors # ---------------------- # skip 6,7 , experimental code that didn't work out # hilolines_05 # 2020-07-17 # halcyonguy # draw shading, bounded by start/stop times and highest/lowest levels # enter start and end times, (24 hour EST), for a period < 24 hours # can choose to show several parameters , labels, lines, shading # pick /es for testing. trades most of day declare hide_on_daily; #input market = { default "U.S." , "EU" , "H.K." , "-"}; input market = { default "U.S." , "EU" , "H.K." , "choose"}; def startx; def stopx; switch (market) { case "U.S.": # US 9:30am to 4:00pm EST startx = 0930; stopx = 1600; case "EU": # UK 3:00am to 11:30am EST startx = 0300; stopx = 1130; case "H.K.": # H.K. 9:30pm to 4:00am EST startx = 2130; stopx = 0400; case "choose": startx = 0; stopx = 0; } # manual pick time period input custom_start1_est = 0930; input custom_end1_est = 1600; def start1; def end1; if startx == 0 then { start1 = custom_start1_EST; end1 = custom_end1_est; } else { start1 = startx; end1 = stopx; } input show_start_end_vertical_lines = yes; def ssevl = show_start_end_vertical_lines; input show_midnight_vertical_line = yes; def smvl = show_midnight_vertical_line; input show_current_period_labels = yes; def scpl = show_current_period_labels; def na = Double.NaN; def hi = high; def lo = low; def bn = BarNumber(); # color alts gray 90,90,90 tan 70,70,70 grn 70,110,20 input show_shading = yes; #input color_numbers_0to255 = yes; #shading color is created by entering RGB color numbers, 0-255 , for red,green,blue input shade_color_red_num0to255 = 70; def cred = shade_color_red_num0to255; input shade_color_green_num0to255 = 110; def cgrn = shade_color_green_num0to255; input shade_color_blue_num0to255 = 20; def cblu = shade_color_blue_num0to255; # show test data in labels and bubbles input showtest = no; def lastbar = !isnan(close[0]) and isnan(close[-1]); # define the shading color DefineGlobalColor( "shade1" , CreateColor(cred, cgrn, cblu)); addlabel(yes, market, GlobalColor( "shade1" )); # ----------------------------------------------- # calc total minutes , from midnight , to each time def start1hr = Floor(start1 / 100); def start1min = start1 - (start1hr * 100); def start1minttl = (start1hr * 60) + start1min; AddLabel(showtest, start1 + ".." + "st hrs=" + start1hr + ".." + start1min + ".." + start1minttl, Color.CYAN); def end1hr = Floor(end1 / 100); def end1min = end1 - (end1hr * 100); def end1minttl = (end1hr * 60) + end1min; AddLabel(showtest, end1 + ".." + "end hrs=" + end1hr + ".." + end1min + ".." + end1minttl, Color.RED); # ===========================>>>>>>>>>>>>>>>>>>>> # elapsed min in current period def stmin2 = SecondsFromTime(start1); def stmin = stmin2 / (60); AddLabel(showtest, "period min=" + stmin , Color.GREEN); # ===========================>>>>>>>>>>>>>>>>>>> # is bar in a time period? , minutes in a day , 24 x 60 = 1440 def daymin = 1440; def endz = 2359; def startz = 0000; def first1 = if SecondsTillTime(start1) == 0 then 1 else 0; def last1 = if SecondsFromTime(end1) == 0 then 1 else 0; def period1min; def period1; if start1minttl > end1minttl then { # spans midnight , period=(24-start)+end , end to start period1min = (daymin - start1minttl) + end1minttl; period1 = if ((SecondsFromTime(start1) >= 0 and SecondsTillTime(endz) >= 0) or ( SecondsFromTime(startz) >= 0 and SecondsTillTime(end1) >= 0)) then 1 else 0; } else { # ok , period=end-start , start to end period1min = (end1minttl - start1minttl); period1 = if SecondsFromTime(start1) >= 0 and SecondsTillTime(end1) >= 0 then 1 else 0; } # ==================================== AddVerticalLine(ssevl and first1, "Start " + start1 , Color.GREEN, Curve.MEDIUM_DASH); AddVerticalLine(ssevl and last1, "End " + end1 , Color.ORANGE, Curve.MEDIUM_DASH); # display time as hr:min , but trailing 0 not shown #AddVerticalLine(ssevl and first1, "start " + start1hr + ":" + start1min , Color.GREEN, Curve.MEDIUM_DASH); #AddVerticalLine(ssevl and last1, "end " + end1hr + ":" + end1min , Color.ORANGE, Curve.MEDIUM_DASH); AddChartBubble(showtest, low - 1, period1, if period1 then Color.GREEN else Color.CYAN, no); # midnight def midn = 0000; def midnite = if (smvl and SecondsTillTime(midn) == 0) then 1 else 0; AddVerticalLine(midnite, "midnight" , Color.BLUE, Curve.MEDIUM_DASH); AddLabel(showtest, "daymin=" + daymin + " end1minttl=" + end1minttl + " start1minttl=" + start1minttl, Color.GREEN); AddLabel(showtest, "period1 min=" + period1min, Color.YELLOW); AddLabel(scpl and period1, "hrs: " + round((period1min/60),1), GlobalColor("shade1")); # ----------------------------------------------- # get chart agg minutes def chagg = GetAggregationPeriod(); def aggmin = chagg / (1000 * 60); AddLabel(showtest, "agg=" + aggmin, Color.CYAN); # calc qty of bars of period1, for the current chart time def period1bars = period1min / aggmin; AddLabel(showtest, "period1 bars=" + period1bars, Color.YELLOW); # ex. trade session = 6.5 hrs = 390 min # 5 min chart = 390/5 = 78 bars over 6.5 hours # def len = 78; # =====================<<<<<<<<<<<<<<<<<<<<<< # add check if in period and if last bar def currentperiodbars = if (period1 and lastbar) then (stmin / aggmin) else 0; AddLabel(showtest, "current period bars=" + currentperiodbars, Color.magenta); AddLabel(scpl and period1, "bars " + currentperiodbars + "/" + period1bars, GlobalColor("shade1")); # find the high of active period, only on last bar def xhi = fold xi = 0 to currentperiodbars with n = hi do Max(n, GetValue(hi, xi)); AddLabel(scpl and period1, "highest: " + xhi , GlobalColor("shade1")); # find the low of active period, only on last bar def xlo = fold xj = 0 to currentperiodbars with m = lo do Min(m, GetValue(lo, xj)); AddLabel(scpl and period1, "lowest: " + xlo , GlobalColor("shade1")); def len = period1bars - 1; # --------------------------------------------- # find high value for previous/complete time period, draw a line def hi2 = if first1 then Highest(hi[-len], len + 1) else if last1 then na else if period1 then hi2[1] else na; plot hiline = hi2; hiline.SetDefaultColor(Color.WHITE); #hiline.SetStyle(Curve.MEDIUM_DASH); hiline.SetLineWeight(1); hiline.HideBubble(); # ------------------------------------------------ # find low value for previous/complete time period, draw a line def lo2 = if first1 then Lowest(lo[-len], len + 1) else if last1 then na else if period1 then lo2[1] else na; plot loline = lo2; loline.SetDefaultColor(Color.WHITE); #loline.SetStyle(Curve.MEDIUM_DASH); loline.SetLineWeight(1); loline.HideBubble(); # --------------------------------------------- # shading def hiline2 = if show_shading then hiline else na; def loline2 = if show_shading then loline else na; #addcloud(hiline,loline,color.light_gray,color.light_gray); AddCloud(hiline2, loline2, GlobalColor( "shade1" ), GlobalColor( "shade1" ) ); #
@halcyonguy This indicator is great. Is it possible to extend Hiline and Loline to the right until it reaches price then stop?here is the code for the previous post, about market sessions.
i updated it to be able to pick 1 of 3 preset markets, US, UK, HK
can pick ' choose ' , if you want to enter custom times
input market = { default "U.S." , "EU" , "H.K." , "choose"};
https://www.thebalance.com/stock-market-hours-4773216
Ruby:# hilolines_08 # market session time period , high/low levels # test with /es , it has bars 23 hours a day # add default times for 3 markets. # https://www.thebalance.com/stock-market-hours-4773216 # US 9:30am to 4:00pm EST # UK 3:00am to 11:30am EST # H.K. 9:30pm to 4:00am EST # # if choose is picked for a market, can enter your own start and stop times. # can pick a RGB color for time period shading. # same color used for label stats # load study multiple times, and pick different times and colors # ---------------------- # skip 6,7 , experimental code that didn't work out # hilolines_05 # 2020-07-17 # halcyonguy # draw shading, bounded by start/stop times and highest/lowest levels # enter start and end times, (24 hour EST), for a period < 24 hours # can choose to show several parameters , labels, lines, shading # pick /es for testing. trades most of day declare hide_on_daily; #input market = { default "U.S." , "EU" , "H.K." , "-"}; input market = { default "U.S." , "EU" , "H.K." , "choose"}; def startx; def stopx; switch (market) { case "U.S.": # US 9:30am to 4:00pm EST startx = 0930; stopx = 1600; case "EU": # UK 3:00am to 11:30am EST startx = 0300; stopx = 1130; case "H.K.": # H.K. 9:30pm to 4:00am EST startx = 2130; stopx = 0400; case "choose": startx = 0; stopx = 0; } # manual pick time period input custom_start1_est = 0930; input custom_end1_est = 1600; def start1; def end1; if startx == 0 then { start1 = custom_start1_EST; end1 = custom_end1_est; } else { start1 = startx; end1 = stopx; } input show_start_end_vertical_lines = yes; def ssevl = show_start_end_vertical_lines; input show_midnight_vertical_line = yes; def smvl = show_midnight_vertical_line; input show_current_period_labels = yes; def scpl = show_current_period_labels; def na = Double.NaN; def hi = high; def lo = low; def bn = BarNumber(); # color alts gray 90,90,90 tan 70,70,70 grn 70,110,20 input show_shading = yes; #input color_numbers_0to255 = yes; #shading color is created by entering RGB color numbers, 0-255 , for red,green,blue input shade_color_red_num0to255 = 70; def cred = shade_color_red_num0to255; input shade_color_green_num0to255 = 110; def cgrn = shade_color_green_num0to255; input shade_color_blue_num0to255 = 20; def cblu = shade_color_blue_num0to255; # show test data in labels and bubbles input showtest = no; def lastbar = !isnan(close[0]) and isnan(close[-1]); # define the shading color DefineGlobalColor( "shade1" , CreateColor(cred, cgrn, cblu)); addlabel(yes, market, GlobalColor( "shade1" )); # ----------------------------------------------- # calc total minutes , from midnight , to each time def start1hr = Floor(start1 / 100); def start1min = start1 - (start1hr * 100); def start1minttl = (start1hr * 60) + start1min; AddLabel(showtest, start1 + ".." + "st hrs=" + start1hr + ".." + start1min + ".." + start1minttl, Color.CYAN); def end1hr = Floor(end1 / 100); def end1min = end1 - (end1hr * 100); def end1minttl = (end1hr * 60) + end1min; AddLabel(showtest, end1 + ".." + "end hrs=" + end1hr + ".." + end1min + ".." + end1minttl, Color.RED); # ===========================>>>>>>>>>>>>>>>>>>>> # elapsed min in current period def stmin2 = SecondsFromTime(start1); def stmin = stmin2 / (60); AddLabel(showtest, "period min=" + stmin , Color.GREEN); # ===========================>>>>>>>>>>>>>>>>>>> # is bar in a time period? , minutes in a day , 24 x 60 = 1440 def daymin = 1440; def endz = 2359; def startz = 0000; def first1 = if SecondsTillTime(start1) == 0 then 1 else 0; def last1 = if SecondsFromTime(end1) == 0 then 1 else 0; def period1min; def period1; if start1minttl > end1minttl then { # spans midnight , period=(24-start)+end , end to start period1min = (daymin - start1minttl) + end1minttl; period1 = if ((SecondsFromTime(start1) >= 0 and SecondsTillTime(endz) > 0) or ( SecondsFromTime(startz) >= 0 and SecondsTillTime(end1) > 0)) then 1 else 0; } else { # ok , period=end-start , start to end period1min = (end1minttl - start1minttl); period1 = if SecondsFromTime(start1) >= 0 and SecondsTillTime(end1) > 0 then 1 else 0; } # ==================================== AddVerticalLine(ssevl and first1, "Start " + start1 , Color.GREEN, Curve.MEDIUM_DASH); AddVerticalLine(ssevl and last1, "End " + end1 , Color.ORANGE, Curve.MEDIUM_DASH); # display time as hr:min , but trailing 0 not shown #AddVerticalLine(ssevl and first1, "start " + start1hr + ":" + start1min , Color.GREEN, Curve.MEDIUM_DASH); #AddVerticalLine(ssevl and last1, "end " + end1hr + ":" + end1min , Color.ORANGE, Curve.MEDIUM_DASH); AddChartBubble(showtest, low - 1, period1, if period1 then Color.GREEN else Color.CYAN, no); # midnight def midn = 0000; def midnite = if (smvl and SecondsTillTime(midn) == 0) then 1 else 0; AddVerticalLine(midnite, "midnight" , Color.BLUE, Curve.MEDIUM_DASH); AddLabel(showtest, "daymin=" + daymin + " end1minttl=" + end1minttl + " start1minttl=" + start1minttl, Color.GREEN); AddLabel(showtest, "period1 min=" + period1min, Color.YELLOW); AddLabel(scpl and period1, "hrs: " + round((period1min/60),1), GlobalColor("shade1")); # ----------------------------------------------- # get chart agg minutes def chagg = GetAggregationPeriod(); def aggmin = chagg / (1000 * 60); AddLabel(showtest, "agg=" + aggmin, Color.CYAN); # calc qty of bars of period1, for the current chart time def period1bars = period1min / aggmin; AddLabel(showtest, "period1 bars=" + period1bars, Color.YELLOW); # ex. trade session = 6.5 hrs = 390 min # 5 min chart = 390/5 = 78 bars over 6.5 hours # def len = 78; # =====================<<<<<<<<<<<<<<<<<<<<<< # add check if in period and if last bar def currentperiodbars = if (period1 and lastbar) then (stmin / aggmin) else 0; AddLabel(showtest, "current period bars=" + currentperiodbars, Color.magenta); AddLabel(scpl and period1, "bars " + currentperiodbars + "/" + period1bars, GlobalColor("shade1")); # find the high of active period, only on last bar def xhi = fold xi = 0 to currentperiodbars with n = hi do Max(n, GetValue(hi, xi)); AddLabel(scpl and period1, "highest: " + xhi , GlobalColor("shade1")); # find the low of active period, only on last bar def xlo = fold xj = 0 to currentperiodbars with m = lo do Min(m, GetValue(lo, xj)); AddLabel(scpl and period1, "lowest: " + xlo , GlobalColor("shade1")); def len = period1bars - 1; # --------------------------------------------- # find high value for previous/complete time period, draw a line def hi2 = if first1 then Highest(hi[-len], len + 1) else if last1 then na else if period1 then hi2[1] else na; plot hiline = hi2; hiline.SetDefaultColor(Color.WHITE); #hiline.SetStyle(Curve.MEDIUM_DASH); hiline.SetLineWeight(1); hiline.HideBubble(); # ------------------------------------------------ # find low value for previous/complete time period, draw a line def lo2 = if first1 then Lowest(lo[-len], len + 1) else if last1 then na else if period1 then lo2[1] else na; plot loline = lo2; loline.SetDefaultColor(Color.WHITE); #loline.SetStyle(Curve.MEDIUM_DASH); loline.SetLineWeight(1); loline.HideBubble(); # --------------------------------------------- # shading def hiline2 = if show_shading then hiline else na; def loline2 = if show_shading then loline else na; #addcloud(hiline,loline,color.light_gray,color.light_gray); AddCloud(hiline2, loline2, GlobalColor( "shade1" ), GlobalColor( "shade1" ) ); #
View attachment 10997
hal_ses
Is it possible to extend Hiline and Loline to the right until it reaches price then stop?The following edit that includes the minute when it is 2359 seems to work
Here is the full code with the edit
Hey @jdstrader did you end up looking into your script for DTR vs ATR... I am in search of a code in this similar area.Yes, sorry I forgot to mention that I did change your code to 14 periods so it must be the WildersAverage part that is giving different percentages. I'll look into it further. Thanks for your help.
I adapted this a little so that the 5 and 10 period ADR create an upper and lower cloud along with a 50% line variable. I've been watching it lightly off to the side with a periodic check in and I keep saying "Ok, you need to pay closer attention to this".
Enjoy:
Enjoy:
Code:
input aggregationPeriod = AggregationPeriod.DAY;
def open = open(period = aggregationPeriod);
def high = high(period = aggregationPeriod);
def low = low(period = aggregationPeriod);
def dayrange = (high - low);

def adr_10 = average(dayrange,10);
def adr_5 = average(dayrange,5);

def hl1 = (OPEN + (adr_10 / 2));
def ll1 = (OPEN - (adr_10 / 2));
def hl2 = (OPEN + (adr_5 / 2));
def ll2 = (OPEN - (adr_5 / 2));

plot upper2 = hl1;
plot lower1 = ll2;
plot upper1 = hl2;
plot lower2 = ll1;

plot level50 = (lower1+upper1)/2;
level50.setdefaultcolor(color.yellow);

addCloud(upper2, upper1, color.RED, color.RED);
addCloud(lower1, lower2, color.GREEN, color.GREEN);

upper1.SetDefaultColor(Color.dark_red);
upper2.SetDefaultColor(Color.dark_red);
lower1.SetDefaultColor(Color.dark_green);
lower2.SetDefaultColor(Color.dark_green);I've written 3 different ATR % scripts to utilize in a scan/watchlist. I am having the same issues, exact same code for the label copied into a column in a watchlist and different results appear. For reference I use SATY ATR levels and above code is almost identical result. I never found a resolution to this issue. Below is a pic of /ES with SATY ATR Label, next to it the above code label and then what is reflected in the watchlist column with the exact code above. Thought maybe it had to do with aggregation in watchlist formula, but changing it doesn't seem to make any difference. Any help is appreciated. As can be seen below, chart label shows 16% and watchlist column shows 37%Thanks for the script @autolox I added it to my watchlist. I have another indicator on my chart that shows me the DTR vs ATR of the stock I'm watching on a little bubble. For some reason the percentage doesn't match with the one shown on the watchlist using your script. I'm attaching a screenshot so you see what I mean.
View attachment 1702
Here's the code of the indicator I'm using.
Code:# Custom ATR Plot by 7of9 for BRT # edited 3/20/19 declare upper; input AtrAvgLength = 14; def ATR = WildersAverage(TrueRange(high(period = aggregationPeriod.DAY), close(period = aggregationPeriod.DAY), low(period = aggregationPeriod.DAY)), AtrAvgLength); def TodayHigh = Highest(high(period = aggregationPeriod.DAY), 1); def TodayLow = Lowest(low(period = aggregationPeriod.DAY), 1); def DTR = TodayHigh - TodayLow; def DTRpct = Round((DTR / ATR) * 100, 0); AddLabel (yes, "DTR " + Round (DTR , 2) + " vs ATR " + round (ATR,2)+ " " + round (DTRpct,0) + "%", (if DTRpct <= 70 then Color.GREEN else if DTRpct >= 90 then Color.RED else Color.ORANGE));
I can't figure out why I'm getting different values of the DTR. Thanks again for your help.
I've written 3 different ATR % scripts to utilize in a scan/watchlist. I am having the same issues, exact same code for the label copied into a column in a watchlist and different results appear. For reference I use SATY ATR levels and above code is almost identical result. I never found a resolution to this issue. Below is a pic of /ES with SATY ATR Label, next to it the above code label and then what is reflected in the watchlist column with the exact code above. Thought maybe it had to do with aggregation in watchlist formula, but changing it doesn't seem to make any difference. Any help is appreciated. As can be seen below, chart label shows 16% and watchlist column shows 37%
View attachment 21426
View attachment 21427
The SATY uses an optional offset of one(1) based upon the input use_current_close = no;
Adding this to your code, both now match.
 Code:
Code:# Custom ATR Plot by 7of9 for BRT # edited 3/20/19 declare upper; input AtrAvgLength = 14; input use_current_close = no; def ATR = WildersAverage(TrueRange(high(period = aggregationPeriod.DAY), close(period = aggregationPeriod.DAY), low(period = aggregationPeriod.DAY)), AtrAvgLength)[if use_current_close then 0 else 1]; def TodayHigh = Highest(high(period = AggregationPeriod.DAY), 1); def TodayLow = Lowest(low(period = AggregationPeriod.DAY), 1); def DTR = TodayHigh - TodayLow; def DTRpct = Round((DTR / ATR) * 100, 0); AddLabel (yes, "DTR " + Round (DTR , 2) + " vs ATR " + Round (ATR, 2) + " " + Round (DTRpct, 0) + "%", (if DTRpct <= 70 then Color.GREEN else if DTRpct >= 90 then Color.RED else Color.ORANGE));
Thanks @SleepyZ, so it seems the watchlist column now agrees to the chart labels for stocks. For futures the chart and watchlist differ but maybe due to them trading 23 hours / day, etc. thanks again for your help!The SATY uses an optional offset of one(1) based upon the input use_current_close = no;
Adding this to your code, both now match.
I adapted this a little so that the 5 and 10 period ADR create an upper and lower cloud along with a 50% line variable. I've been watching it lightly off to the side with a periodic check in and I keep saying "Ok, you need to pay closer attention to this".
Enjoy:
Code:input aggregationPeriod = AggregationPeriod.DAY; def open = open(period = aggregationPeriod); def high = high(period = aggregationPeriod); def low = low(period = aggregationPeriod); def dayrange = (high - low); def adr_10 = average(dayrange,10); def adr_5 = average(dayrange,5); def hl1 = (OPEN + (adr_10 / 2)); def ll1 = (OPEN - (adr_10 / 2)); def hl2 = (OPEN + (adr_5 / 2)); def ll2 = (OPEN - (adr_5 / 2)); plot upper2 = hl1; plot lower1 = ll2; plot upper1 = hl2; plot lower2 = ll1; plot level50 = (lower1+upper1)/2; level50.setdefaultcolor(color.yellow); addCloud(upper2, upper1, color.RED, color.RED); addCloud(lower1, lower2, color.GREEN, color.GREEN); upper1.SetDefaultColor(Color.dark_red); upper2.SetDefaultColor(Color.dark_red); lower1.SetDefaultColor(Color.dark_green); lower2.SetDefaultColor(Color.dark_green);
@autolox This is a great concept. I wondered if there was a way to add the ability to adjust the inputs. As an example, lets say i wanted to compare the 3 and 9 day adr's.
Thanks!
Last edited:
@autolox This is a great concept. I wondered if there was a way to add the ability to adjust the inputs. As an example, lets say i wanted to compared the 3 and 9 day adr's or say a 2 and 6 day.
Thanks!
Sure. @autolox's script is modified below to allow the ability to adjust the inputs:
input longlen = 10 ;
input shortlen = 5 ;
Ruby:
# @Autolox ADR script
input aggregationPeriod = AggregationPeriod.DAY;
def open = open(period = aggregationPeriod);
def high = high(period = aggregationPeriod);
def low = low(period = aggregationPeriod);
def dayrange = (high - low);

input longlen = 10 ;
input shortlen = 5 ;
def adrL = average(dayrange,longlen);
def adrS = average(dayrange,shortlen);

def hl1 = (OPEN + (adrL / 2));
def ll1 = (OPEN - (adrL / 2));
def hl2 = (OPEN + (adrS / 2));
def ll2 = (OPEN - (adrS / 2));

plot upper2 = hl1;
plot lower1 = ll2;
plot upper1 = hl2;
plot lower2 = ll1;

plot level50 = (lower1+upper1)/2;
level50.setdefaultcolor(color.yellow);

addCloud(upper2, upper1, color.RED, color.RED);
addCloud(lower1, lower2, color.GREEN, color.GREEN);

upper1.SetDefaultColor(Color.dark_red);
upper2.SetDefaultColor(Color.dark_red);
lower1.SetDefaultColor(Color.dark_green);
lower2.SetDefaultColor(Color.dark_green);(Thanks @MerryDay !!)Sure. @autolox's script is modified below to allow the ability to adjust the inputs:
Ruby:# @Autolox ADR script input aggregationPeriod = AggregationPeriod.DAY; def open = open(period = aggregationPeriod); def high = high(period = aggregationPeriod); def low = low(period = aggregationPeriod); def dayrange = (high - low); input longlen = 10 ; input shortlen = 5 ; def adrL = average(dayrange,longlen); def adrS = average(dayrange,shortlen); def hl1 = (OPEN + (adrL / 2)); def ll1 = (OPEN - (adrL / 2)); def hl2 = (OPEN + (adrS / 2)); def ll2 = (OPEN - (adrS / 2)); plot upper2 = hl1; plot lower1 = ll2; plot upper1 = hl2; plot lower2 = ll1; plot level50 = (lower1+upper1)/2; level50.setdefaultcolor(color.yellow); addCloud(upper2, upper1, color.RED, color.RED); addCloud(lower1, lower2, color.GREEN, color.GREEN); upper1.SetDefaultColor(Color.dark_red); upper2.SetDefaultColor(Color.dark_red); lower1.SetDefaultColor(Color.dark_green); lower2.SetDefaultColor(Color.dark_green);
@autolox @MerryDay(Thanks @MerryDay !!)
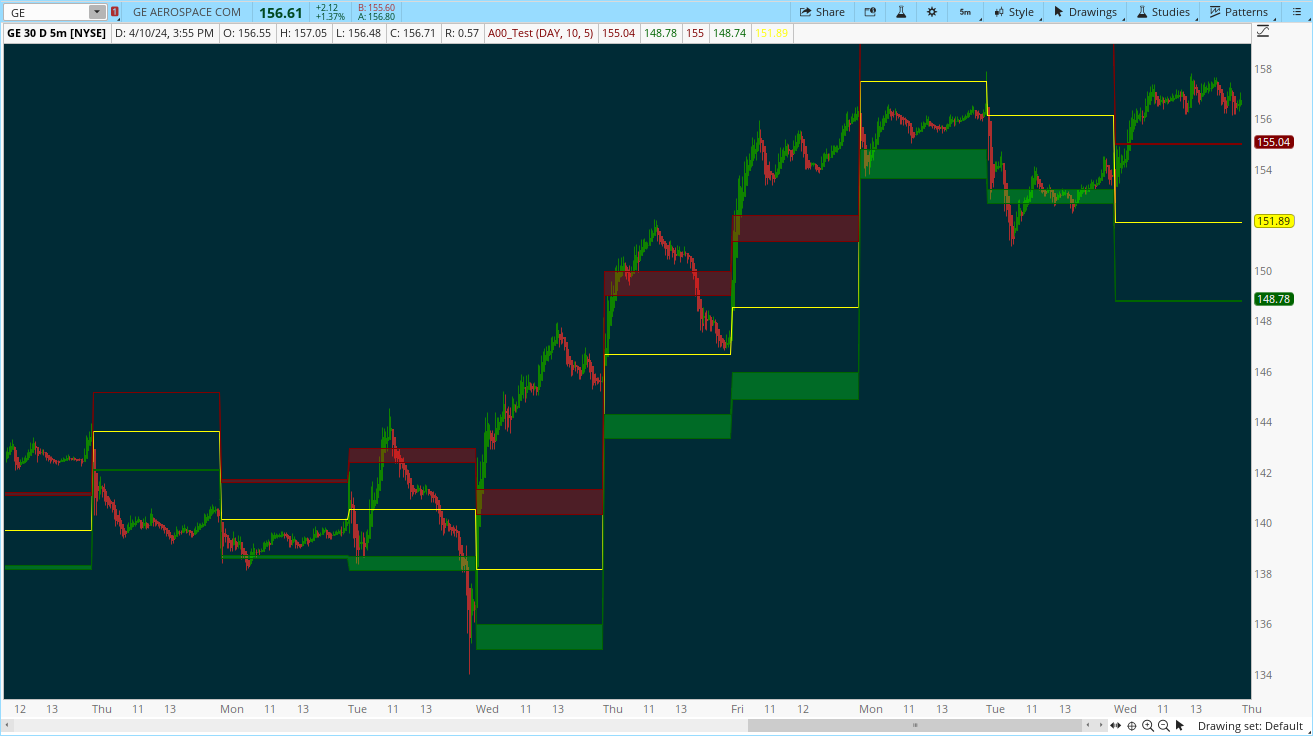
Thanks again for this script. It's wonderful. I do have a question, which probably is very easy to explain for you guys --- why is the thickness of the red/green clouds different each day?
What's the math function that's governing how wide the clouds are each day? Depending on how they are derived, I then wonder if there is a way to make the thickness more consistent, which then leads to the ability to add conviction on trades when price is around/in/outside of the clouds.
This is today's example where the upper cloud is almost 10pt wide.
I'm more curious on the math specifics. The variance of todays clouds is calculated because the ADR of (as an example) 2 an 5 days ranges are....
(Math was never my best subject, so apologies)
Thanks!
Last edited by a moderator:
@autolox @MerryDay
Thanks again for this script. It's wonderful. I do have a question, which probably is very easy to explain for you guys --- why is the thickness of the red/green clouds different each day?
What's the math function that's governing how wide the clouds are each day? Depending on how they are derived, I then wonder if there is a way to make the thickness more consistent, which then leads to the ability to add conviction on trades when price is around/in/outside of the clouds.
This is today's example where the upper cloud is almost 10pt wide.
View attachment 21812
The indicator calculates two instances of daily range, a shorter length and a longer length.
Reality: range expands and contracts.
It is the expansion/contraction during the periods calculated that cause the variance of clouds.
The cloud is merely a reflection of the difference between the two range calculations.
Each day, half of each range calculation is added to AND subtracted from the open.
Example:
If today's open = 5
2 day average = 2
5 day average = 1.8
The two lines the upper cloud (red) would draw on today would be:
5 + (2dayAvg/2) = 6
5 + (5dayAvg/2) = 5.90
The two lines the lower cloud (green) would draw on today would be:
5 - (2dayAvg/2) = 4
5 - (5dayAvg/2) = 4.10
Awesome, Thanks!!!The cloud is merely a reflection of the difference between the two range calculations.
Each day, half of each range calculation is added to AND subtracted from the open.
Example:
If today's open = 5
2 day average = 2
5 day average = 1.8
The two lines the upper cloud (red) would draw on today would be:
5 + (2dayAvg/2) = 6
5 + (5dayAvg/2) = 5.90
The two lines the lower cloud (green) would draw on today would be:
5 - (2dayAvg/2) = 4
5 - (5dayAvg/2) = 4.10
Similar threads
-
Farey Sequence Weighted Moving Average For ThinkOrSwim
- Started by AlphaOptions
- Replies: 16
-
 Volumatic Variable Index Dynamic Average [BigBeluga] for ThinkOrSwim
- Started by samer800
- Replies: 0
-
-

-
Moving Average Golden Cross - Death Cross For ThinkOrSwim
- Started by starone777
- Replies: 16
Not the exact question you're looking for?
Start a new thread and receive assistance from our community.
87k+
Posts
1562
Online
Similar threads
-
Farey Sequence Weighted Moving Average For ThinkOrSwim
- Started by AlphaOptions
- Replies: 16
-
Volumatic Variable Index Dynamic Average [BigBeluga] for ThinkOrSwim
- Started by samer800
- Replies: 0
-
-
-
Moving Average Golden Cross - Death Cross For ThinkOrSwim
- Started by starone777
- Replies: 16
The Market Trading Game Changer
Join 2,500+ subscribers inside the useThinkScript VIP Membership Club
- Exclusive indicators
- Proven strategies & setups
- Private Discord community
- ‘Buy The Dip’ signal alerts
- Exclusive members-only content
- Add-ons and resources
- 1 full year of unlimited support
Frequently Asked Questions
What is useThinkScript?
useThinkScript is the #1 community of stock market investors using indicators and other tools to power their trading strategies. Traders of all skill levels use our forums to learn about scripting and indicators, help each other, and discover new ways to gain an edge in the markets.
How do I get started?
We get it. Our forum can be intimidating, if not overwhelming. With thousands of topics, tens of thousands of posts, our community has created an incredibly deep knowledge base for stock traders. No one can ever exhaust every resource provided on our site.
If you are new, or just looking for guidance, here are some helpful links to get you started.
- The most viewed thread:
https://usethinkscript.com/threads/repainting-trend-reversal-for-thinkorswim.183/ - Our most popular indicator:
https://usethinkscript.com/threads/buy-the-dip-indicator-for-thinkorswim.3553/ - Answers to frequently asked questions:
https://usethinkscript.com/threads/answers-to-commonly-asked-questions.6006/
What are the benefits of VIP Membership?
VIP members get exclusive access to these proven and tested premium indicators: Buy the Dip, Advanced Market Moves 2.0, Take Profit, and Volatility Trading Range. In addition, VIP members get access to over 50 VIP-only custom indicators, add-ons, and strategies, private VIP-only forums, private Discord channel to discuss trades and strategies in real-time, customer support, trade alerts, and much more. Learn all about VIP membership here.
How can I access the premium indicators?
To access the premium indicators, which are plug and play ready, sign up for VIP membership here.