-
ENDS TONIGHT: Take $50 off VIP Membership with code DAD50 Claim Discount

You should upgrade or use an alternative browser.
Exporting historical data from ThinkorSwim for external analysis
- Thread starter korygill
- Start date
Join useThinkScript to post your question to a community of 21,000+ developers and traders.
@korygill that is the most fantastic idea i have ever seen. I have been struggling with what you did for months.. and i keep getting told thinkscript cannot do that but you made it do it.. My friend i will search for your handle and read ever line of text you have written here.. Hopefully i will see many ideas that with my little pea brain of thinkscript could never have thought of.. Besides i collect ever tiny thinkscript snippet that i can find as i am a horrible thinkscript programmer but i am fantastic at stitching others work together to sometimes come out with my own work of art.. Thank you so much for this.. It will improved my programming by a lot..UPDATE: 1/22/2020, a newer version of this post is on thread #20.
https://usethinkscript.com/threads/...nkorswim-for-external-analysis.507/post-14606
I do a lot of back testing with PowerShell. I am learning Python, and will move to that in the future. This article demonstrates how to export historical data from thinkorswim to a csv file, and then convert that output file to something that is a truly valid csv file which can be imported by PowerShell or any other program.
Overview of export process
This requires a few steps, and once you have done this once, subsequent exports will come naturally.
() Add a strategy to a chart that simulates a trade on every bar (1 buy to open, 1 sell to close).
This strategy will put Open, High, Low, Close (OHLC) data in the Name of the buy order. We will ignore the sell orders.
() Use the Show Report context menu to save the trades to a csv file.
The output file has extra information in it and it not a truly valid csv file.
() Run a PowerShell script I created called Get-OHLC.ps1 which transforms the csv file into a proper object which can be saved, or used in further analysis.
Export the strategy report
Open this chart in thinkorswim, it has the strategy code in it.
https://tos.mx/TM4exi
View attachment 5212
Every bar will have a buy and close. Right click one of the signals and export from Show Report menu item.
The strategy takes parameters for start/end times in the EST time zone.
Code for the kg_EveryTickOHLC strategy
Code:declare upper; declare once_per_bar; input startTime = 820; #hint startTime: start time in EST 24-hour time input endTime = 1600; #hint endTime: end time in EST 24-hour time def adjStartTime = startTime; def adjEndTime = endTime; # we use a 1 bar offset to get orders to line up, so adjust for that here def marketOpen = if SecondsTillTime(adjEndTime) >= 60 and SecondsFromTime(adjStartTime) >= -60 then 1 else 0; AddOrder(OrderType.BUY_TO_OPEN, marketOpen, low, 1, Color.White, Color.White, name="OHLC|"+open[-1]+"|"+high[-1]+"|"+low[-1]+"|"+close[-1]); AddOrder(OrderType.SELL_TO_CLOSE, marketOpen, high, 1, Color.White, Color.White, name="SellClose");
Transform the thinkorswim csv file to data you can work with
Use this PowerShell script, Get-OHLC.ps1, to transform the exported file.
Save the code below as “Get-OHLC.ps1” and run similar to the steps shown below.
Code:[CmdletBinding()] param ( [string[]] $File, [switch] $ExportAsObject ) function Convert-CurrencyStringToDecimal ([string]$input) { ((($input -replace '\$') -replace '[)]') -replace '\(', '-') -replace '[^-0-9.]' } $global:outData = [System.Collections.ArrayList]::new() foreach ($f in $File) { if (-not (Test-Path $f)) { throw "Cannot open file '$f'." } # read csv file $content = Get-Content -Path $f # find the lines that contain price information $csvdata = $content | ? {$_ -match ";.*;"} | ConvertFrom-Csv -Delimiter ';' # filter just the lines with (OHLC on them and make into CSV structure $data = $csvData | ? {$_ -match "\(OHLC"} foreach ($item in $data) { # capture the OHLC data $null = $item.Strategy -match "\(OHLC\|(.*)\)" $v = $Matches[1] -split '\|' $open = $v[0] | Convert-CurrencyStringToDecimal $high = $v[1] | Convert-CurrencyStringToDecimal $low = $v[2] | Convert-CurrencyStringToDecimal $close = $v[3] | Convert-CurrencyStringToDecimal # add to our $outData array $null = $outData.Add( [PSCustomObject]@{ 'DateTime' = ([datetime]::Parse($item.'Date/Time')) 'Open' = [decimal]$open 'High' = [decimal]$high 'Low' = [decimal]$low 'Close' = [decimal]$close } ) } } if ($ExportAsObject) { # helpful message to show caller our output variable Write-Output "Out Data $($outData.Count) items (exported as `$outData)" } else { # don't show any output, and just return the data to the pipeline return $outData }
From a PowerShell command window, run the script and pass your exported csv file as a parameter.
Examples:
D:\tos-data> $data = .\Get-OHLC.ps1 .\StrategyReports_ESXCME_81919.csv
D:\tos-data> $data = D:\tos-data\Get-OHLC.ps1 D:\tos-data\StrategyReports_ESXCME_81919.csv
The converted data is now an object:
D:\tos-data> $data[0..5] | ft
DateTime Open High Low Close
-------- ---- ---- --- -----
8/13/2019 5:20:00 AM 2874.75 2874.75 2873 2873.5
8/13/2019 5:21:00 AM 2873.25 2873.5 2872.75 2873.5
8/13/2019 5:22:00 AM 2873.25 2874 2873.25 2874
8/13/2019 5:23:00 AM 2874 2874 2872.5 2872.5
8/13/2019 5:24:00 AM 2872.75 2874 2872.75 2874
8/13/2019 5:25:00 AM 2874.25 2875 2873.75 2874.25
Save the $data object as a proper csv file:
$data | ConvertTo-Csv -NoTypeInformation | Out-File -FilePath d:\tos-data\ES-Data.csv
View attachment 5214
Start back testing!
Now that you have data, you can back test your strategies with code outside thinkorswim. Note, you can only export up to 30 days of 1-minute data. You can use OnDemand to load data beyond that, but for this amount of work, maybe getting data from a provider is a better route. Kibot, http://www.kibot.com/, is a good source, and you can find others on the web. Lastly, if you only export the subset of data you need, you can save a lot of time running the strategy in thinkorswim.
Happy trading,
Kory Gill, @korygill
James your Fan.... for life.
UPDATE: 1/22/2020, a newer version of this post is on thread #20.
https://usethinkscript.com/threads/...nkorswim-for-external-analysis.507/post-14606
I do a lot of back testing with PowerShell. I am learning Python, and will move to that in the future.
@korygill .. question.. you use the collected hloc data to back test.. what program do you place the data to make it run a back test. Like i use TOS a lot but as far as i know there is no way to convince it to use any external data for backtesting.. I would love to have the ability to back test based on my modified hloc data. For example i experiment with RSI a lot and have to go back and find a history of code that goes from say RSI 30 to RSI 70 in short order.. but usually takes hours or days.. I could modify the hloc to go from RSI 30 to RSI 70 in maybe 30 min for a qucker test but so far have not been able to achieve a way to feed my back test data to any engine other that Meta forex stuff that has text files available that you can see and access that they use for backtest.. and most like you cannot change those text files due to no edit capability not sure about that.. Does Trading View allow you to feed them with personal back test data.. Any suggestions would be great. If you could set up the data to make it do what you want for example gap up every 30 min etc. Then you could do some deep testing when working with how to best catch the gap. Would love to find a way to get hloc data into TOS.. And thanks again for showing me how to extract hloc from Tos.. I was told here on this site that what you did could not be done... That is what i like a man that sees a can't be done is just a challenge..Thanks again.
@korygill .. question.. you use the collected hloc data to back test.. what program do you place the data to make it run a back test. Like i use TOS a lot but as far as i know there is no way to convince it to use any external data for backtesting.. I would love to have the ability to back test based on my modified hloc data. For example i experiment with RSI a lot and have to go back and find a history of code that goes from say RSI 30 to RSI 70 in short order.. but usually takes hours or days.. I could modify the hloc to go from RSI 30 to RSI 70 in maybe 30 min for a qucker test but so far have not been able to achieve a way to feed my back test data to any engine other that Meta forex stuff that has text files available that you can see and access that they use for backtest.. and most like you cannot change those text files due to no edit capability not sure about that.. Does Trading View allow you to feed them with personal back test data.. Any suggestions would be great. If you could set up the data to make it do what you want for example gap up every 30 min etc. Then you could do some deep testing when working with how to best catch the gap. Would love to find a way to get hloc data into TOS.. And thanks again for showing me how to extract hloc from Tos.. I was told here on this site that what you did could not be done... That is what i like a man that sees a can't be done is just a challenge..Thanks again.
@tommybc Unfortunately, in the TOS platform the only data we can import is Equity Symbols into Watchlists, nothing else... Several areas within the platform allow for exporting, but not importing...
Thank you very much for this great script.UPDATED workflow as of 1/22/2020
I do a lot of back testing with PowerShell. This article demonstrates how to export historical data from thinkorswim to a csv file, and then convert that output file to something that is a truly valid csv file which can be imported by PowerShell or any other program.
Overview of export process
This requires a few steps, and once you have done this once, subsequent exports will come naturally.
() Add a strategy to a chart that simulates a trade on every bar (1 buy to open, 1 sell to close).
This strategy will put Symbol, Open, High, Low, Close, PreviousClose (SOHLCP) data in the Name of the buy order. We will ignore the sell orders.
() Use the Show Report context menu to save the trades to a csv file.
The output file has extra information in it and it not a truly valid csv file.
() Run a PowerShell script I created called Get-SOHLCP.ps1 which transforms the csv file into a proper object which can be saved, or used in further analysis.
Export the strategy report
Open this chart in thinkorswim, it has the strategy code in it.
From your main TOS window, use Setup | Open Shared Item and paste this link in:
https://tos.mx/1FmyWu4
View attachment 6555
Every bar will have a buy and close. Right click one of the signals and export from Show Report menu item.
The strategy takes parameters for start/end times in the EST time zone.
Code for the kg_EveryTickSOHLCP strategy
Code:# # kg_EveryTickSOHLCP # # Strategy to capture every bar OHLC and P, the previous close. # Useful for exporting data from TOS into a CSV file for further processing. # # Author: Kory Gill, @korygill # declare upper; declare once_per_bar; input startTime = 820; #hint startTime: start time in EST 24-hour time input endTime = 1600; #hint endTime: end time in EST 24-hour time def adjStartTime = startTime;# - 1; def adjEndTime = endTime;# - 1; def agg = GetAggregationPeriod(); # we use a 1 bar offset to get orders to line up, so adjust for that here def marketOpen = if agg >= AggregationPeriod.DAY then 1 else if SecondsTillTime(adjEndTime) >= 60 and SecondsFromTime(adjStartTime) >= -60 then 1 else 0; AddOrder(OrderType.BUY_TO_OPEN, marketOpen, low, 1, Color.White, Color.White, name="SOHLCP|"+GetSymbol()+"|"+open[-1]+"|"+high[-1]+"|"+low[-1]+"|"+close[-1]+"|"+close); AddOrder(OrderType.SELL_TO_CLOSE, marketOpen, high, 1, Color.White, Color.White, name="SellClose");
Transform the thinkorswim csv file to data you can work with
Use this PowerShell script, Get-SOHLCP.ps1, to transform the exported file.
Save the code below as “Get-SOHLCP.ps1” and run similar to the steps shown below.
Code:# # Get-SOHLCP.ps1 # # Script to convert a TOS ThinkOrSwim kg_EveryTickOHLCP strategy report csv file to an object and/or proper csv data file. # # Author: Kory Gill, @korygill # [CmdletBinding()] param ( [string[]] $File, [switch] $ExportAsObject ) function Convert-CurrencyStringToDecimal ([string]$input) { ((($input -replace '\$') -replace '[)]') -replace '\(', '-') -replace '[^-0-9.]' } $global:sohlcpData = New-Object System.Collections.Generic.List[PSCustomObject] foreach ($f in $File) { if (-not (Test-Path $f)) { throw "Cannot open file '$f'." } # read csv file $content = Get-Content -Path $f # find the lines that contain price information $csvdata = $content | ? {$_ -match ";.*;"} | ConvertFrom-Csv -Delimiter ';' # filter just the lines with (OHLC on them and make into CSV structure $data = $csvData | ? {$_ -match "\(SOHLCP"} foreach ($item in $data) { # capture the OHLC data $null = $item.Strategy -match "\(SOHLCP\|(.*)\)" $v = $Matches[1] -split '\|' $symbol = $v[0] $open = $v[1] | Convert-CurrencyStringToDecimal $high = $v[2] | Convert-CurrencyStringToDecimal $low = $v[3] | Convert-CurrencyStringToDecimal $close = $v[4] | Convert-CurrencyStringToDecimal $prevClose = $v[5] | Convert-CurrencyStringToDecimal # add to our $sohlcpData array $null = $sohlcpData.Add( [PSCustomObject]@{ 'Symbol' = $symbol 'DateTime' = ([datetime]::Parse($item.'Date/Time')) 'Open' = [decimal]$open 'High' = [decimal]$high 'Low' = [decimal]$low 'Close' = [decimal]$close 'PrevClose' = [decimal]$prevClose } ) } } if ($ExportAsObject) { # helpful message to show caller our output variable Write-Output "Out Data $($sohlcpData.Count) items (exported as `$sohlcpData)" } else { # don't show any output, and just return the data to the pipeline return $sohlcpData }
From a PowerShell command window, run the script and pass your exported csv file as a parameter.
Examples:
$data = .\Get-OHLC.ps1 .\StrategyReports_ESXCME_81919.csv
$data = D:\tos-data\Get-OHLC.ps1 D:\tos-data\StrategyReports_ESXCME_81919.csv
The converted data is now an object:
$data | ft
Code:Symbol DateTime Open High Low Close PrevClose ------ -------- ---- ---- --- ----- --------- /ES:XCME 1/17/2020 12:00:00 AM 3316.75 3330.25 3316 3323.75 3317.25 /ES:XCME 1/21/2020 12:00:00 AM 3325 3329.75 3307.25 3320.25 3323.75 /ES:XCME 1/22/2020 12:00:00 AM 3321.25 3337.5 3315.25 3317.25 3320.25
or
$data | ft
Code:Symbol DateTime Open High Low Close PrevClose ------ -------- ---- ---- --- ----- --------- /ES:XCME 1/17/2020 6:30:00 AM 3325.25 3326 3323.75 3324.5 3325.5 /ES:XCME 1/17/2020 6:31:00 AM 3324.25 3324.5 3322.25 3322.25 3324.5 /ES:XCME 1/17/2020 6:32:00 AM 3322.25 3322.75 3320.75 3321.75 3322.25 /ES:XCME 1/17/2020 6:33:00 AM 3321.75 3322.5 3321 3322.25 3321.75 /ES:XCME 1/17/2020 6:34:00 AM 3322.25 3322.5 3321.5 3322 3322.25 /ES:XCME 1/17/2020 6:35:00 AM 3322.25 3323.5 3321.75 3323 3322 /ES:XCME 1/20/2020 6:30:00 AM 3321 3321.25 3320.5 3320.5 3320.75 /ES:XCME 1/20/2020 6:31:00 AM 3320.75 3320.75 3320.25 3320.5 3320.5 /ES:XCME 1/20/2020 6:32:00 AM 3320.5 3321.75 3320.5 3321.75 3320.5 /ES:XCME 1/20/2020 6:33:00 AM 3321.5 3321.75 3321 3321.25 3321.75 /ES:XCME 1/20/2020 6:34:00 AM 3321.25 3321.75 3321 3321.5 3321.25 /ES:XCME 1/20/2020 6:35:00 AM 3321.5 3321.75 3321.25 3321.75 3321.5
Save the $data object as a proper csv file:
$data | ConvertTo-Csv -NoTypeInformation | Out-File -FilePath d:\tos-data\ES-Data.csv
View attachment 6556
Start back testing!
Now that you have data, you can back test your strategies with code outside thinkorswim. Note, you can only export up to 30 days of 1-minute data. You can use OnDemand to load data beyond that, but for this amount of work, maybe getting data from a provider is a better route. Kibot, http://www.kibot.com/, is a good source, and you can find others on the web. Lastly, if you only export the subset of data you need, you can save a lot of time running the strategy in thinkorswim.
Happy trading,
Kory Gill, @korygill
I am trying to use it to get the data for the SPX with opens at 9:30 and no premarket data so if I want to use 5/15/30M candles, I will always lose the OHLC of the first candle.
Just wondering if there is some way to grab it other than manually?
Also, is there a way to separate the Date and Time in the powershell script so they would be in separate columns?
Thanks again
* About the Stocks financial data sources
When you use the Stocks data type or the STOCKHISTORY function to obtain stock prices and other company information, that information is provided by another company.Data Providers
Fundamental company data, historical data, real-time and delayed prices, fund summary and performance data are provided by LSEG Data & Analytics.Use of LSEG Data & Analytics data must be in accordance with the Microsoft Service Agreement
I hope this helps.
") For Entertainment Purposes Only
For Entertainment Purposes Only Attachments
UPDATE: 1/22/2020, a newer version of this post is on thread #20.
https://usethinkscript.com/threads/...nkorswim-for-external-analysis.507/post-14606
I do a lot of back testing with PowerShell. I am learning Python, and will move to that in the future. This article demonstrates how to export historical data from thinkorswim to a csv file, and then convert that output file to something that is a truly valid csv file which can be imported by PowerShell or any other program.
Overview of export process
This requires a few steps, and once you have done this once, subsequent exports will come naturally.
() Add a strategy to a chart that simulates a trade on every bar (1 buy to open, 1 sell to close).
This strategy will put Open, High, Low, Close (OHLC) data in the Name of the buy order. We will ignore the sell orders.
() Use the Show Report context menu to save the trades to a csv file.
The output file has extra information in it and it not a truly valid csv file.
() Run a PowerShell script I created called Get-OHLC.ps1 which transforms the csv file into a proper object which can be saved, or used in further analysis.
Export the strategy report
Open this chart in thinkorswim, it has the strategy code in it.
https://tos.mx/TM4exi
View attachment 5212
Every bar will have a buy and close. Right click one of the signals and export from Show Report menu item.
The strategy takes parameters for start/end times in the EST time zone.
Code for the kg_EveryTickOHLC strategy
Code:declare upper; declare once_per_bar; input startTime = 820; #hint startTime: start time in EST 24-hour time input endTime = 1600; #hint endTime: end time in EST 24-hour time def adjStartTime = startTime; def adjEndTime = endTime; # we use a 1 bar offset to get orders to line up, so adjust for that here def marketOpen = if SecondsTillTime(adjEndTime) >= 60 and SecondsFromTime(adjStartTime) >= -60 then 1 else 0; AddOrder(OrderType.BUY_TO_OPEN, marketOpen, low, 1, Color.White, Color.White, name="OHLC|"+open[-1]+"|"+high[-1]+"|"+low[-1]+"|"+close[-1]); AddOrder(OrderType.SELL_TO_CLOSE, marketOpen, high, 1, Color.White, Color.White, name="SellClose");
Transform the thinkorswim csv file to data you can work with
Use this PowerShell script, Get-OHLC.ps1, to transform the exported file.
Save the code below as “Get-OHLC.ps1” and run similar to the steps shown below.
Code:[CmdletBinding()] param ( [string[]] $File, [switch] $ExportAsObject ) function Convert-CurrencyStringToDecimal ([string]$input) { ((($input -replace '\$') -replace '[)]') -replace '\(', '-') -replace '[^-0-9.]' } $global:outData = [System.Collections.ArrayList]::new() foreach ($f in $File) { if (-not (Test-Path $f)) { throw "Cannot open file '$f'." } # read csv file $content = Get-Content -Path $f # find the lines that contain price information $csvdata = $content | ? {$_ -match ";.*;"} | ConvertFrom-Csv -Delimiter ';' # filter just the lines with (OHLC on them and make into CSV structure $data = $csvData | ? {$_ -match "\(OHLC"} foreach ($item in $data) { # capture the OHLC data $null = $item.Strategy -match "\(OHLC\|(.*)\)" $v = $Matches[1] -split '\|' $open = $v[0] | Convert-CurrencyStringToDecimal $high = $v[1] | Convert-CurrencyStringToDecimal $low = $v[2] | Convert-CurrencyStringToDecimal $close = $v[3] | Convert-CurrencyStringToDecimal # add to our $outData array $null = $outData.Add( [PSCustomObject]@{ 'DateTime' = ([datetime]::Parse($item.'Date/Time')) 'Open' = [decimal]$open 'High' = [decimal]$high 'Low' = [decimal]$low 'Close' = [decimal]$close } ) } } if ($ExportAsObject) { # helpful message to show caller our output variable Write-Output "Out Data $($outData.Count) items (exported as `$outData)" } else { # don't show any output, and just return the data to the pipeline return $outData }
From a PowerShell command window, run the script and pass your exported csv file as a parameter.
Examples:
D:\tos-data> $data = .\Get-OHLC.ps1 .\StrategyReports_ESXCME_81919.csv
D:\tos-data> $data = D:\tos-data\Get-OHLC.ps1 D:\tos-data\StrategyReports_ESXCME_81919.csv
The converted data is now an object:
D:\tos-data> $data[0..5] | ft
DateTime Open High Low Close
-------- ---- ---- --- -----
8/13/2019 5:20:00 AM 2874.75 2874.75 2873 2873.5
8/13/2019 5:21:00 AM 2873.25 2873.5 2872.75 2873.5
8/13/2019 5:22:00 AM 2873.25 2874 2873.25 2874
8/13/2019 5:23:00 AM 2874 2874 2872.5 2872.5
8/13/2019 5:24:00 AM 2872.75 2874 2872.75 2874
8/13/2019 5:25:00 AM 2874.25 2875 2873.75 2874.25
Save the $data object as a proper csv file:
$data | ConvertTo-Csv -NoTypeInformation | Out-File -FilePath d:\tos-data\ES-Data.csv
View attachment 5214
Start back testing!
Now that you have data, you can back test your strategies with code outside thinkorswim. Note, you can only export up to 30 days of 1-minute data. You can use OnDemand to load data beyond that, but for this amount of work, maybe getting data from a provider is a better route. Kibot, http://www.kibot.com/, is a good source, and you can find others on the web. Lastly, if you only export the subset of data you need, you can save a lot of time running the strategy in thinkorswim.
Happy trading,
Kory Gill, @korygill
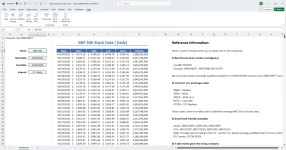
I use this excel file to download *historical prices. For the most part you can use just use the regular symbol but if it's being reused from a delisted old stock then refer to my reference info within the file.
* About the Stocks financial data sources
When you use the Stocks data type or the STOCKHISTORY function to obtain stock prices and other company information, that information is provided by another company.
Data Providers
Fundamental company data, historical data, real-time and delayed prices, fund summary and performance data are provided by LSEG Data & Analytics.
Use of LSEG Data & Analytics data must be in accordance with the Microsoft Service Agreement
I hope this helps.
This project is for Kory Gill the inventor of the OHLC grabber from Schwab.
I love his idea and have heard him speak about learning Python to make his
conversion faster and less messy so here it is i did it all for him.
Hope you like it Kory and its simple enough that you can modify it yourself
with little effort and little python knowledge and if you need me to do more
and make it stand on its head and do cartwheels just let me know buddy, You had
a great idea and i just made it easier for every one to use.
To make that all work hopefully you understand how to use the authors
ideas on what to do with your thinkscript.. and if you have problems withy
that contact him... but remember to set up do the following
1. Make your self a directory off the c drive called c:\OHLC_DATA upper
case as you see here.. and if you do this you won't need to tamper with
my .bat afile.
2. Be sure to name the file from TOS exactly OHLC.cvs with lower case
csv.. and save it in your c:\OHLC_DATA folder and tos will then remem
ber that directory and all future ones will land there... the saved file
will in every case be named OHLC.csv.. and then when you insert the
Symbol in line 4 or 5 in my ohlc.py file it will load the file and put
it out in that same directory as SPXOHLC.csv assuming your symbol sym is
set to SPX so be sure you enter the same symbol as you used when you ran
the TOS file and all is well. Just below you can see an example of where
the sym ="SPX" goes... happy OHLCing.
# OHLC.py
import os
import re
# ================= CONFIGURATION =================
sym = "SPX"
On the line that says sym = change it to the symbol name.. and the outfile will become SPXOHLC.csv
The incoming file name will always be OHLC.csv with lower case extension
Things to watch for but i don't think they really matter.. but if its a problem for you let
me know and i will update the script for you.
First is when the month is 1 letter and not two like 6 or 12 it will cause a mis align of the
text for example notice the single and double digits do not column aligne perfect.
Also notice when the price does not have all 8 digits it will misalign a tiny bit should not
matter since there is a mandatory space between each entry.
6/12/26 9:33:00 AM 7406.3 7406.96 7394.2 7394.2
6/12/26 9:34:00 AM 7394.53 7398 7392.51 7395.98
Notice the center line 7417.19 looks out of line but its fine as you
notice exactly one space between each one.. it is fine.
6/12/26 12:18:00 PM 7426.26 7428.12 7419.99 7419.99
6/12/26 12:19:00 PM 7420 7420.23 7417.19 7418.6
6/12/26 12:20:00 PM 7418.87 7423.14 7414.11 7414.11
Look how short some of these are but they are perfect if you look at each
line one by one..
6/15/26 12:17:00 PM 7572.32 7572.47 7571.3 7571.3
6/15/26 12:18:00 PM 7571.33 7572.26 7571 7571
6/15/26 12:19:00 PM 7571.16 7573.07 7570.5 7573
6/15/26 12:20:00 PM 7573 7574.6 7572.75 7573.37
6/15/26 12:21:00 PM 7573.43 7574.94 7573.43 7574.83
if any of these misalignment bother you let me know and i can reformat
all the numbers to 2 decimal points and they will look perfect but will
not do one damn thing better for you.. Have fun.. hope this helps.
not taking credit for any of this but just thought i would add python
to make it faster and easier..
By the way i am a Schwab API genie. genius and built all sorts of stuff
just for the fun of it.. and can assemble most anything in short order.
One api tool that i am the most proud of is the one that queries the
Telegram and the instant anything comes in from any of my ton of lead
purchases.. it auto grabs the lead, formats it and dumps it into schwab
sight unseen.. but normally it beeps and i can then look at the Tos to
sure all went well and it adds the stop loss and target so that its fully
automated.. And i also have an html that can appear on any tv screen and
monitor in the world due to its on the web which tracks all 50 of my
live contracts and at a moments notice i can see the P/L of all 50 at
once without even turning on my TOS program.. let me tell you the Schwab
API is wonderful.
If you have any great ideas that you want fully automated let me know if
i consider it worthy of my time i will program it for free..
Have a nice day you all..
If you find any problems with my fast converter python tool above let me
know won't take a jiffy to fix.
Hey cory here is the latest version of the python formatter for you as i heard you say you wanted to do it in python and was learning.. This is a very simple version that you can hack to do other stufff like this. but if you have any problems let me know.. I spent several hours on this and then another several hours trying to get it uploaded.. Almost decided not to upload as management is so wild about gettign their cut as i was a full menmber but hardly ever used it.. plus now as free memeber even when you have a great donation you are hindered so bad you just do not want to contribute but i finally got it uploaded but the .bat and .py have to ber renamed as they would not allow upload.. if you ahve any questions let me know i get up here about once a month now.. plus this will take several days to be available to the public.. Early on i did not see the sample with your quotes and build without the quotes but the new one has the quotes.. Let me know if it works ok or not. if not i am hard to catch.. due to a free member.. but i can tell you due to how hard this was i wont be donating again.. if i do not respoind on here to you.. give me a ring at [email protected]
mn88 the best effect for using python with TOS is via the Schwab API... i love it.. live and breathe it..@korygill
If you dont mind me asking have you found any ways to use Python with Think or Swim? Or are you just using it to backtest with historical data? I am trying to learn Python also on https://www.quantconnect.com/ which can tie into a couple of different trading platforms but I havent seen anything for Python with Think or Swim. Also if you have found any good resources for learning how to use Python for trading you wouldnt mind sharing I would appreciate it.
The site I linked above looks cool for backtesting once I learn Python, it also has labs to help teach Python for trading for free if anyone else is interested.
Lastly thank you for this post, nice work!
There is amost nothing that you cannot do with it but do API to paper trading. I have just donated the python to do the dirty clean up stuff for this superb project that Kory started.. i dumped it last night but will take a few days to get posted as i am a free user and they punish free users with a 3-5 day delay when posting.. even when donating.. still delayed.. i almost did not donate the python script for this very project as they were giveimg me such a hard time.. i have done a ton of API stuff with python for the Schwab API.. My latest project is setting up an auto parser for Telegram and as soon as any lead that i buy shows up it grabs it off Telegram, formats it and dumps it into the Schwab API live hands off. love it.. Also i have usually a min of 50 contracts on all the time and very diffiecults to keep up with them all.. So thru the api i set up an html made with 50 windows and i can see every single one of my profit and loss at the same tiem.. and can id which ones are important and they go red and blainking when anything important happesm.. my zero dte are all atogherer in a group.. so i can wathc all 12 at once..itts just unbelievable.. i wish more folks would signe up for the api and have our own group developing all the time.. i usually do 1-2 special tools on the api daily and there is just no one to share them with as so few are on the API..
This may take a few days to post but i am sure you will see it in a few days.
Take a look at my post above at 1103 pm sat night..i recently completed a python script that can take your download direct and via python convert it seamlessly to ready for back test .. Also its a simple script that you or any of your advid followers can tweak to their exact uses.. and if anyone does not have basci python knowledge i can make the code conversion for you or any of you followes... I tried to upload it all when i wass a free member but that did not work well.. but you can see the file names listed and if you would like i can upload it for you and anyone elses who wishes to use it.....very very simple python script that reads the data from you downloaded file that you made the thinkscript for and converts it most any way you like to use it for backtesting.. just tell me how to load it in one package so you can place it where ever you like for others to access..
Look forward to hearing from you as i love your pgm and just want to add another method of converting a lott sismpler that what you have and of course as we know pything can make it come out any way you need it with just one button press..
Similar threads
-
-
-
Why You Shouldn't Try To Work With Options Data On Charts In ThinkOrSwim
- Started by StoneMan
- Replies: 2
-
-
 What Data Is Available In Scans & Watchlists For ThinkOrSwim
- Started by merryDay
- Replies: 0
Not the exact question you're looking for?
Start a new thread and receive assistance from our community.
Similar threads
-
-
-
Why You Shouldn't Try To Work With Options Data On Charts In ThinkOrSwim
- Started by StoneMan
- Replies: 2
-
-
What Data Is Available In Scans & Watchlists For ThinkOrSwim
- Started by merryDay
- Replies: 0
Similar threads
-
-
-
Why You Shouldn't Try To Work With Options Data On Charts In ThinkOrSwim
- Started by StoneMan
- Replies: 2
-
-
What Data Is Available In Scans & Watchlists For ThinkOrSwim
- Started by merryDay
- Replies: 0
The Market Trading Game Changer
- Exclusive indicators
- Proven strategies & setups
- Private Discord community
- ‘Buy The Dip’ signal alerts
- Exclusive members-only content
- Add-ons and resources
- 1 full year of unlimited support
Frequently Asked Questions
useThinkScript is the #1 community of stock market investors using indicators and other tools to power their trading strategies. Traders of all skill levels use our forums to learn about scripting and indicators, help each other, and discover new ways to gain an edge in the markets.
We get it. Our forum can be intimidating, if not overwhelming. With thousands of topics, tens of thousands of posts, our community has created an incredibly deep knowledge base for stock traders. No one can ever exhaust every resource provided on our site.
If you are new, or just looking for guidance, here are some helpful links to get you started.
- The most viewed thread:
https://usethinkscript.com/threads/repainting-trend-reversal-for-thinkorswim.183/ - Our most popular indicator:
https://usethinkscript.com/threads/buy-the-dip-indicator-for-thinkorswim.3553/ - Answers to frequently asked questions:
https://usethinkscript.com/threads/answers-to-commonly-asked-questions.6006/