
UPDATE: 1/22/2020, a newer version of this post is on thread #20.
https://usethinkscript.com/threads/...nkorswim-for-external-analysis.507/post-14606
I do a lot of back testing with PowerShell. I am learning Python, and will move to that in the future. This article demonstrates how to export historical data from thinkorswim to a csv file, and then convert that output file to something that is a truly valid csv file which can be imported by PowerShell or any other program.
Overview of export process
This requires a few steps, and once you have done this once, subsequent exports will come naturally.
() Add a strategy to a chart that simulates a trade on every bar (1 buy to open, 1 sell to close).
This strategy will put Open, High, Low, Close (OHLC) data in the Name of the buy order. We will ignore the sell orders.
() Use the Show Report context menu to save the trades to a csv file.
The output file has extra information in it and it not a truly valid csv file.
() Run a PowerShell script I created called Get-OHLC.ps1 which transforms the csv file into a proper object which can be saved, or used in further analysis.
Export the strategy report
Open this chart in thinkorswim, it has the strategy code in it.
https://tos.mx/TM4exi

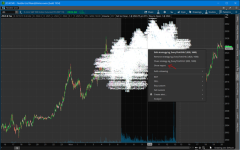
Every bar will have a buy and close. Right click one of the signals and export from Show Report menu item.
The strategy takes parameters for start/end times in the EST time zone.
Code for the kg_EveryTickOHLC strategy
Transform the thinkorswim csv file to data you can work with
Use this PowerShell script, Get-OHLC.ps1, to transform the exported file.
Save the code below as “Get-OHLC.ps1” and run similar to the steps shown below.
From a PowerShell command window, run the script and pass your exported csv file as a parameter.
Examples:
D:\tos-data> $data = .\Get-OHLC.ps1 .\StrategyReports_ESXCME_81919.csv
D:\tos-data> $data = D:\tos-data\Get-OHLC.ps1 D:\tos-data\StrategyReports_ESXCME_81919.csv
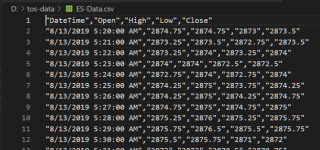
The converted data is now an object:
D:\tos-data> $data[0..5] | ft
DateTime Open High Low Close
-------- ---- ---- --- -----
8/13/2019 5:20:00 AM 2874.75 2874.75 2873 2873.5
8/13/2019 5:21:00 AM 2873.25 2873.5 2872.75 2873.5
8/13/2019 5:22:00 AM 2873.25 2874 2873.25 2874
8/13/2019 5:23:00 AM 2874 2874 2872.5 2872.5
8/13/2019 5:24:00 AM 2872.75 2874 2872.75 2874
8/13/2019 5:25:00 AM 2874.25 2875 2873.75 2874.25
Save the $data object as a proper csv file:
$data | ConvertTo-Csv -NoTypeInformation | Out-File -FilePath d:\tos-data\ES-Data.csv

Start back testing!
Now that you have data, you can back test your strategies with code outside thinkorswim. Note, you can only export up to 30 days of 1-minute data. You can use OnDemand to load data beyond that, but for this amount of work, maybe getting data from a provider is a better route. Kibot, http://www.kibot.com/, is a good source, and you can find others on the web. Lastly, if you only export the subset of data you need, you can save a lot of time running the strategy in thinkorswim.
Happy trading,
Kory Gill, @korygill
https://usethinkscript.com/threads/...nkorswim-for-external-analysis.507/post-14606
I do a lot of back testing with PowerShell. I am learning Python, and will move to that in the future. This article demonstrates how to export historical data from thinkorswim to a csv file, and then convert that output file to something that is a truly valid csv file which can be imported by PowerShell or any other program.
Overview of export process
This requires a few steps, and once you have done this once, subsequent exports will come naturally.
() Add a strategy to a chart that simulates a trade on every bar (1 buy to open, 1 sell to close).
This strategy will put Open, High, Low, Close (OHLC) data in the Name of the buy order. We will ignore the sell orders.
() Use the Show Report context menu to save the trades to a csv file.
The output file has extra information in it and it not a truly valid csv file.
() Run a PowerShell script I created called Get-OHLC.ps1 which transforms the csv file into a proper object which can be saved, or used in further analysis.
Export the strategy report
Open this chart in thinkorswim, it has the strategy code in it.
https://tos.mx/TM4exi
Every bar will have a buy and close. Right click one of the signals and export from Show Report menu item.
The strategy takes parameters for start/end times in the EST time zone.
Code for the kg_EveryTickOHLC strategy
Code:
declare upper;
declare once_per_bar;

input startTime = 820; #hint startTime: start time in EST 24-hour time
input endTime = 1600; #hint endTime: end time in EST 24-hour time

def adjStartTime = startTime;
def adjEndTime = endTime;

# we use a 1 bar offset to get orders to line up, so adjust for that here
def marketOpen = if SecondsTillTime(adjEndTime) >= 60 and SecondsFromTime(adjStartTime) >= -60 then 1 else 0;

AddOrder(OrderType.BUY_TO_OPEN, marketOpen, low, 1, Color.White, Color.White, name="OHLC|"+open[-1]+"|"+high[-1]+"|"+low[-1]+"|"+close[-1]);
AddOrder(OrderType.SELL_TO_CLOSE, marketOpen, high, 1, Color.White, Color.White, name="SellClose");
Transform the thinkorswim csv file to data you can work with
Use this PowerShell script, Get-OHLC.ps1, to transform the exported file.
Save the code below as “Get-OHLC.ps1” and run similar to the steps shown below.
Code:
[CmdletBinding()]
param (
    [string[]]
    $File,

    [switch]
    $ExportAsObject
)

function Convert-CurrencyStringToDecimal ([string]$input)
{
    ((($input -replace '\$') -replace '[)]') -replace '\(', '-') -replace '[^-0-9.]'
}

$global:outData = [System.Collections.ArrayList]::new()

foreach ($f in $File)
{
    if (-not (Test-Path $f))
    {
        throw "Cannot open file '$f'."
    }

    # read csv file
    $content = Get-Content -Path $f
    # find the lines that contain price information
    $csvdata = $content | ? {$_ -match ";.*;"} | ConvertFrom-Csv -Delimiter ';'

    # filter just the lines with (OHLC on them and make into CSV structure
    $data = $csvData | ? {$_ -match "\(OHLC"}

    foreach ($item in $data)
    {
        # capture the OHLC data
        $null = $item.Strategy -match "\(OHLC\|(.*)\)"
        $v = $Matches[1] -split '\|'

        $open  = $v[0] | Convert-CurrencyStringToDecimal
        $high  = $v[1] | Convert-CurrencyStringToDecimal
        $low   = $v[2] | Convert-CurrencyStringToDecimal
        $close = $v[3] | Convert-CurrencyStringToDecimal

        # add to our $outData array
        $null = $outData.Add(
            [PSCustomObject]@{
                'DateTime' = ([datetime]::Parse($item.'Date/Time'))
                'Open' = [decimal]$open
                'High' = [decimal]$high
                'Low' = [decimal]$low
                'Close' = [decimal]$close
                }
            )
    }
}

if ($ExportAsObject)
{
    # helpful message to show caller our output variable
    Write-Output "Out Data $($outData.Count) items (exported as `$outData)"
}
else
{
    # don't show any output, and just return the data to the pipeline
    return $outData
}
From a PowerShell command window, run the script and pass your exported csv file as a parameter.
Examples:
D:\tos-data> $data = .\Get-OHLC.ps1 .\StrategyReports_ESXCME_81919.csv
D:\tos-data> $data = D:\tos-data\Get-OHLC.ps1 D:\tos-data\StrategyReports_ESXCME_81919.csv
The converted data is now an object:
D:\tos-data> $data[0..5] | ft
DateTime Open High Low Close
-------- ---- ---- --- -----
8/13/2019 5:20:00 AM 2874.75 2874.75 2873 2873.5
8/13/2019 5:21:00 AM 2873.25 2873.5 2872.75 2873.5
8/13/2019 5:22:00 AM 2873.25 2874 2873.25 2874
8/13/2019 5:23:00 AM 2874 2874 2872.5 2872.5
8/13/2019 5:24:00 AM 2872.75 2874 2872.75 2874
8/13/2019 5:25:00 AM 2874.25 2875 2873.75 2874.25
Save the $data object as a proper csv file:
$data | ConvertTo-Csv -NoTypeInformation | Out-File -FilePath d:\tos-data\ES-Data.csv
Start back testing!
Now that you have data, you can back test your strategies with code outside thinkorswim. Note, you can only export up to 30 days of 1-minute data. You can use OnDemand to load data beyond that, but for this amount of work, maybe getting data from a provider is a better route. Kibot, http://www.kibot.com/, is a good source, and you can find others on the web. Lastly, if you only export the subset of data you need, you can save a lot of time running the strategy in thinkorswim.
Happy trading,
Kory Gill, @korygill
Attachments
Last edited:
