
You should upgrade or use an alternative browser.
Exporting historical data from ThinkorSwim for external analysis
- Thread starter korygill
- Start date
Join useThinkScript to post your question to a community of 21,000+ developers and traders.
Question: Instead of reading into the memory array - why not print them directly to the file? That would save memory .. right?Update on 9/25/2020
I get a lot of requests for how to add Volume to the study, so I have made an update to the scripts for Volume. The important thing to notice/understand is how you add data to the TOS script separated by the | vertical bar and then keeping the PowerShell script in sync with the ordering of the fields/columns/data you are encoding on TOS in the Buy Order so they can be parsed meaninfully.
See my YouTube video with a walk through of how to export historical data and run a PowerShell script to generate a proper csv file. Also includes adding additional data like other indicators to the csv data.
See previous posts for more information as well about exporting historical data.
https://usethinkscript.com/threads/...nkorswim-for-external-analysis.507/post-14606
and
https://usethinkscript.com/threads/...m-for-external-analysis.507/page-2#post-17387
Video:
Strategy Code:
Code:# # kg_EveryTickSOHLCP # # Strategy to capture every bar OHLC and P, the previous close. # Useful for exporting data from TOS into a CSV file for further processing. # # Author: Kory Gill, @korygill # declare upper; declare once_per_bar; input startTime = 820; #hint startTime: start time in EST 24-hour time input endTime = 1600; #hint endTime: end time in EST 24-hour time def adjStartTime = startTime;# - 1; def adjEndTime = endTime;# - 1; def agg = GetAggregationPeriod(); # we use a 1 bar offset to get orders to line up, so adjust for that here def marketOpen = 1;#if agg >= AggregationPeriod.DAY then 1 else if SecondsTillTime(adjEndTime) >= 60 and SecondsFromTime(adjStartTime) >= -60 then 1 else 0; # get indicator values #def macdValue = MACD().Value; #def macdAvg = MACD().Avg; # if you want macdValue and macdAvg, replace the name= line in the forula with # name="SOHLCP|"+GetSymbol()+"|"+open[-1]+"|"+high[-1]+"|"+low[-1]+"|"+close[-1]+"|"+close+"|"+volume[-1]+"|"+macdValue+"|"+macdAvg); # but you also need to keep the PowerShell script in sync to parse the line properly AddOrder(OrderType.BUY_TO_OPEN, marketOpen, low, 1, Color.White, Color.White, name="SOHLCP|"+GetSymbol()+"|"+open[-1]+"|"+high[-1]+"|"+low[-1]+"|"+close[-1]+"|"+close+"|"+volume[-1]); AddOrder(OrderType.SELL_TO_CLOSE, marketOpen, high, 1, Color.White, Color.White, name="SellClose");
PowerShell code for Get-SOHLCP.ps1:
Code:# # Get-SOHLCP.ps1 # # Script to convert a TOS ThinkOrSwim kg_EveryTickSOHLCP strategy report csv file to an object and/or proper csv data file. # # Author: Kory Gill, @korygill # Version: 20200304.2300 # # Examples # $x = gci 'StrategyReport*' | Select -ExpandProperty FullName | D:\Source\Repos\technical-analysis-dev\dev\Get-SOHLCP.ps1 -InformationAction Continue -ExportAsObject # $x = gci 'D:\Database\MarketData\TOS-StrategyReport-Files-SOHLCP\feb-3to7\StrategyReport*' | Select -ExpandProperty FullName | D:\Source\Repos\technical-analysis-dev\dev\Get-SOHLCP.ps1 -InformationAction Continue # $x = gci 'D:\Database\MarketData\TOS-StrategyReport-Files-SOHLCP\feb2020\StrategyReport*' | Select -ExpandProperty FullName | D:\Source\Repos\technical-analysis-dev\dev\Get-SOHLCP.ps1 -InformationAction Continue # $x = gci 'D:\Database\MarketData\TOS-StrategyReport-Files-SOHLCP\UseThinkScriptDemo\StrategyReport*' | Select -ExpandProperty FullName | D:\Source\Repos\technical-analysis-dev\dev\Get-SOHLCP.ps1 -InformationAction Continue # # Get the symbol back: # $m = 'SOHLCP-(~ES.XCME)(1.21.20 5.00 AM - 1.27.20 1.14 PM).csv' | Select-String -Pattern '\((.*?)\)' -AllMatches; $m.Matches[0].Groups[1].Value -replace '~', '/' # # $f = gci D:\temp\TOS-StrategyReport-Files-SOHLCP\sohlcp*.csv | Select -ExpandProperty FullName; $f | % {$m = $_ | Select-String -Pattern '\((.*?)\)' -AllMatches; $s = $m.Matches[0].Groups[1].Value -replace '~', '';$sym = ($s -split '\.' | Select -First 1); $file = $_; D:\Source\Repos\technical-analysis-dev\dev\Get-AllOrbTrades-SOHLCP.ps1 -FileName $file -SymbolName $sym} # gci *glArray.csv | % {$csv = Import-Csv -Path $_; $csv | ? {[DateTime]::Parse($_.Datetime).Month -eq 1} | Export-Csv -NoTypeInformation -Path All_glArray_Data.csv -Append} # get all January (month 1) # gci D:\Database\MarketData\TOS-StrategyReport-Files-SOHLCP\feb-3to7\*glArray.csv | Select -ExpandProperty FullName | % {$csv = Import-Csv -Path $_; $csv | ? {[DateTime]::Parse($_.Datetime).Month -eq 1} | Export-Csv -NoTypeInformation -Path D:\Database\MarketData\TOS-StrategyReport-Files-SOHLCP\feb-3to7\All_glArray_Data.csv -Append} # [CmdletBinding()] param ( [Parameter(Mandatory=$true, ValueFromPipeline=$true)] [string[]] $File, [switch] $ExportAsObject ) Begin { function Convert-CurrencyStringToDecimal ([string]$input) { ((($input -replace '\$') -replace '[)]') -replace '\(', '-') -replace '[^-0-9.]' } $global:sohlcpAllData = New-Object System.Collections.Generic.List[PSCustomObject] } Process { foreach ($f in $File) { if (-not (Test-Path $f)) { throw "Cannot open file '$f'." } Write-Information "Processing file: '$f'." # read csv file $content = Get-Content -Path $f # generate filename $csvSymbol = ($content[1] -split 'Symbol: ')[1] -replace '/', '~' -replace ':', '.' $csvWorkTime = ($content[2] -split 'Work Time: ')[1] -replace '/', '.' -replace ':', '.' $outFile = 'SOHLCP-(' + $csvSymbol +')('+ $csvWorkTime + ')' # find the lines that contain price information $csvdata = $content | ? {$_ -match ";.*;"} | ConvertFrom-Csv -Delimiter ';' # filter just the lines with (OHLC on them and make into CSV structure $data = $csvData | ? {$_ -match "\(SOHLCP"} $sohlcpFileData = New-Object System.Collections.Generic.List[PSCustomObject] foreach ($item in $data) { # capture the OHLC data $null = $item.Strategy -match "\(SOHLCP\|(.*)\)" $v = $Matches[1] -split '\|' $symbol = $v[0] $open = $v[1] | Convert-CurrencyStringToDecimal $high = $v[2] | Convert-CurrencyStringToDecimal $low = $v[3] | Convert-CurrencyStringToDecimal $close = $v[4] | Convert-CurrencyStringToDecimal $prevClose = $v[5] | Convert-CurrencyStringToDecimal $volume = $v[6] | Convert-CurrencyStringToDecimal # # Depending on how you gather data in your TOS script determines how you extract the values all separated by the | vertical bar symbol. # <# $sohlcpData = [PSCustomObject]@{ 'Symbol' = $symbol 'DateTime' = ([datetime]::Parse($item.'Date/Time')) 'Open' = [decimal]$open 'High' = [decimal]$high 'Low' = [decimal]$low 'Close' = [decimal]$close 'PrevClose' = [decimal]$prevClose 'Volume' = [decimal]$volume 'macdValue' = [decimal]$macdValue 'macdAvg' = [decimal]$macdAvg } #> $sohlcpData = [PSCustomObject]@{ 'Symbol' = $symbol 'DateTime' = ([datetime]::Parse($item.'Date/Time')) 'Open' = [decimal]$open 'High' = [decimal]$high 'Low' = [decimal]$low 'Close' = [decimal]$close 'PrevClose' = [decimal]$prevClose 'Volume' = [decimal]$volume } # add to our $sohlcpData array $null = $sohlcpFileData.Add($sohlcpData) $null = $sohlcpAllData.Add($sohlcpData) } # save to file $sohlcpFileData | Export-Csv -Path (Join-Path (Split-Path -Path $f -Parent) ($outFile + '.csv')) -Force -NoTypeInformation -Encoding ASCII } } End { if ($ExportAsObject) { # helpful message to show caller our output variable Write-Information "Out Data $($sohlcpAllData.Count) items (exported as `$sohlcpAllData)" } else { # don't show any extraneous output, and just return the data to the pipeline return $sohlcpAllData } }
Mr. Gill, I have successfully used the above script for historical data download on stocks - very helpful, thanks a lot! However, for mutual funds, this script is not plotting data on chart for further export. How do go I about modifying this script to work with Mutual funds? Thanks in advance for help!Your code in that rar file worked fine.
See also this post #20 for how to use it.
https://usethinkscript.com/threads/...nkorswim-for-external-analysis.507/post-14606
Run from directory the script and csv file are both in....
See the output:
.\Get-SOHLCP.ps1 -File .\StrategyReports_SPYV_2016.csv
Put output in a variable:
$data = .\Get-SOHLCP.ps1 -File .\StrategyReports_SPYV_2016.csv
Save to csv:
$data | ConvertTo-Csv -NoTypeInformation | Out-File -FilePath .\SPYV-Data.csv
kevin_Boston
New member
hi, I'm just tryin to dabble with whats discussed here..were you able to download OHLC along with indicators data? Apprecaite the response.This is cool.. i am trying to extract data from my chart with indicators.
Currentl, I get the values of different indicators from the databox and manually enter them into excel, but i would like to get those values along with OHLC into an Excel or CSV.
for example, i have BollingerBands, ExpMovingAverages, AverageVolume and PivotPoints. Can we tweak this code to extract these other values?
Thanks for your help
=
Hello everybody,
I m new here and first of all I want to thank u all involved on creating this great methode to export data from ToS. Especially big big Thank u to Kory Gill !
I have already tried the data export and everything worked perfectly.
In the next step I tried to add PointOfControl Data of VolumeProfile (ToS Study), but unfortually without success. I get always N/A displayed, although the drawing is working pretty well.
(code saved as Strategy)
I hope so much that some of u can help me in this case or give me a hint, workaround ... to get this data.
Many thanks in advance for ideas or suggestions.
############
Here the result that is display
View attachment 14174
New to investing: 1 year[/CODE]Code:Here the code i wrote (mainly copied from ToS and added Korys Code and saved as Strategy) [CODE]#------------------- input pricePerRowHeightMode = {default TICKSIZE, AUTOMATIC, CUSTOM}; input customRowHeight = 1.0; input timePerProfile = {default "OPT EXP", CHART, MINUTE, HOUR, DAY, WEEK, MONTH, BAR}; input multiplier = 1; input onExpansion = no; input profiles = 1000; input valueAreaPercent = 70; input opacity = 20; input Decimalstellen = 2; def period; def yyyymmdd = GetYYYYMMDD(); def seconds = SecondsFromTime(0); def month = GetYear() * 12 + GetMonth(); def day_number = DaysFromDate(First(yyyymmdd)) + GetDayOfWeek(First(yyyymmdd)); def dom = GetDayOfMonth(yyyymmdd); def dow = GetDayOfWeek(yyyymmdd - dom + 1); def expthismonth = (if dow > 5 then 27 else 20) - dow; def exp_opt = month + (dom > expthismonth); switch (timePerProfile) { case CHART: period = 0; case MINUTE: period = Floor(seconds / 60 + day_number * 24 * 60); case HOUR: period = Floor(seconds / 3600 + day_number * 24); case DAY: period = CountTradingDays(Min(First(yyyymmdd), yyyymmdd), yyyymmdd) - 1; case WEEK: period = Floor(day_number / 7); case MONTH: period = Floor(month - First(month)); case "OPT EXP": period = exp_opt - First(exp_opt); case BAR: period = BarNumber() - 1; } def count = CompoundValue(1, if period != getValue(period,1) then (getValue(count,1) + period - getValue(period,1)) % multiplier else getValue(count,1), 0); def cond = count < getValue(count,1) + period - getValue(period,1); def height; switch (pricePerRowHeightMode) { case AUTOMATIC: height = PricePerRow.AUTOMATIC; case TICKSIZE: height = PricePerRow.TICKSIZE; case CUSTOM: height = customRowHeight; } profile vol = VolumeProfile("startNewProfile" = cond, "onExpansion" = onExpansion, "numberOfProfiles" = profiles, "pricePerRow" = height, "value area percent" = valueAreaPercent); def con = CompoundValue(1, onExpansion, no); def pc = if IsNaN(vol.GetPointOfControl()) and con then getValue(pc,1) else vol.GetPointOfControl(); def hVA = if IsNaN(vol.GetHighestValueArea()) and con then getValue(hVA,1) else vol.GetHighestValueArea(); def lVA = if IsNaN(vol.GetLowestValueArea()) and con then getValue(lVA,1) else vol.GetLowestValueArea(); def hProfile = if IsNaN(vol.GetHighest()) and con then getValue(hProfile,1) else vol.GetHighest(); def lProfile = if IsNaN(vol.GetLowest()) and con then getValue(lProfile, 1) else vol.GetLowest(); def plotsDomain = (IsNaN(close) == onExpansion); def ProfileStart = if barNumber()==1 then 1 else if pc <> getValue(pc,1) then 1 else 0; #------------------- #POC Draw #------------------- input Show_Profile = {default "None", "All", "POC", "Profile", "Profile with POC", "Profile with POC & Value", "Profile with ProfileHighLow, POC", "ProfileHighLow", "ProfileHighLow with POC", "ValueArea", "ValueArea with POC"}; def ShowProfile = ((Show_Profile == Show_Profile."Profile" or Show_Profile == Show_Profile."Profile with POC" or Show_Profile == Show_Profile."Profile with POC & Value" or Show_Profile == Show_Profile."Profile with ProfileHighLow, POC" or Show_Profile == Show_Profile."All") and Show_Profile <> Show_Profile."None"); def ShowPOC = ((Show_Profile == Show_Profile."POC" or Show_Profile == Show_Profile."Profile with POC" or Show_Profile == Show_Profile."Profile with POC & Value" or Show_Profile == Show_Profile."Profile with ProfileHighLow, POC or Show_Profile == Show_Profile."ProfileHighLow with POC" or Show_Profile == Show_Profile."ValueArea with POC" or Show_Profile == Show_Profile."All") and Show_Profile <> Show_Profile."None"); def ShowValueArea = ((Show_Profile == Show_Profile."ValueArea" or Show_Profile == Show_Profile."ValueArea with POC" or Show_Profile == Show_Profile."All") and Show_Profile <> Show_Profile."None"); def ShowProfileHighLow = ((Show_Profile == Show_Profile."ProfileHighLow" or Show_Profile == Show_Profile."ProfileHighLow with POC" or Show_Profile == Show_Profile."Profile with ProfileHighLow, POC" or Show_Profile == Show_Profile."All") and Show_Profile <> Show_Profile."None"); DefineGlobalColor("Profile", Color.CYAN); DefineGlobalColor("Point Of Control", GetColor(5)); DefineGlobalColor("Value Area", GetColor(8)); vol.Show(if Show_Profile then GlobalColor("Profile") else Color.CURRENT, if ShowPOC then GlobalColor("Point Of Control") else Color.CURRENT, if ShowValueArea then GlobalColor("Value Area") else Color.CURRENT, opacity); plot POC = if plotsDomain and ShowPOC then pc else Double.NaN; POC.SetPaintingStrategy(PaintingStrategy.HORIZONTAL); plot ProfileHigh = if plotsDomain and ShowProfileHighLow then hProfile else Double.NaN; ProfileHigh.SetPaintingStrategy(PaintingStrategy.HORIZONTAL); plot ProfileLow = if plotsDomain and ShowProfileHighLow then lProfile else Double.NaN; ProfileLow.SetPaintingStrategy(PaintingStrategy.HORIZONTAL); addChartBubble(profileStart and Show_Profile == Show_Profile."Profile with POC & Value", pc, pc, color.white, no); ################################################################### declare upper; declare once_per_bar; input startTime = 820; #hint startTime: start time in EST 24-hour time input endTime = 1600; #hint endTime: end time in EST 24-hour time def adjStartTime = startTime;# - 1; def adjEndTime = endTime;# - 1; def agg = GetAggregationPeriod(); # we use a 1 bar offset to get orders to line up, so adjust for that here def marketOpen = if agg >= AggregationPeriod.DAY then 1 else if SecondsTillTime(adjEndTime) >= 60 and SecondsFromTime(adjStartTime) >= -60 then 1 else 0; AddOrder(OrderType.BUY_TO_OPEN, marketOpen, low, 1, Color.Black, Color.Black, name="Symbol_POC|"+GetSymbol()+"|" + pc[-1]); # <<< here i put pc (Point Of Control) as data to be displayed but i get only N/A AddOrder(OrderType.SELL_TO_CLOSE, marketOpen, high, 1, Color.Black, Color.Black, name="SellClose");
were you ever able to get the N/A resolved for custom indicator values? I'm just couple years behind on this...
")
kevin_Boston
New member
are any any TOS API's that can call the strategy and download the files to cloud?There is no automatic exporting feature in TOS.
are any any TOS API's that can call the strategy and download the files to cloud?
Sadly no. The useThinkScript forum does not have any ToS APIs.
Nor supports the creation of them.
Use function "volume[-1]" or "volume[0]". Just play with the index number 0, -1, 1, to get to the right timeHow do you add volume to the code?
Hey Kori or anyone, as of March 1, when I open the ThinkOrSwim Desktop app, using Kory's script as usual to export into CSV file and then parse it. However, this time I consistently run into an issue of the Date format. The parsing script " $data | ConvertTo-Csv -NoTypeInformation | Out-File -FilePath D:\ThinkSwim\***.csv" consistenly error out with a message:
"Exception calling "Parse" with "1" argument(s): "The string was not recognized as a valid DateTime. There is an unknown word starting at index 13."
At D:\ThinkSwim\Get-SOHLCP.ps1:56 char:9
- $null = $sohlcpData.Add(
- ~~~~~~~~~~~~~~~~~~~~~~~~
) [], MethodInvocationException+ FullyQualifiedErrorId : FormatException "
After some diagnosis, I found that there is likely a HIDDEN character somewhere in the exported CSV that the parsing script could not handle. Example below:
Id;Strategy;Side;Amount;Price;Date/Time;Trade P/L;P/L;Position;
1;ExportSPX(SellClose);Sell to Close;-1.0;$23.98;1/31/25, 10:00 AM;$0.18;$0.26;-1.0;
2;ExportSPX(SOHLCP|LI|23.84|23.84|23.58|23.72|23.84|272,096);Buy to Open;1.0;$23.80;1/31/25, 10:00 AM;;$0.18;0.0;
In line"2;", the timestamp "10:00 AM" likely has a character hidden in the space between the last "0" and the 1st letter "A". In other words, something "X" is hidden here "1/31/25, 10:00XAM".
If I remove the space and re-insert the keyboard space there, then the parsing script would run successfully. I have restarted my PC, restarted TOS Desktop app, Remove the Study and Re-include the Study into TOS, and still the same issue and observation.
I mean, I have been running this for over 2 years and absolutely no issue. Just starting to happen today. Anyone has any thoughts?
Thanks
Sean
truthntrading
New member
Hey Mii were you able to resolve this? I'm getting Parse errors on line 13 myself. same error.I am getting many parse errors. anyone has the latest scripts?
Exception calling "Parse" with "1" argument(s): "The string was not recognized as a valid DateTime. There is an
unknown word starting at index 14."
Thanks for letting me know!
no, its not working.Hey Mii were you able to resolve this? I'm getting Parse errors on line 13 myself. same error.
Thanks for letting me know!
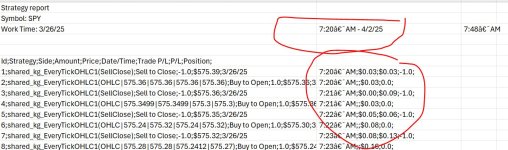
For those wondering about options data, the sheet contains an export file of SPY straddle. I would prefer bid or ask data for SPY options, but I had issues using a combined ticker in the chart pane that included bid or ask. To get the options data export, just type the options ticker in the chart as the main instrument and export. I also found you don’t need the orders shown on screen to export, which is nice.
The instructions are:
Open Excel file click import and format data
Choose the file, and it will make a new sheet
Done
Enjoy!!
Attachments
Can see this when looking at the strategy report csv file in Notepad and/or Visual Studio Code and the debugger.
Fix seems as easy as removing these unicode characters.
        # Remove non-ASCII characters (e.g., hidden Unicode spaces)
        $cleanDateTime = [System.Text.RegularExpressions.Regex]::Replace($item.'Date/Time', '[^\x00-\x7F]', ' ').Trim()

        # add to our $outData array
        $null = $outData.Add(
            [PSCustomObject]@{
                'DateTime' = ([datetime]::Parse($cleanDateTime))
                'Open' = [decimal]$open
                'High' = [decimal]$high
                'Low' = [decimal]$low
                'Close' = [decimal]$close
                }
            )
@sftong @mii @truthntrading
Hi,Hey Mii were you able to resolve this? I'm getting Parse errors on line 13 myself. same error.
Thanks for letting me know!
Below script is working and creating csv file as well.
#
# Get-SOHLCP.ps1
#
# Script to convert a TOS ThinkOrSwim kg_EveryTickSOHLCP strategy report csv file to an object and/or proper csv data file.
#
# Author: Kory Gill, @korygill
# Version: 20200304.2300
#
# Examples
# $x = gci 'D:\Database\MarketData\TOS-StrategyReport-Files-SOHLCP\UseThinkScriptDemo\StrategyReport*' | Select -ExpandProperty FullName | D:\Source\Repos\technical-analysis-dev\dev\Get-SOHLCP.ps1 -InformationAction Continue
#
# Get the symbol back:
# $m = 'SOHLCP-(~ES.XCME)(1.21.20 5.00 AM - 1.27.20 1.14 PM).csv' | Select-String -Pattern '\((.*?)\)' -AllMatches; $m.Matches[0].Groups[1].Value -replace '~', '/'
#
[CmdletBinding()]
param (
[Parameter(Mandatory=$true, ValueFromPipeline=$true)]
[string[]]
$File,

[switch]
$ExportAsObject
)

Begin {
function Convert-CurrencyStringToDecimal ([string]$input)
{
((($input -replace '\$') -replace '[)]') -replace '\(', '-') -replace '[^-0-9.]'
}

$global:sohlcpAllData = New-Object System.Collections.Generic.List[PSCustomObject]
}

Process {
foreach ($f in $File)
{
if (-not (Test-Path $f))
{
throw "Cannot open file '$f'."
}

Write-Information "Processing file: '$f'."

# read csv file
$content = Get-Content -Path $f

# generate filename
$csvSymbol = ($content[1] -split 'Symbol: ')[1] -replace '/', '~' -replace ':', '.'
$csvWorkTime = ($content[2] -split 'Work Time: ')[1] -replace '/', '.' -replace ':', '.'
$outFile = 'SOHLCP-(' + $csvSymbol +')('+ $csvWorkTime + ')'

# find the lines that contain price information
$csvdata = $content | ? {$_ -match ";.*;"} | ConvertFrom-Csv -Delimiter ';'

# filter just the lines with (OHLC on them and make into CSV structure
$data = $csvData | ? {$_ -match "\(SOHLCP"}

$sohlcpFileData = New-Object System.Collections.Generic.List[PSCustomObject]

foreach ($item in $data)
{
# capture the OHLC data
$null = $item.Strategy -match "\(SOHLCP\|(.*)\)"
$v = $Matches[1] -split '\|'

$symbol = $v[0]
$open = $v[1] | Convert-CurrencyStringToDecimal
$high = $v[2] | Convert-CurrencyStringToDecimal
$low = $v[3] | Convert-CurrencyStringToDecimal
$close = $v[4] | Convert-CurrencyStringToDecimal
$prevClose = $v[5] | Convert-CurrencyStringToDecimal
$macdValue = $v[6] | Convert-CurrencyStringToDecimal
$macdAvg = $v[7] | Convert-CurrencyStringToDecimal


# add to our $outData array
$cleanDateTime = [System.Text.RegularExpressions.Regex]::Replace($item.'Date/Time', '[^\x00-\x7F]', ' ').Trim()
$sohlcpData = [PSCustomObject]@{
'Symbol' = $symbol

'DateTime' = ([datetime]::parse($cleanDateTime))
'Open' = [decimal]$open
'High' = [decimal]$high
'Low' = [decimal]$low
'Close' = [decimal]$close
'PrevClose' = [decimal]$prevClose
'macdValue' = [decimal]$macdValue
'macdAvg' = [decimal]$macdAvg
}

# add to our $sohlcpData array
$null = $sohlcpFileData.Add($sohlcpData)
$null = $sohlcpAllData.Add($sohlcpData)
}

# save to file
$sohlcpFileData | Export-Csv -Path (Join-Path (Split-Path -Path $f -Parent) ($outFile + '.csv')) -Force -NoTypeInformation -Encoding ASCII
}
}

End {
if ($ExportAsObject)
{
# helpful message to show caller our output variable
Write-Information "Out Data $($sohlcpAllData.Count) items (exported as `$sohlcpAllData)"
}
else
{
# don't show any extraneous output, and just return the data to the pipeline
return $sohlcpAllData
}
}bokelly007
New member
I love this, but I have a few questions. I'm quite new. I was able to run the strategy and the download the .csv file. I had to clean up the file a bit. It's attached. Should I delete the column headers?UPDATE: 1/22/2020, a newer version of this post is on thread #20.
https://usethinkscript.com/threads/...nkorswim-for-external-analysis.507/post-14606
I do a lot of back testing with PowerShell. I am learning Python, and will move to that in the future. This article demonstrates how to export historical data from thinkorswim to a csv file, and then convert that output file to something that is a truly valid csv file which can be imported by PowerShell or any other program.
Overview of export process
This requires a few steps, and once you have done this once, subsequent exports will come naturally.
() Add a strategy to a chart that simulates a trade on every bar (1 buy to open, 1 sell to close).
This strategy will put Open, High, Low, Close (OHLC) data in the Name of the buy order. We will ignore the sell orders.
() Use the Show Report context menu to save the trades to a csv file.
The output file has extra information in it and it not a truly valid csv file.
() Run a PowerShell script I created called Get-OHLC.ps1 which transforms the csv file into a proper object which can be saved, or used in further analysis.
Export the strategy report
Open this chart in thinkorswim, it has the strategy code in it.
https://tos.mx/TM4exi
View attachment 5212
Every bar will have a buy and close. Right click one of the signals and export from Show Report menu item.
The strategy takes parameters for start/end times in the EST time zone.
Code for the kg_EveryTickOHLC strategy
Code:declare upper; declare once_per_bar; input startTime = 820; #hint startTime: start time in EST 24-hour time input endTime = 1600; #hint endTime: end time in EST 24-hour time def adjStartTime = startTime; def adjEndTime = endTime; # we use a 1 bar offset to get orders to line up, so adjust for that here def marketOpen = if SecondsTillTime(adjEndTime) >= 60 and SecondsFromTime(adjStartTime) >= -60 then 1 else 0; AddOrder(OrderType.BUY_TO_OPEN, marketOpen, low, 1, Color.White, Color.White, name="OHLC|"+open[-1]+"|"+high[-1]+"|"+low[-1]+"|"+close[-1]); AddOrder(OrderType.SELL_TO_CLOSE, marketOpen, high, 1, Color.White, Color.White, name="SellClose");
Transform the thinkorswim csv file to data you can work with
Use this PowerShell script, Get-OHLC.ps1, to transform the exported file.
Save the code below as “Get-OHLC.ps1” and run similar to the steps shown below.
Code:[CmdletBinding()] param ( [string[]] $File, [switch] $ExportAsObject ) function Convert-CurrencyStringToDecimal ([string]$input) { ((($input -replace '\$') -replace '[)]') -replace '\(', '-') -replace '[^-0-9.]' } $global:outData = [System.Collections.ArrayList]::new() foreach ($f in $File) { if (-not (Test-Path $f)) { throw "Cannot open file '$f'." } # read csv file $content = Get-Content -Path $f # find the lines that contain price information $csvdata = $content | ? {$_ -match ";.*;"} | ConvertFrom-Csv -Delimiter ';' # filter just the lines with (OHLC on them and make into CSV structure $data = $csvData | ? {$_ -match "\(OHLC"} foreach ($item in $data) { # capture the OHLC data $null = $item.Strategy -match "\(OHLC\|(.*)\)" $v = $Matches[1] -split '\|' $open = $v[0] | Convert-CurrencyStringToDecimal $high = $v[1] | Convert-CurrencyStringToDecimal $low = $v[2] | Convert-CurrencyStringToDecimal $close = $v[3] | Convert-CurrencyStringToDecimal # add to our $outData array $null = $outData.Add( [PSCustomObject]@{ 'DateTime' = ([datetime]::Parse($item.'Date/Time')) 'Open' = [decimal]$open 'High' = [decimal]$high 'Low' = [decimal]$low 'Close' = [decimal]$close } ) } } if ($ExportAsObject) { # helpful message to show caller our output variable Write-Output "Out Data $($outData.Count) items (exported as `$outData)" } else { # don't show any output, and just return the data to the pipeline return $outData }
From a PowerShell command window, run the script and pass your exported csv file as a parameter.
Examples:
D:\tos-data> $data = .\Get-OHLC.ps1 .\StrategyReports_ESXCME_81919.csv
D:\tos-data> $data = D:\tos-data\Get-OHLC.ps1 D:\tos-data\StrategyReports_ESXCME_81919.csv
The converted data is now an object:
D:\tos-data> $data[0..5] | ft
DateTime Open High Low Close
-------- ---- ---- --- -----
8/13/2019 5:20:00 AM 2874.75 2874.75 2873 2873.5
8/13/2019 5:21:00 AM 2873.25 2873.5 2872.75 2873.5
8/13/2019 5:22:00 AM 2873.25 2874 2873.25 2874
8/13/2019 5:23:00 AM 2874 2874 2872.5 2872.5
8/13/2019 5:24:00 AM 2872.75 2874 2872.75 2874
8/13/2019 5:25:00 AM 2874.25 2875 2873.75 2874.25
Save the $data object as a proper csv file:
$data | ConvertTo-Csv -NoTypeInformation | Out-File -FilePath d:\tos-data\ES-Data.csv
View attachment 5214
Start back testing!
Now that you have data, you can back test your strategies with code outside thinkorswim. Note, you can only export up to 30 days of 1-minute data. You can use OnDemand to load data beyond that, but for this amount of work, maybe getting data from a provider is a better route. Kibot, http://www.kibot.com/, is a good source, and you can find others on the web. Lastly, if you only export the subset of data you need, you can save a lot of time running the strategy in thinkorswim.
Happy trading,
Kory Gill, @korygill
I saved the .csv and the powershell script to my desktop but I'm not getting any object as an output. Care to trouble shoot? The file Im using is a .csv but the file attached here is a .xlsx so that I can post it here.
Hi! Thanks for putting this out there!! I am trying to get it to work, but I can't seem to get the object to produce from the Powershell script. I have two questions.UPDATED workflow as of 1/22/2020
I do a lot of back testing with PowerShell. This article demonstrates how to export historical data from thinkorswim to a csv file, and then convert that output file to something that is a truly valid csv file which can be imported by PowerShell or any other program.
Overview of export process
This requires a few steps, and once you have done this once, subsequent exports will come naturally.
() Add a strategy to a chart that simulates a trade on every bar (1 buy to open, 1 sell to close).
This strategy will put Symbol, Open, High, Low, Close, PreviousClose (SOHLCP) data in the Name of the buy order. We will ignore the sell orders.
() Use the Show Report context menu to save the trades to a csv file.
The output file has extra information in it and it not a truly valid csv file.
() Run a PowerShell script I created called Get-SOHLCP.ps1 which transforms the csv file into a proper object which can be saved, or used in further analysis.
Export the strategy report
Open this chart in thinkorswim, it has the strategy code in it.
From your main TOS window, use Setup | Open Shared Item and paste this link in:
https://tos.mx/1FmyWu4
View attachment 6555
Every bar will have a buy and close. Right click one of the signals and export from Show Report menu item.
The strategy takes parameters for start/end times in the EST time zone.
Code for the kg_EveryTickSOHLCP strategy
Code:# # kg_EveryTickSOHLCP # # Strategy to capture every bar OHLC and P, the previous close. # Useful for exporting data from TOS into a CSV file for further processing. # # Author: Kory Gill, @korygill # declare upper; declare once_per_bar; input startTime = 820; #hint startTime: start time in EST 24-hour time input endTime = 1600; #hint endTime: end time in EST 24-hour time def adjStartTime = startTime;# - 1; def adjEndTime = endTime;# - 1; def agg = GetAggregationPeriod(); # we use a 1 bar offset to get orders to line up, so adjust for that here def marketOpen = if agg >= AggregationPeriod.DAY then 1 else if SecondsTillTime(adjEndTime) >= 60 and SecondsFromTime(adjStartTime) >= -60 then 1 else 0; AddOrder(OrderType.BUY_TO_OPEN, marketOpen, low, 1, Color.White, Color.White, name="SOHLCP|"+GetSymbol()+"|"+open[-1]+"|"+high[-1]+"|"+low[-1]+"|"+close[-1]+"|"+close); AddOrder(OrderType.SELL_TO_CLOSE, marketOpen, high, 1, Color.White, Color.White, name="SellClose");
Transform the thinkorswim csv file to data you can work with
Use this PowerShell script, Get-SOHLCP.ps1, to transform the exported file.
Save the code below as “Get-SOHLCP.ps1” and run similar to the steps shown below.
Code:# # Get-SOHLCP.ps1 # # Script to convert a TOS ThinkOrSwim kg_EveryTickOHLCP strategy report csv file to an object and/or proper csv data file. # # Author: Kory Gill, @korygill # [CmdletBinding()] param ( [string[]] $File, [switch] $ExportAsObject ) function Convert-CurrencyStringToDecimal ([string]$input) { ((($input -replace '\$') -replace '[)]') -replace '\(', '-') -replace '[^-0-9.]' } $global:sohlcpData = New-Object System.Collections.Generic.List[PSCustomObject] foreach ($f in $File) { if (-not (Test-Path $f)) { throw "Cannot open file '$f'." } # read csv file $content = Get-Content -Path $f # find the lines that contain price information $csvdata = $content | ? {$_ -match ";.*;"} | ConvertFrom-Csv -Delimiter ';' # filter just the lines with (OHLC on them and make into CSV structure $data = $csvData | ? {$_ -match "\(SOHLCP"} foreach ($item in $data) { # capture the OHLC data $null = $item.Strategy -match "\(SOHLCP\|(.*)\)" $v = $Matches[1] -split '\|' $symbol = $v[0] $open = $v[1] | Convert-CurrencyStringToDecimal $high = $v[2] | Convert-CurrencyStringToDecimal $low = $v[3] | Convert-CurrencyStringToDecimal $close = $v[4] | Convert-CurrencyStringToDecimal $prevClose = $v[5] | Convert-CurrencyStringToDecimal # add to our $sohlcpData array $null = $sohlcpData.Add( [PSCustomObject]@{ 'Symbol' = $symbol 'DateTime' = ([datetime]::Parse($item.'Date/Time')) 'Open' = [decimal]$open 'High' = [decimal]$high 'Low' = [decimal]$low 'Close' = [decimal]$close 'PrevClose' = [decimal]$prevClose } ) } } if ($ExportAsObject) { # helpful message to show caller our output variable Write-Output "Out Data $($sohlcpData.Count) items (exported as `$sohlcpData)" } else { # don't show any output, and just return the data to the pipeline return $sohlcpData }
From a PowerShell command window, run the script and pass your exported csv file as a parameter.
Examples:
$data = .\Get-OHLC.ps1 .\StrategyReports_ESXCME_81919.csv
$data = D:\tos-data\Get-OHLC.ps1 D:\tos-data\StrategyReports_ESXCME_81919.csv
The converted data is now an object:
$data | ft
Code:Symbol DateTime Open High Low Close PrevClose ------ -------- ---- ---- --- ----- --------- /ES:XCME 1/17/2020 12:00:00 AM 3316.75 3330.25 3316 3323.75 3317.25 /ES:XCME 1/21/2020 12:00:00 AM 3325 3329.75 3307.25 3320.25 3323.75 /ES:XCME 1/22/2020 12:00:00 AM 3321.25 3337.5 3315.25 3317.25 3320.25
or
$data | ft
Code:Symbol DateTime Open High Low Close PrevClose ------ -------- ---- ---- --- ----- --------- /ES:XCME 1/17/2020 6:30:00 AM 3325.25 3326 3323.75 3324.5 3325.5 /ES:XCME 1/17/2020 6:31:00 AM 3324.25 3324.5 3322.25 3322.25 3324.5 /ES:XCME 1/17/2020 6:32:00 AM 3322.25 3322.75 3320.75 3321.75 3322.25 /ES:XCME 1/17/2020 6:33:00 AM 3321.75 3322.5 3321 3322.25 3321.75 /ES:XCME 1/17/2020 6:34:00 AM 3322.25 3322.5 3321.5 3322 3322.25 /ES:XCME 1/17/2020 6:35:00 AM 3322.25 3323.5 3321.75 3323 3322 /ES:XCME 1/20/2020 6:30:00 AM 3321 3321.25 3320.5 3320.5 3320.75 /ES:XCME 1/20/2020 6:31:00 AM 3320.75 3320.75 3320.25 3320.5 3320.5 /ES:XCME 1/20/2020 6:32:00 AM 3320.5 3321.75 3320.5 3321.75 3320.5 /ES:XCME 1/20/2020 6:33:00 AM 3321.5 3321.75 3321 3321.25 3321.75 /ES:XCME 1/20/2020 6:34:00 AM 3321.25 3321.75 3321 3321.5 3321.25 /ES:XCME 1/20/2020 6:35:00 AM 3321.5 3321.75 3321.25 3321.75 3321.5
Save the $data object as a proper csv file:
$data | ConvertTo-Csv -NoTypeInformation | Out-File -FilePath d:\tos-data\ES-Data.csv
View attachment 6556
Start back testing!
Now that you have data, you can back test your strategies with code outside thinkorswim. Note, you can only export up to 30 days of 1-minute data. You can use OnDemand to load data beyond that, but for this amount of work, maybe getting data from a provider is a better route. Kibot, http://www.kibot.com/, is a good source, and you can find others on the web. Lastly, if you only export the subset of data you need, you can save a lot of time running the strategy in thinkorswim.
Happy trading,
Kory Gill, @korygill
1. My .csv that I just exported on 4.2.2025 has all of these extra columns in it. Is this normal? Screenshot attached.
2. In the Powershell command do we run Get-SOHLCP.ps1 or Get-OHLCP.ps1, up above you have it as both so I'm a little confused.
Attachments
Any data that shows up the the data box I would like to export. For example, the numerical values that show up in the data box for adx, rsi, BB, etc. Those are the values I would be interested in exporting to CSV.
Any idea if you can export data from studies using this method?
No, this thread is limited to strategies only.
You did not provide any information about what data, you want to export from your study.
When you know what you want to export, set up a filter for that data in the scan hacker.
And then simply export to excel.
Sadly no, there is no method to automate any updates.
Similar threads
-
-
Backtesting - Getting More Data.... More Quickly in ThinkOrSwim
- Started by whoDAT
- Replies: 0
-
-
Why You Shouldn't Try To Work With Options Data On Charts In ThinkOrSwim
- Started by StoneMan
- Replies: 2
-
Not the exact question you're looking for?
Start a new thread and receive assistance from our community.
Similar threads
-
-
Backtesting - Getting More Data.... More Quickly in ThinkOrSwim
- Started by whoDAT
- Replies: 0
-
-
Why You Shouldn't Try To Work With Options Data On Charts In ThinkOrSwim
- Started by StoneMan
- Replies: 2
-
Similar threads
-
-
Backtesting - Getting More Data.... More Quickly in ThinkOrSwim
- Started by whoDAT
- Replies: 0
-
-
Why You Shouldn't Try To Work With Options Data On Charts In ThinkOrSwim
- Started by StoneMan
- Replies: 2
-
The Market Trading Game Changer
- Exclusive indicators
- Proven strategies & setups
- Private Discord community
- ‘Buy The Dip’ signal alerts
- Exclusive members-only content
- Add-ons and resources
- 1 full year of unlimited support
Frequently Asked Questions
useThinkScript is the #1 community of stock market investors using indicators and other tools to power their trading strategies. Traders of all skill levels use our forums to learn about scripting and indicators, help each other, and discover new ways to gain an edge in the markets.
We get it. Our forum can be intimidating, if not overwhelming. With thousands of topics, tens of thousands of posts, our community has created an incredibly deep knowledge base for stock traders. No one can ever exhaust every resource provided on our site.
If you are new, or just looking for guidance, here are some helpful links to get you started.
- The most viewed thread:
https://usethinkscript.com/threads/repainting-trend-reversal-for-thinkorswim.183/ - Our most popular indicator:
https://usethinkscript.com/threads/buy-the-dip-indicator-for-thinkorswim.3553/ - Answers to frequently asked questions:
https://usethinkscript.com/threads/answers-to-commonly-asked-questions.6006/