profitmaya
Member
may I know what's the difference between AVAH, AVAL,APOC & UVAH, UVAL & UPOCHere is a Multi_Time_Frame version of the above script with optional bubbles added
[Edit to add showbubbles]
may I know what's the difference between AVAH, AVAL,APOC & UVAH, UVAL & UPOCHere is a Multi_Time_Frame version of the above script with optional bubbles added
[Edit to add showbubbles]
U...s are the profiles based upon buying only. The A....s are profiles based upon both buying and selling.may I know what's the difference between AVAH, AVAL,APOC & UVAH, UVAL & UPOC
View attachment 19829
https://usethinkscript.com/threads/...pocs-for-thinkorswim.8153/page-15#post-127414
I have created a scan for finding specific Volume Profile distribution shapes based on the location of the Point of Control. >.65 for P shape profiles and <.35 for b shaped profiles
I am trying to make a scan where the POC is in the middle of the distribution (middle of value area), this would identify B and D shaped profiles but i cannot fix this error, would really appreciate some help.
here is the code with the error
plot Data = close;
#VolumeProfile_PreviousDay_displayed_NextDau
#20190426 Sleepyz
def height = PricePerRow.Ticksize;
input timePerProfile = {CHART, MINUTE, HOUR, default DAY, WEEK, MONTH, "OPT EXP", BAR};
input multiplier = 1;
input profiles = 1000;
input valueAreaPercent = 70;
def period;
def yyyymmdd = GetYYYYMMDD();
def seconds = SecondsFromTime(0);
def month = GetYear() * 12 + GetMonth();
def day_number = DaysFromDate(First(yyyymmdd)) + GetDayOfWeek(First(yyyymmdd));
def dom = GetDayOfMonth(yyyymmdd);
def dow = GetDayOfWeek(yyyymmdd - dom + 1);
def expthismonth = (if dow > 5 then 27 else 20) - dow;
def exp_opt = month + (dom > expthismonth);
switch (timePerProfile) {
case CHART:
period = 0;
case MINUTE:
period = Floor(seconds / 60 + day_number * 24 * 60);
case HOUR:
period = Floor(seconds / 3600 + day_number * 24);
case DAY:
period = CountTradingDays(Min(First(yyyymmdd), yyyymmdd), yyyymmdd) - 1;
case WEEK:
period = Floor(day_number / 7);
case MONTH:
period = Floor(month - First(month));
case "OPT EXP":
period = exp_opt - First(exp_opt);
case BAR:
period = BarNumber() - 1;
}
def count = CompoundValue(1, if period != period[1] then (count[1] + period - period[1]) % multiplier else count[1], 0);
def cond = count < count[1] + period - period[1];
profile vol = VolumeProfile("startNewProfile" = cond, "numberOfProfiles" = profiles, "pricePerRow" = height, "value area percent" = valueAreaPercent, onExpansion = no);
#Prior Day High/Low ValueAreas
def HVA = if IsNaN(vol.GetHighestValueArea()) then HVA[1] else vol.GetHighestValueArea();
def pHVA = CompoundValue(1, if cond then HVA[1] else pHVA[1], Double.NaN);
def LVA = if IsNaN(vol.GetLowestValueArea()) then LVA[1] else vol.GetLowestValueArea();
def pLVA = CompoundValue(1, if cond then LVA[1] else pLVA[1], Double.NaN);
plot PrevHVA = if isnan(close) then double.nan else pHVA;
plot PrevLVA = if isnan(close) then double.nan else pLVA;
PrevHVA.SetDefaultColor(Color.YELLOW);
PrevLVA.SetDefaultColor(Color.YELLOW);
PrevHVA.SetPaintingStrategy(PaintingStrategy.HORIZONTAL);
PrevLVA.SetPaintingStrategy(PaintingStrategy.HORIZONTAL);
#Prior Day POC Calculated
def POC = if IsNaN(vol.GetPointOfControl()) and cond then POC[1] else vol.GetPointOfControl();
def pPOC = CompoundValue (1, if cond then POC[1] else pPOC[1], Double.NaN);
plot PrevPOC = pPOC;
PrevPOC.SetPaintingStrategy(PaintingStrategy.HORIZONTAL);
PrevPOC.SetDefaultColor(Color.MAGENTA);
plot scan= (PrevPOC - PrevLVA) / (PrevHVA -PrevLVA) = .50;
Looking for some Volume Profile scans and looked at this one but after changing the plot scan line you get:Change this line:
plot scan= (PrevPOC - PrevLVA) / (PrevHVA -PrevLVA) = .50;
to
plot scan= (PrevPOC - PrevLVA) / (PrevHVA -PrevLVA) == .50;
This has a begin timeframe, is it possible to add an end time to this?# Volume Profile for User Set Time # Mobius # Chat Room Discussion 03.26.2018 input pricePerRowHeightMode = {AUTOMATIC, TICKSIZE, default CUSTOM}; input customRowHeight = 1.0; input onExpansion = no; input profiles = 5; #Hint profiles: for just RTH 1 for GlobeX and RTH 2 input showPointOfControl = yes; input showValueArea = yes; input valueAreaPercent = 68; input opacity = 5; input Begin = 0930; def TS = TickSize(); def Active = SecondsTillTime(Begin) == 0; def cond = Active; def height; switch (pricePerRowHeightMode) { case AUTOMATIC: height = PricePerRow.AUTOMATIC; case TICKSIZE: height = PricePerRow.TICKSIZE; case CUSTOM: height = customRowHeight; } profile vol = VolumeProfile("startNewProfile" = cond, "onExpansion" = onExpansion, "numberOfProfiles" = profiles, "pricePerRow" = height, "value area percent" = valueAreaPercent); def con = CompoundValue(1, onExpansion, no); def pc = if IsNaN(vol.GetPointOfControl()) and con then pc[1] else vol.GetPointOfControl(); def hVA = if IsNaN(vol.GetHighestValueArea()) and con then hVA[1] else Round(vol.GetHighestValueArea(), 0); def lVA = if IsNaN(vol.GetLowestValueArea()) and con then lVA[1] else vol.GetLowestValueArea(); def hProfile = if IsNaN(vol.GetHighest()) and con then hProfile[1] else vol.GetHighest(); def lProfile = if IsNaN(vol.GetLowest()) and con then lProfile[1] else vol.GetLowest(); def plotsDomain = IsNaN(close) == onExpansion; plot POC = if plotsDomain then Round(pc / TS, 0) * TS else Double.NaN; plot ProfileHigh = if plotsDomain then Round(hProfile / TS, 0) * TS else Double.NaN; plot ProfileLow = if plotsDomain then Round(lProfile / TS, 0) * TS else Double.NaN; plot VAHigh = if plotsDomain then Round(hVA / TS, 0) * TS else Double.NaN; plot VALow = if plotsDomain then Round(lVA / TS, 0) * TS else Double.NaN; DefineGlobalColor("Profile", GetColor(1)); DefineGlobalColor("Point Of Control", GetColor(5)); DefineGlobalColor("Value Area", GetColor(8)); vol.Show(GlobalColor("Profile"), if showPointOfControl then GlobalColor("Point Of Control") else Color.CURRENT, if showValueArea then GlobalColor("Value Area") else Color.CURRENT, opacity); POC.SetDefaultColor(GlobalColor("Point Of Control")); POC.SetPaintingStrategy(PaintingStrategy.HORIZONTAL); VAHigh.SetPaintingStrategy(PaintingStrategy.HORIZONTAL); VAHigh.HideBubble(); VAHigh.HideTitle(); VALow.SetPaintingStrategy(PaintingStrategy.HORIZONTAL); VALow.HideBubble(); VALow.HideTitle(); VAHigh.SetDefaultColor(GlobalColor("Value Area")); VALow.SetDefaultColor(GlobalColor("Value Area")); ProfileHigh.SetPaintingStrategy(PaintingStrategy.HORIZONTAL); ProfileLow.SetPaintingStrategy(PaintingStrategy.HORIZONTAL); ProfileHigh.SetDefaultColor(GetColor(3)); ProfileLow.SetDefaultColor(GetColor(3)); ProfileHigh.Hide(); ProfileLow.Hide(); def bubble = isNaN(close[2]) and !isNaN(close[3]); AddChartBubble(bubble, VAHigh[3], "VAH", color = Color.YELLOW, yes); AddChartBubble(bubble, VALow[3], "VAL", Color.YELLOW, no); AddChartBubble(bubble, POC[3], "POC", Color.RED, no); # End Code Volume Profile User Set Time
Looking for some Volume Profile scans and looked at this one but after changing the plot scan line you get:
What would be the fix to get the scan to work?
View attachment 20167
No, it is not possible. POCs are driven by volume. Forex has no volume.Does anyone know how to plot market profile indicator for Forex trading on TOS?
# VPOC created by Sleepyz in Jan 2023
input Vdaysback = 30;
input V1daysback = 90;
input showonexpansion = no;
input begin  = 0930;
input end    = 1600;
def ymd      = GetYYYYMMDD();
def candles  = !IsNaN(close);
def capture  = candles and ymd != ymd[1];
def dayCount = CompoundValue(1, if capture then dayCount[1] + 1 else dayCount[1], 0);
def thisDay  = (HighestAll(dayCount) - dayCount) ;
def na       = Double.NaN;
def rth      = SecondsFromTime(begin) >= 0 and SecondsTillTime(end) >= 0;
def cond = rth != rth[1];

profile vol   = VolumeProfile("startNewProfile" = cond and secondstilltime(end)>=0, "onExpansion" = no, "numberOfProfiles" = 1000, pricePerRow = PricePerRow.TICKSIZE);
def pca       = if IsNaN(vol.GetPointOfControl())   then pca[1] else vol.GetPointOfControl()[1];
def poc       = if !rth or IsNaN(close) then poc[1] else pca[1];
###########

def Vpoc      = if thisDay == Vdaysback and secondsFromTime(begin) >= 0 then poc else vpoc[1];
def V1poc     = if thisDay == V1daysback and secondsFromTime(begin) >= 0 then poc else v1poc[1];

plot Vpoc1  = if showonexpansion and !IsNaN(close) or thisDay > Vdaysback then Double.NaN else vpoc;
plot V1poc1   = if showonexpansion and !IsNaN(close) or thisDay > V1daysback then Double.NaN else V1poc;

vpoc1.SetDefaultColor(Color.Yellow);
v1poc1.SetDefaultColor(Color.Yellow);

vpoc1.setpaintingStrategy(paintingStrategy.HORIZONTAL);
v1poc1.setpaintingStrategy(paintingStrategy.HORIZONTAL);Hi @SleepyZ,
I have been using this VPOC script that you created in Jan 2023. I tried to find where you posted this script but was unable to. It makes a line at the previous two days vpocs. I am interested in converting the script to give one line for the 30 day vpoc and another for the 90 day vpoc. I made a few small changes to the script by adding a V1daysback. The 30 day vpoc line seems to work, but the 90 day vpoc line is simply a 90 day extension of the 30 day vpoc line. Could you please make the code adjustment so that I get a seperate 90 day line?
https://tos.mx/YxPXDCa
Ruby:# VPOC created by Sleepyz in Jan 2023 input Vdaysback = 30; input V1daysback = 90; input showonexpansion = no; input begin = 0930; input end = 1600; def ymd = GetYYYYMMDD(); def candles = !IsNaN(close); def capture = candles and ymd != ymd[1]; def dayCount = CompoundValue(1, if capture then dayCount[1] + 1 else dayCount[1], 0); def thisDay = (HighestAll(dayCount) - dayCount) ; def na = Double.NaN; def rth = SecondsFromTime(begin) >= 0 and SecondsTillTime(end) >= 0; def cond = rth != rth[1]; profile vol = VolumeProfile("startNewProfile" = cond and secondstilltime(end)>=0, "onExpansion" = no, "numberOfProfiles" = 1000, pricePerRow = PricePerRow.TICKSIZE); def pca = if IsNaN(vol.GetPointOfControl()) then pca[1] else vol.GetPointOfControl()[1]; def poc = if !rth or IsNaN(close) then poc[1] else pca[1]; ########### def Vpoc = if thisDay == Vdaysback and secondsFromTime(begin) >= 0 then poc else vpoc[1]; def V1poc = if thisDay == V1daysback and secondsFromTime(begin) >= 0 then poc else v1poc[1]; plot Vpoc1 = if showonexpansion and !IsNaN(close) or thisDay > Vdaysback then Double.NaN else vpoc; plot V1poc1 = if showonexpansion and !IsNaN(close) or thisDay > V1daysback then Double.NaN else V1poc; vpoc1.SetDefaultColor(Color.Yellow); v1poc1.SetDefaultColor(Color.Yellow); vpoc1.setpaintingStrategy(paintingStrategy.HORIZONTAL); v1poc1.setpaintingStrategy(paintingStrategy.HORIZONTAL);
Code:####### Chart Mode input Chart_Mode = {default Intraday, Day}; def cond; switch (Chart_Mode) { case Intraday: cond = rth != rth[1]; case Day: cond = thisDay != thisDay[1]; }
 Code:
Code:# VPOC created by Sleepyz in Jan 2023 input Vdaysback = 30; input V1daysback = 90; input showonexpansion = no; input begin = 0930; input end = 1600; def ymd = GetYYYYMMDD(); def candles = !IsNaN(close); def capture = candles and ymd != ymd[1]; def dayCount = CompoundValue(1, if capture then dayCount[1] + 1 else dayCount[1], 0); def thisDay = (HighestAll(dayCount) - dayCount) ; def na = Double.NaN; def rth = SecondsFromTime(begin) >= 0 and SecondsTillTime(end) >= 0; ####### Chart Mode input Chart_Mode = {default Intraday, Day}; def cond; switch (Chart_Mode) { case Intraday: cond = rth != rth[1]; case Day: cond = thisDay != thisDay[1]; } profile vol = VolumeProfile("startNewProfile" = cond and SecondsTillTime(end) >= 0, "onExpansion" = no, "numberOfProfiles" = 1000, pricePerRow = PricePerRow.TICKSIZE); def pca = if IsNaN(vol.GetPointOfControl()) then pca[1] else vol.GetPointOfControl()[1]; def poc = if !rth or IsNaN(close) then poc[1] else pca[1]; ########### def Vpoc = if thisDay == Vdaysback and SecondsFromTime(begin) >= 0 then poc else Vpoc[1]; def V1poc = if thisDay == V1daysback and SecondsFromTime(begin) >= 0 then poc else V1poc[1]; plot Vpoc1 = if showonexpansion and !IsNaN(close) or thisDay > Vdaysback then Double.NaN else Vpoc; plot V1poc1 = if showonexpansion and !IsNaN(close) or thisDay > V1daysback then Double.NaN else V1poc; Vpoc1.SetDefaultColor(Color.YELLOW); V1poc1.SetDefaultColor(Color.YELLOW); Vpoc1.SetPaintingStrategy(PaintingStrategy.HORIZONTAL); V1poc1.SetPaintingStrategy(PaintingStrategy.HORIZONTAL); #
Hi Sleepyz,The code works with enough days timeframe displayed to separately do both 30 and 90 lookbacks for Intraday charts.
However, for Daily Charts, an adjustment for the def cond from rth != rth[1], which Day bars do not have, to ymd != ymd[1] was necessary.
The following switch for input Chart_Mode should fix that problem.
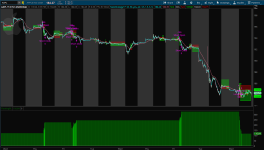
Here is the full code with an image with both an Intraday and Day Charts.
Hi Sleepyz,
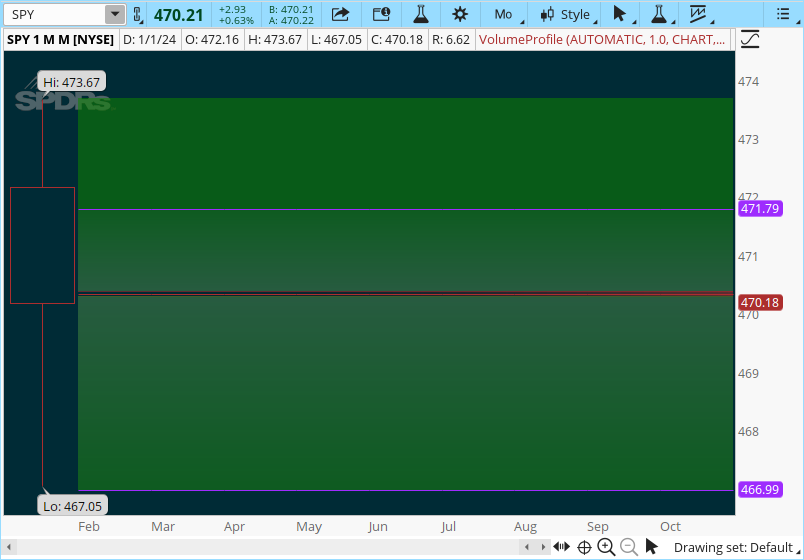
I'm looking at SPY's Vpoc1 line today, 1/5/24, at 450.81. It is set to 30 vdaysback on Day chart mode. I thought this would give me the monthly vpoc but I just saw that someone who puts out good info state that the monthly vpoc is 472. Can you please let me know if this script gives the monthly vpoc and setting v1poc1to 90 gives the correct quarterly vpoc? The 90 day v1poc1 is currently at 441.62. Thanks
Thanks for the reply MerryDay. Is there a script that allows me to see the monthly vpoc on shorter timeframes like the daily and the hourly?Monthly Volume Point of Control. Is based on a ONE month bar on the MONTHly chart
shared chart link: http://tos.mx/TBVjg3p Click here for --> Easiest way to load shared links
https://usethinkscript.com/threads/multi-timeframe-mtf-poc.9496/#post-86976Thanks for the reply MerryDay. Is there a script that allows me to see the monthly vpoc on shorter timeframes like the daily and the hourly?
I'm wondering if Sleepyz's vpoc script above can be edited to gather the vpocs of 29, 22, 15, 8, and 1day ago and average them to get an approximate monthly vpoc, as long as today isn't a Sunday or a Monday.
I'm wondering if Sleepyz's vpoc script above can be edited to gather the vpocs of 29, 22, 15, 8, and 1day ago and average them to get an approximate monthly vpoc, as long as today isn't a Sunday or a Monday.
 Code:
Code:# VPOC created by Sleepyz in Jan 2023 input Vdaysback = 1; input V1daysback = 8; input V2daysback = 15; input V3daysback = 22; input V4daysback = 29; input showonexpansion = no; input begin = 0930; input end = 1600; def ymd = GetYYYYMMDD(); def candles = !IsNaN(close); def capture = candles and ymd != ymd[1]; def dayCount = CompoundValue(1, if capture then dayCount[1] + 1 else dayCount[1], 0); def thisDay = (HighestAll(dayCount) - dayCount) ; def na = Double.NaN; def rth = SecondsFromTime(begin) >= 0 and SecondsTillTime(end) >= 0; ####### Chart Mode input Chart_Mode = {default Intraday, Day}; def cond; switch (Chart_Mode) { case Intraday: cond = rth != rth[1]; case Day: cond = thisDay != thisDay[1]; } profile vol = VolumeProfile("startNewProfile" = cond and SecondsTillTime(end) >= 0, "onExpansion" = no, "numberOfProfiles" = 1000, pricePerRow = PricePerRow.TICKSIZE); def pca = if IsNaN(vol.GetPointOfControl()) then pca[1] else vol.GetPointOfControl()[1]; def poc = if !rth or IsNaN(close) then poc[1] else pca[1]; ########### #Day of Week input Show_DayofWeek_Test = yes; def vday = if thisDay == Vdaysback then GetDayOfWeek(GetYYYYMMDD()) else vday[1]; def v1day = if thisDay == V1daysback then GetDayOfWeek(GetYYYYMMDD()) else v1day[1]; def v2day = if thisDay == V2daysback then GetDayOfWeek(GetYYYYMMDD()) else v2day[1]; def v3day = if thisDay == V3daysback then GetDayOfWeek(GetYYYYMMDD()) else v3day[1]; def v4day = if thisDay == V4daysback then GetDayOfWeek(GetYYYYMMDD()) else v4day[1]; AddLabel(Show_DayofWeek_Test, "Test_ Day of Week || V: " + vday + "; V1: " + v1day + "; V2: " + v2day + "; V3: " + v3day + "; V4: " + v4day, Color.YELLOW); ######## Vpocs def Vpoc = if thisDay == Vdaysback + if vday == 1 then 1 else 0 and SecondsFromTime(begin) >= 0 then poc else Vpoc[1]; def V1poc = if thisDay == V1daysback + if vday == 1 then 1 else 0 and SecondsFromTime(begin) >= 0 then poc else V1poc[1]; def V2poc = if thisDay == V2daysback + if vday == 1 then 1 else 0 and SecondsFromTime(begin) >= 0 then poc else V2poc[1]; def V3poc = if thisDay == V3daysback + if vday == 1 then 1 else 0 and SecondsFromTime(begin) >= 0 then poc else V3poc[1]; def V4poc = if thisDay == V4daysback + if vday == 1 then 1 else 0 and SecondsFromTime(begin) >= 0 then poc else V4poc[1]; plot Vpoc1 = if showonexpansion and !IsNaN(close) or thisDay > Vdaysback then Double.NaN else Vpoc; plot V1poc1 = if showonexpansion and !IsNaN(close) or thisDay > V1daysback then Double.NaN else V1poc; plot V2poc1 = if showonexpansion and !IsNaN(close) or thisDay > V2daysback then Double.NaN else V2poc; plot V3poc1 = if showonexpansion and !IsNaN(close) or thisDay > V3daysback then Double.NaN else V3poc; plot V4poc1 = if showonexpansion and !IsNaN(close) or thisDay > V4daysback then Double.NaN else V4poc; Vpoc1.SetDefaultColor(Color.YELLOW); V1poc1.SetDefaultColor(Color.YELLOW); V2poc1.SetDefaultColor(Color.YELLOW); V3poc1.SetDefaultColor(Color.YELLOW); V4poc1.SetDefaultColor(Color.YELLOW); Vpoc1.SetPaintingStrategy(PaintingStrategy.HORIZONTAL); V1poc1.SetPaintingStrategy(PaintingStrategy.HORIZONTAL); V2poc1.SetPaintingStrategy(PaintingStrategy.HORIZONTAL); V3poc1.SetPaintingStrategy(PaintingStrategy.HORIZONTAL); V4poc1.SetPaintingStrategy(PaintingStrategy.HORIZONTAL); ######### Average of Vpocs plot AvgVpoc1 = if GetDay() != GetLastDay() then Double.NaN else (Vpoc1 + V1poc1 + V2poc1 + V3poc1 + V4poc1) / 5; AvgVpoc1.SetDefaultColor(Color.CYAN); AvgVpoc1.SetPaintingStrategy(PaintingStrategy.HORIZONTAL); AvgVpoc1.SetLineWeight(3); AddLabel(1, "Avg Vpoc: " + AsText(AvgVpoc1), Color.CYAN); ######### Bubbles input showbubbles = yes; input bubblemover = 2; def b = bubblemover; def b1 = b + 1; def mover = showbubbles and !IsNaN(close[b1]) and IsNaN(close[b]); AddChartBubble(mover, AvgVpoc1, "AV", AvgVpoc1.TakeValueColor()); AddChartBubble(mover, Vpoc1, "V" + (Vdaysback + if vday == 1 then 1 else 0), Vpoc1.TakeValueColor()); AddChartBubble(mover, V1poc1, "V" + (V1daysback + if v1day == 1 then 1 else 0), V1poc1.TakeValueColor()); AddChartBubble(mover, V2poc1, "V" + (V2daysback + if v2day == 1 then 1 else 0), V2poc1.TakeValueColor()); AddChartBubble(mover, V3poc1, "V" + (V3daysback + if v3day == 1 then 1 else 0), V3poc1.TakeValueColor()); AddChartBubble(mover, V4poc1, "V" + (V4daysback + if v4day == 1 then 1 else 0), V4poc1.TakeValueColor()); #
Thanks for updating the script. I just want to see a line for the average vpoc and tried to comment out the others and change plot to def so they wouldn't show, but now the average vpoc line appears as a dash today only on the daily chart and doesn't extend to the right. The bubble and label do show. Thanks for your help.This will add 1 day if the day of the week is Sunday/Monday for the lookback days.
This works as you wantedThanks for updating the script. I just want to see a line for the average vpoc and tried to comment out the others and change plot to def so they wouldn't show, but now the average vpoc line appears as a dash today only on the daily chart and doesn't extend to the right. The bubble and label do show. Thanks for your help.
https://tos.mx/StM6MSX
 Code:
Code:# VPOC created by Sleepyz in Jan 2023 input hide_non_avg_plots = yes; input Vdaysback = 1; input V1daysback = 8; input V2daysback = 15; input V3daysback = 22; input V4daysback = 29; input showonexpansion = no; input begin = 0930; input end = 1600; def ymd = GetYYYYMMDD(); def candles = !IsNaN(close); def capture = candles and ymd != ymd[1]; def dayCount = CompoundValue(1, if capture then dayCount[1] + 1 else dayCount[1], 0); def thisDay = (HighestAll(dayCount) - dayCount) ; def na = Double.NaN; def rth = SecondsFromTime(begin) >= 0 and SecondsTillTime(end) >= 0; ####### Chart Mode input Chart_Mode = {default Intraday, Day}; def cond; switch (Chart_Mode) { case Intraday: cond = rth != rth[1]; case Day: cond = thisDay != thisDay[1]; } profile vol = VolumeProfile("startNewProfile" = cond and SecondsTillTime(end) >= 0, "onExpansion" = no, "numberOfProfiles" = 1000, pricePerRow = PricePerRow.TICKSIZE); def pca = if IsNaN(vol.GetPointOfControl()) then pca[1] else vol.GetPointOfControl()[1]; def poc = if !rth or IsNaN(close) then poc[1] else pca[1]; ########### #Day of Week input Show_DayofWeek_Test = yes; def vday = if thisDay == Vdaysback then GetDayOfWeek(GetYYYYMMDD()) else vday[1]; def v1day = if thisDay == V1daysback then GetDayOfWeek(GetYYYYMMDD()) else v1day[1]; def v2day = if thisDay == V2daysback then GetDayOfWeek(GetYYYYMMDD()) else v2day[1]; def v3day = if thisDay == V3daysback then GetDayOfWeek(GetYYYYMMDD()) else v3day[1]; def v4day = if thisDay == V4daysback then GetDayOfWeek(GetYYYYMMDD()) else v4day[1]; AddLabel(Show_DayofWeek_Test, "Test_ Day of Week || V: " + vday + "; V1: " + v1day + "; V2: " + v2day + "; V3: " + v3day + "; V4: " + v4day, Color.YELLOW); ######## Vpocs def Vpoc = if thisDay == Vdaysback + if vday == 1 then 1 else 0 and SecondsFromTime(begin) >= 0 then poc else Vpoc[1]; def V1poc = if thisDay == V1daysback + if vday == 1 then 1 else 0 and SecondsFromTime(begin) >= 0 then poc else V1poc[1]; def V2poc = if thisDay == V2daysback + if vday == 1 then 1 else 0 and SecondsFromTime(begin) >= 0 then poc else V2poc[1]; def V3poc = if thisDay == V3daysback + if vday == 1 then 1 else 0 and SecondsFromTime(begin) >= 0 then poc else V3poc[1]; def V4poc = if thisDay == V4daysback + if vday == 1 then 1 else 0 and SecondsFromTime(begin) >= 0 then poc else V4poc[1]; plot Vpoc1 = if showonexpansion and !IsNaN(close) or thisDay > Vdaysback then Double.NaN else Vpoc; plot V1poc1 = if showonexpansion and !IsNaN(close) or thisDay > V1daysback then Double.NaN else V1poc; plot V2poc1 = if showonexpansion and !IsNaN(close) or thisDay > V2daysback then Double.NaN else V2poc; plot V3poc1 = if showonexpansion and !IsNaN(close) or thisDay > V3daysback then Double.NaN else V3poc; plot V4poc1 = if showonexpansion and !IsNaN(close) or thisDay > V4daysback then Double.NaN else V4poc; Vpoc1.SetDefaultColor(Color.YELLOW); V1poc1.SetDefaultColor(Color.YELLOW); V2poc1.SetDefaultColor(Color.YELLOW); V3poc1.SetDefaultColor(Color.YELLOW); V4poc1.SetDefaultColor(Color.YELLOW); Vpoc1.SetPaintingStrategy(PaintingStrategy.HORIZONTAL); V1poc1.SetPaintingStrategy(PaintingStrategy.HORIZONTAL); V2poc1.SetPaintingStrategy(PaintingStrategy.HORIZONTAL); V3poc1.SetPaintingStrategy(PaintingStrategy.HORIZONTAL); V4poc1.SetPaintingStrategy(PaintingStrategy.HORIZONTAL); vpoc1.sethiding(hide_non_avg_plots); v1poc1.sethiding(hide_non_avg_plots); v2poc1.sethiding(hide_non_avg_plots); v3poc1.sethiding(hide_non_avg_plots); v4poc1.sethiding(hide_non_avg_plots); ######### Average of Vpocs def avgpoc = if isnan(close) then avgpoc[1] else if GetDay() != GetLastDay() then Double.NaN else (Vpoc1 + V1poc1 + V2poc1 + V3poc1 + V4poc1) / 5; plot AvgVpoc1 = avgpoc; AvgVpoc1.SetDefaultColor(Color.CYAN); AvgVpoc1.SetPaintingStrategy(PaintingStrategy.HORIZONTAL); AvgVpoc1.SetLineWeight(3); AddLabel(1, "Avg Vpoc: " + AsText(AvgVpoc1), Color.CYAN); ######### Bubbles input showbubbles = no; input bubblemover = 2; def b = bubblemover; def b1 = b + 1; def mover = showbubbles and !IsNaN(close[b1]) and IsNaN(close[b]); AddChartBubble(mover, AvgVpoc1, "AV", AvgVpoc1.TakeValueColor()); AddChartBubble(mover, Vpoc1, "V" + (Vdaysback + if vday == 1 then 1 else 0), Vpoc1.TakeValueColor()); AddChartBubble(mover, V1poc1, "V" + (V1daysback + if v1day == 1 then 1 else 0), V1poc1.TakeValueColor()); AddChartBubble(mover, V2poc1, "V" + (V2daysback + if v2day == 1 then 1 else 0), V2poc1.TakeValueColor()); AddChartBubble(mover, V3poc1, "V" + (V3daysback + if v3day == 1 then 1 else 0), V3poc1.TakeValueColor()); AddChartBubble(mover, V4poc1, "V" + (V4daysback + if v4day == 1 then 1 else 0), V4poc1.TakeValueColor()); #
Join useThinkScript to post your question to a community of 21,000+ developers and traders.
Start a new thread and receive assistance from our community.
useThinkScript is the #1 community of stock market investors using indicators and other tools to power their trading strategies. Traders of all skill levels use our forums to learn about scripting and indicators, help each other, and discover new ways to gain an edge in the markets.
We get it. Our forum can be intimidating, if not overwhelming. With thousands of topics, tens of thousands of posts, our community has created an incredibly deep knowledge base for stock traders. No one can ever exhaust every resource provided on our site.
If you are new, or just looking for guidance, here are some helpful links to get you started.