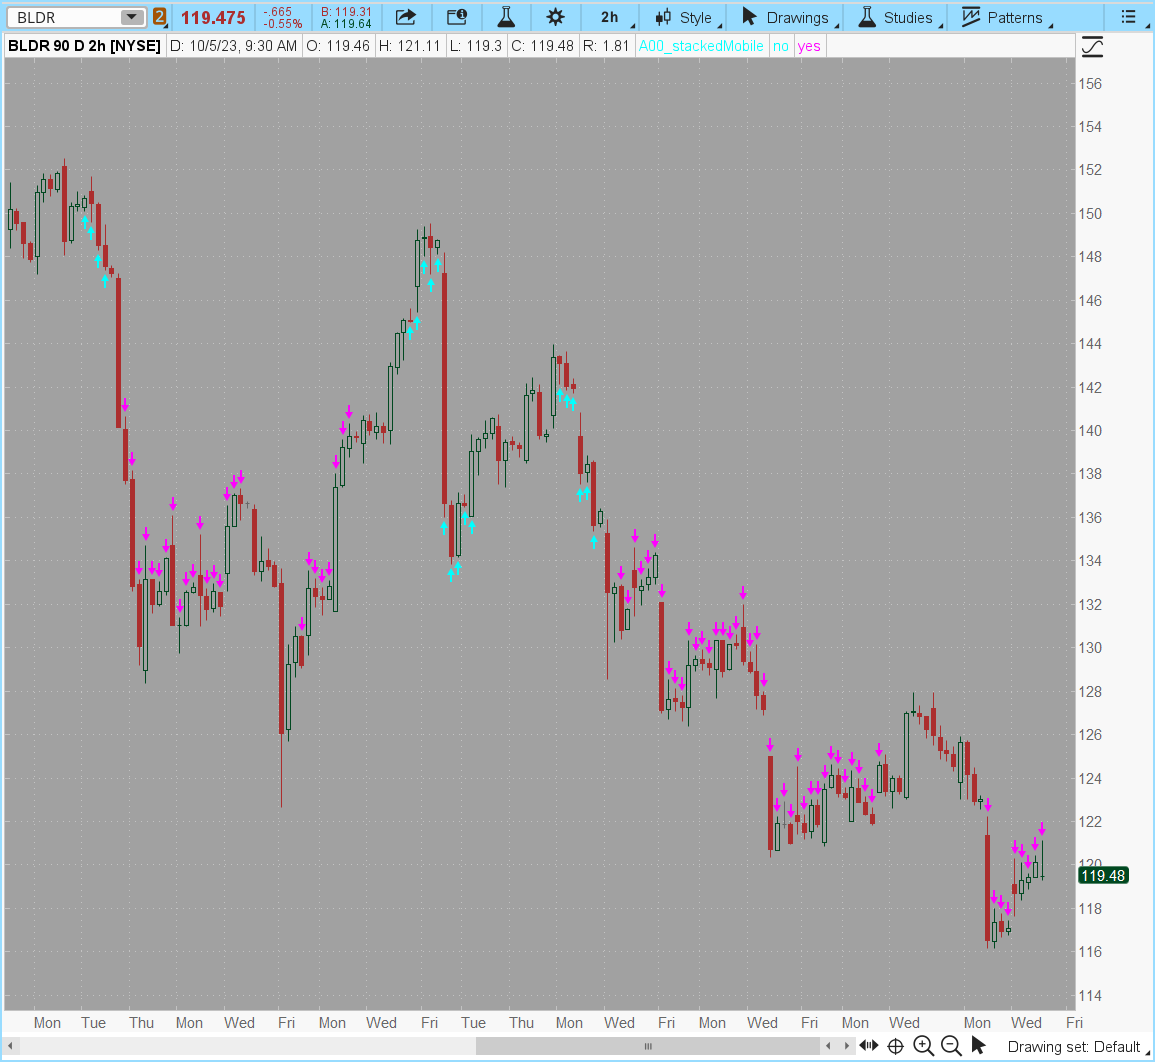
is there a way to get an arrow on mobile when 3 ema's are stacked correctly?
what is the code to scan when this occurs?Here ya go:
Ruby:def stackedUp = Average(close,10) is greater than Average(close,20) and Average(close,20) is greater than Average(close,50); def stackedDn = Average(close,10) is less than Average(close,20) and Average(close,20) is less than Average(close,50); AddLabel(yes, " Stacked ", if stackedUp then Color.GREEN else if stackedDn then Color.RED else Color.GRAY);
Last edited by a moderator: