UT Bot For ThinkOrSwim

I am searching for a functional script of UT Bot Alerts, a trading indicator that signals buying and selling, on Thinkorswim platform. Although I used Chat GPT to convert the script, it didn't provide me with a working version. Is there anyone who can assist me by sharing a functional script?
 
Any way to port this to work on the mobile ToS app?? Maybe it doesn't work simply because it's a strategy and not a study but im not sure!
 
I am searching for a functional script of UT Bot Alerts, a trading indicator that signals buying and selling, on Thinkorswim platform. Although I used Chat GPT to convert the script, it didn't provide me with a working version. Is there anyone who can assist me by sharing a functional script?
Did you ever get the Ut bot to work in tos??
 
Yes. Go to the beginning of this thread. My original post is the 3rd post (after the Tradingview post which shows the original version.) There are B and S signals in that code. You may need to tweak the settings for the time frames you use. Be sure to use other studies to validate that it is indeed a Buy or Sell, as I'm sure you know it is never good to rely on just one study for your trades. Good luck.
 
Last edited by a moderator:
I am searching for a functional script of UT Bot Alerts, a trading indicator that signals buying and selling, on Thinkorswim platform. Although I used Chat GPT to convert the script, it didn't provide me with a working version. Is there anyone who can assist me by sharing a functional script?
Did you ever get the Ut bot to work in tos??
This is the most current version. It has arrows and alerts:
https://usethinkscript.com/threads/ut-bot-for-thinkorswim.12640/
 
Last edited:
Interesting. It would be great if one of the developers here could compare the original TradingView to the conversion to validate the quality of the conversion. Any takers?
Hi @ttsdmagic , could I get a copy of your latest Ut Bot alert indicators? Maybe you could share a copy that I could import for I am new to using TOS. Also, any suggestions on the best settings for a 1-min and 5-min chart are appreciated. My thanks in advance.
 
Last edited by a moderator:
Hi ttsdmagic, could I get a copy of your latest Ut Bot alert indicators? Maybe you could share a copy that I could import for I am new to using TOS. Also, any suggestions on the best settings for a 1-min and 5-min chart are appreciated. My thanks in advance.
I use the code posted by samer800
https://usethinkscript.com/threads/ut-bot-for-thinkorswim.12640/#post-119620

It's called ATR Trailing Stop. It is the original utbot code stripped down to it's essentials. It works well for me but I can't recommend settings for the time frames you use.

I do swing trading and I use 4 hour, Daily, 3 Day and Weekly time frames. Maybe someone who day trades with your time frames can jump in and suggest settings. Good luck.
 
Last edited by a moderator:
Thank you @ttsdmagic for posting this indicator. It works great. Since I use 2 min and 5 min timeframe to trade, but the watchlist doesn't get updated within that timeframe when using the scan search posted in #7 . I hope it is alright that I took the liberty to modify the indicator so that would work in the watchlist column. I'm still new to code in thinkscript. All I did was really simple. I added the three lines of code below right after the statement (def sell = src < xATRTrailingStop and below) and then delete the rest of the code. The 1 and -1 is just random numbers for me to sort the column and also can be displayed on my mobile app. I hope this help!
Code:
plot UT_Bot = if buy then 1 else if sell then -1 else 0;
AssignBackgroundColor(if buy then color.dark_green else if sell then color.red else color.gray);
UT_Bot.assignValueColor(color.black);

Here is what the column looks like.
View attachment 17468
I know this is light lift but I'm not sure how to do it. is there a way to modify the code on the watchlist column to stay red or green as long as the signal is vaild, what happening now is that the background color goes to gray once the signal is met. I would like for it to stay red or green as long as the signal is a valid. Thanks
 
I know this is light lift but I'm not sure how to do it. is there a way to modify the code on the watchlist column to stay red or green as long as the signal is vaild, what happening now is that the background color goes to gray once the signal is met. I would like for it to stay red or green as long as the signal is a valid. Thanks
That's a good idea. Maybe @samer800 can help with this? Or any of the other gurus on the site. Following.
 
That's a good idea. Maybe @samer800 can help with this? Or any of the other gurus on the site. Following.
replace background color code with this.

CSS:
def UT_Bot = if buy then 1 else if sell then -1 else UT_Bot[1];
AssignBackgroundColor(if UT_Bot>0 then color.dark_green else
                      if UT_Bot<0 then color.red else color.gray);
 
Is it possible for one of you genius's to add a way to off the buy or sell signal. I am finding that buy signal and sell signals may occur best on different settings. The chart looks very confusing with 2 sets of UT Bot signals. So if I was able to turn off the buy on one set and the sell on the other....that would be awesome!!

As always...I appreciate your knowledge and willingness to help in this matter
 
That's a good idea. Maybe @samer800 can help with this? Or any of the other gurus on the site. Following.
if you want a count of how many bars the UT Bot has been in Buy or Sell mode, here is the snippet of code to add to your watchlist column :
input label = yes;
Assignbackgroundcolor(if barbuy then Color.WHITE else if barsell then COLOR.MAGENTA else Color.DARK_GRAY );

rec countup = if barbuy then countup[1] + 1 else 0;
rec countdn = if barsell then countdn[1] - 1 else 0;

AddLabel(Label, Concat("UT_BOT ", if barbuy then countup else countdn), if barbuy then Color.BLUE else if barsell then Color.DARK_GRAY else Color.DARK_GRAY );
 
Is it possible for one of you genius's to add a way to off the buy or sell signal. I am finding that buy signal and sell signals may occur best on different settings. The chart looks very confusing with 2 sets of UT Bot signals. So if I was able to turn off the buy on one set and the sell on the other....that would be awesome!!

As always...I appreciate your knowledge and willingness to help in this matter
Try this :

#input show_labels = yes;
input show_bubbles = yes;
input show_bubbles2 = yes;
addchartbubble(show_bubbles and buy, low, "BotB", Color.CYAN, no);
addchartbubble(show_bubbles2 and sell, high, "BotS", Color.YELLOW, yes);
 
Is there a way to make this indicator have actual buy and sell signals that will give you a floating P&L? This is my first post so take it easy on me, I dont always know what I am doing or asking

Is there a way to make the UT BOT indicator have actual buy and sell signals that will give you a floating P&L?
This is my first post so take it easy on me, I dont always know what I am doing or asking.
 
Last edited by a moderator:
Is there a way to make this indicator have actual buy and sell signals that will give you a floating P&L? This is my first post so take it easy on me, I dont always know what I am doing or asking

Is there a way to make the UT BOT indicator have actual buy and sell signals that will give you a floating P&L?
This is my first post so take it easy on me, I dont always know what I am doing or asking.
UT Bot Strategy For ThinkOrSwim
It should be noted that this particular UT Bot was written for use on:
4 hour, Daily, 3 Day and Weekly time frames
However, many members are using it on shorter aggregations. Read through this thread to find out what modifications other members have found useful when applying to lower timeframes.

The most common mistake members make with strategies is NOT pasting them into the Strategy tab (to the right of the Study tab). If you are having difficulty loading this study, here is a link to a chart with the strategy already loaded.
shared chart link: http://tos.mx/FlE8fEb Click here for --> Easiest way to load shared links

Another mistake, is the believing strategies can be used for automatic trade entry.
Strategies are only for backtesting. They show hypothetical trades based on buy / sell conditions.


Please Note:
AddOrder scripts need to utilize the open of the next candle open[-1]
As shown here:
https://tlc.thinkorswim.com/center/reference/thinkScript/Functions/Others/AddOrder#:~:text=price-,open[-1],-Defines price at

Here is why:
A short-coming of the ToS strategy is that the calculation of P&L results can only be computed after the candle is closed. ToS does not provide the ability to capture inter-candle activity.

The sole method for ToS strategies to accurately compute P&L results is to wait for the current candle to complete its close. There are no alternative approaches! Any other method leads to repainting and misleadingly outcomes.

Lastly, research has never found that any one indicator used in isolation is profitable.
Trending indicators like this one will be profitable during bullish trends, but will be subjected to whipsaws during consolidation.
Therefore, must be used as part of an overall good basic strategy.
read more: https://usethinkscript.com/threads/basics-for-developing-a-good-strategy.8058/


l5MQRcW.png

Ruby:
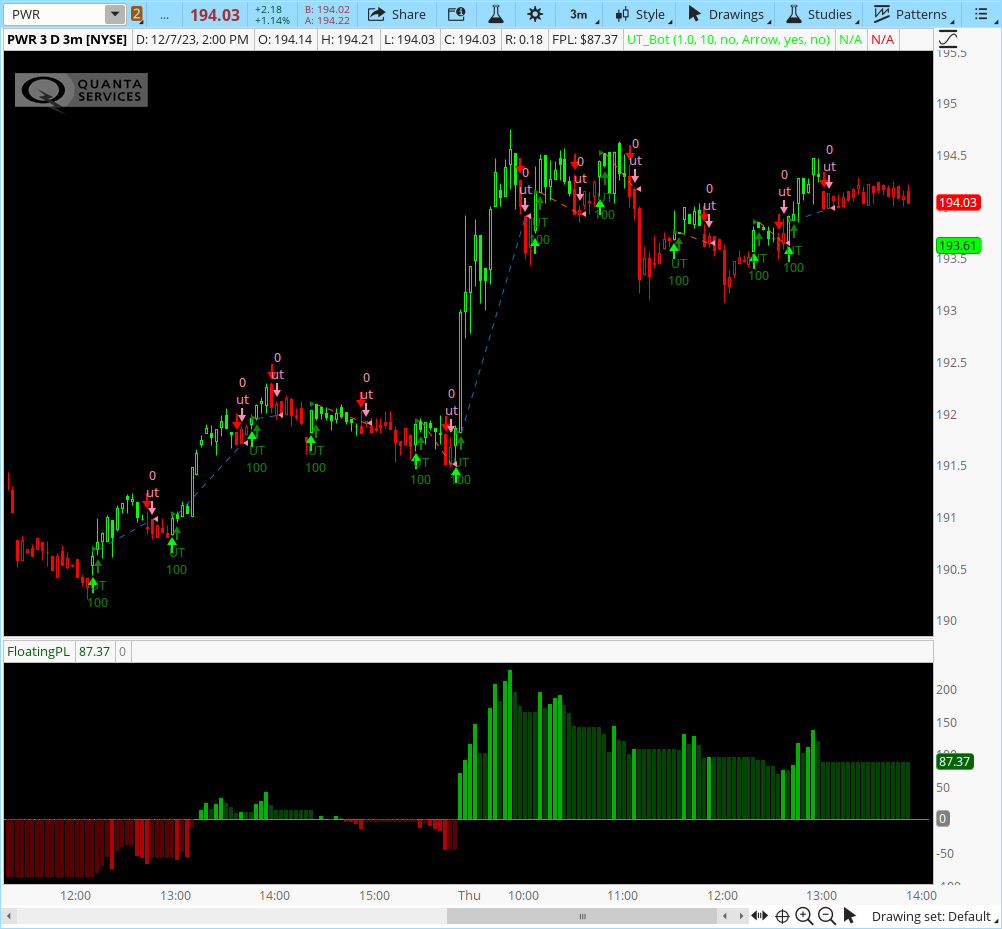
# ATR Trailing Stop  STRATEGY only.  MUST be pasted in the Strategy tab
# https://usethinkscript.com/threads/ut-bot-for-thinkorswim.12640/#post-116615

input Key_Vaule = 1.0;
def a = key_vaule;# input(1, title = "Key Vaule. 'This changes the sensitivity'")
input atr_period = 10;
def c = atr_period; # input(10, title = "ATR Period")
input Signals_from_Heikin_Ashi_Candles = no;
def h = signals_from_Heikin_Ashi_Candles; # input(false, title = "Signals from Heikin Ashi Candles")
input SignalStyle = {Default "Arrow", "Label", "None"};

def na = Double.NaN;
defineglobalColor("Green", color.Green);
defineglobalcolor("Red", color.Red);


def arrow = SignalStyle==SignalStyle."Arrow";
def Label = SignalStyle==SignalStyle."Label";
def SigStyle = if arrow then 1 else if Label then -1 else 0;
def xATR = atr(c);
def nLoss = a * xATR;


def src = if h then (open + high + low + close) / 4 else close;

script nz{
input x = close;
input y = 0;
plot result = if isnan(x) then y else x;
}

#xATRTrailingStop = 0.0
def xATRTrailingStop =compoundValue(1, if(src > nz(xATRTrailingStop[1], 0) and src[1] > nz(xATRTrailingStop[1], 0), max(nz(xATRTrailingStop[1]), src - nLoss),
if(src < nz(xATRTrailingStop[1], 0) and src[1] < nz(xATRTrailingStop[1], 0), min(nz(xATRTrailingStop[1]), src + nLoss),
if(src > nz(xATRTrailingStop[1], 0), src - nLoss, src + nLoss))),0);

#pos = 0
def pos = compoundValue(1, if(src[1] < nz(xATRTrailingStop[1], 0) and src > nz(xATRTrailingStop[1], 0), 1,
if(src[1] > nz(xATRTrailingStop[1], 0) and src < nz(xATRTrailingStop[1], 0), -1, nz(pos[1], 0))) , 0);

def ema = expaverage(src,1);
def above = crosses(ema, xATRTrailingStop, crossingDirection.ABOVE);
def below = crosses(xATRTrailingStop, ema, crossingDirection.ABOVE);

def buy = src > xATRTrailingStop and above ;
def sell = src < xATRTrailingStop and below;

def barbuy = src > xATRTrailingStop ;
def barsell = src < xATRTrailingStop ;

plot ArrowUp = if Arrow and buy then low - ATR(5)/10 else na;
ArrowUp.SetPaintingStrategy(PaintingStrategy.ARROW_UP);
ArrowUp.SetDefaultColor(globalColor("Green"));
ArrowUp.SetLineWeight(2);
plot ArrowDn = if Arrow and sell then high + ATR(5)/10 else na;
ArrowDn.SetPaintingStrategy(PaintingStrategy.ARROW_DOWN);
ArrowDn.SetDefaultColor(globalColor("Red"));
ArrowDn.SetLineWeight(2);


addchartbubble(Label and buy, low, "B", globalColor("Green"), no);
addchartbubble(Label and sell, high, "S", globalColor("Red"), yes);

input price_color_on = yes;
assignPriceColor(if !price_color_on then color.current else if barbuy then globalColor("Green") else color.CURRENT);
assignpriceColor(if !price_color_on then color.current else if barsell then globalColor("Red") else color.currENT);

input alert_sound_on = no;
alert(buy, "UT Long", alert.bar,if alert_sound_on then sound.ring else sound.NoSound);
alert(sell, "UT Short", alert.bar,if alert_sound_on then sound.bell else sound.NoSound);

AddOrder(OrderType.BUY_to_OPEN, buy, tickColor = GetColor(1), arrowColor = GetColor(1), name = "UT");
AddOrder(OrderType.SELL_TO_CLOSE, sell, tickColor = GetColor(2), arrowColor = GetColor(2), name = "ut");
 
Last edited:
MerryDay, I am amazed at how talented this group is, I tried to "ChatGPT" this script for 4 hours lol and could not get it to work. I am 52 years old so not the most technologically advanced but I am here to learn.
Thank you so much this is awesome.
 
I really like the indicator now I"m going to test it to see if it repaints. How would we be able to scan with this? I posted the script on custom scan and says "exactly one plot is expected"?


Hey @samer800 I want to be able to scan for stocks using this script. I posted the script in thinkorswim to custom scan and it says "exactly one plot is expected" What am I doing wrong?
 
Last edited by a moderator:
I really like the indicator now I"m going to test it to see if it repaints. How would we be able to scan with this? I posted the script on custom scan and says "exactly one plot is expected"?


Hey @samer800 I want to be able to scan for stocks using this script. I posted the script in thinkorswim to custom scan and it says "exactly one plot is expected" What am I doing wrong?


Generally, the "exactly one plot expected" is seen when an attempt is made to cut&paste an entire chart study into the scan hacker.

Here is the tutorial for creating scans:
https://usethinkscript.com/threads/how-to-use-thinkorswim-stock-hacker-scans.284/.
 
Last edited:

Join useThinkScript to post your question to a community of 21,000+ developers and traders.

Similar threads

Not the exact question you're looking for?

Start a new thread and receive assistance from our community.

87k+ Posts
485 Online
Create Post

Similar threads

Similar threads

The Market Trading Game Changer

Join 2,500+ subscribers inside the useThinkScript VIP Membership Club
  • Exclusive indicators
  • Proven strategies & setups
  • Private Discord community
  • ‘Buy The Dip’ signal alerts
  • Exclusive members-only content
  • Add-ons and resources
  • 1 full year of unlimited support

Frequently Asked Questions

What is useThinkScript?

useThinkScript is the #1 community of stock market investors using indicators and other tools to power their trading strategies. Traders of all skill levels use our forums to learn about scripting and indicators, help each other, and discover new ways to gain an edge in the markets.

How do I get started?

We get it. Our forum can be intimidating, if not overwhelming. With thousands of topics, tens of thousands of posts, our community has created an incredibly deep knowledge base for stock traders. No one can ever exhaust every resource provided on our site.

If you are new, or just looking for guidance, here are some helpful links to get you started.

What are the benefits of VIP Membership?
VIP members get exclusive access to these proven and tested premium indicators: Buy the Dip, Advanced Market Moves 2.0, Take Profit, and Volatility Trading Range. In addition, VIP members get access to over 50 VIP-only custom indicators, add-ons, and strategies, private VIP-only forums, private Discord channel to discuss trades and strategies in real-time, customer support, trade alerts, and much more. Learn all about VIP membership here.
How can I access the premium indicators?
To access the premium indicators, which are plug and play ready, sign up for VIP membership here.
Back
Top