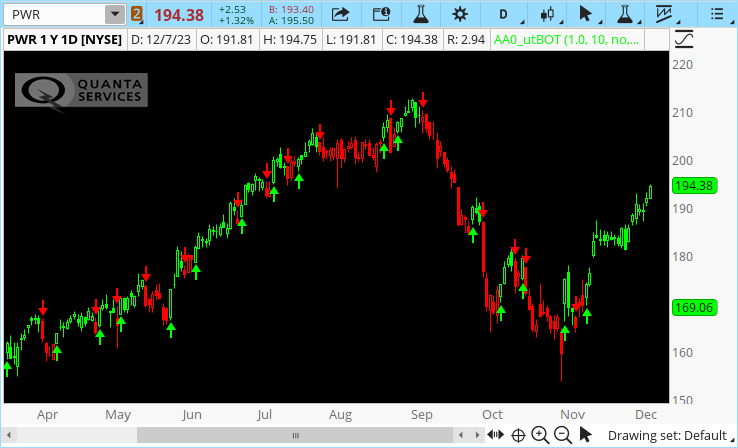
esvafromdc
New member
Last edited by a moderator:
Join useThinkScript to post your question to a community of 21,000+ developers and traders.
input Key_Vaule = 1.0;
def a = key_vaule;# input(1, title = "Key Vaule. 'This changes the sensitivity'")
input atr_period = 10;
def c = atr_period; # input(10, title = "ATR Period")
input Signals_from_Heikin_Ashi_Candles = no;
def h = signals_from_Heikin_Ashi_Candles; # input(false, title = "Signals from Heikin Ashi Candles")
input show_labels = yes;
def xATR = atr(c);
def nLoss = a * xATR;
def src = if h then (open + high + low + close) / 4 else close;
script nz{
input x = close;
input y = 0;
plot result = if isnan(x) then y else x;
}
#xATRTrailingStop = 0.0
def xATRTrailingStop =compoundValue(1, if(src > nz(xATRTrailingStop[1], 0) and src[1] > nz(xATRTrailingStop[1], 0), max(nz(xATRTrailingStop[1]), src - nLoss),
if(src < nz(xATRTrailingStop[1], 0) and src[1] < nz(xATRTrailingStop[1], 0), min(nz(xATRTrailingStop[1]), src + nLoss),
if(src > nz(xATRTrailingStop[1], 0), src - nLoss, src + nLoss))),0);
#pos = 0
def pos = compoundValue(1, if(src[1] < nz(xATRTrailingStop[1], 0) and src > nz(xATRTrailingStop[1], 0), 1,
if(src[1] > nz(xATRTrailingStop[1], 0) and src < nz(xATRTrailingStop[1], 0), -1, nz(pos[1], 0))) , 0);
def ema = expaverage(src,1);
def above = crosses(ema, xATRTrailingStop, crossingDirection.ABOVE);
def below = crosses(xATRTrailingStop, ema, crossingDirection.ABOVE);
def buy = src > xATRTrailingStop and above ;
def sell = src < xATRTrailingStop and below;
def barbuy = src > xATRTrailingStop ;
def barsell = src < xATRTrailingStop ;
defineglobalColor("Green", color.Green);
defineglobalcolor("Red", color.Red);
addchartbubble(show_labels and buy, low, "B", globalColor("Green"), no);
addchartbubble(show_labels and sell, high, "S", globalColor("Red"), yes);
input price_color_on = yes;
assignPriceColor(if !price_color_on then color.current else if barbuy then globalColor("Green") else color.CURRENT);
assignpriceColor(if !price_color_on then color.current else if barsell then globalColor("Red") else color.currENT);
input alert_sound_on = no;
alert(buy, "UT Long", alert.bar,if alert_sound_on then sound.ring else sound.NoSound);
alert(sell, "UT Short", alert.bar,if alert_sound_on then sound.bell else sound.NoSound);
I swing trade so I use 4hr D. 3D and W. The value is a parameter in the study so you'll need to experiment with it to find the best value for your time frames. B and. S are pretty accurate on 4:hr and Daily with it set to 1.@esvafromdc @ttsdmagic Thank you. The input parameter for the first post code is "keyvalue" of 3, and for the second post code, it is "key value" of 1. What is the ideal input configuration (key value and atrperiod) for the 1 or 2 min time frame, based on your experience?. Thank you
Thanks very much. I definitely would have never arrived at that formula conversion, so, I'm learning!I actually paid someone on Fiverr to convert UT Bot To TOS. Here's the code. Maybe you can use some of what he wrote. And yes I know he mis-spelled Value early in the code. Doesn't matter. The conversion seems accurate, and the signals are great. I had him shorten Buy and Sell to B and S to conserve screen space. Good luck.
input Key_Vaule = 1.0;
def a = key_vaule;# input(1, title = "Key Vaule. 'This changes the sensitivity'")
input atr_period = 10;
def c = atr_period; # input(10, title = "ATR Period")
input Signals_from_Heikin_Ashi_Candles = no;
def h = signals_from_Heikin_Ashi_Candles; # input(false, title = "Signals from Heikin Ashi Candles")
input show_labels = yes;
def xATR = atr(c);
def nLoss = a * xATR;
def src = if h then (open + high + low + close) / 4 else close;
script nz{
input x = close;
input y = 0;
plot result = if isnan(x) then y else x;
}
#xATRTrailingStop = 0.0
def xATRTrailingStop =compoundValue(1, if(src > nz(xATRTrailingStop[1], 0) and src[1] > nz(xATRTrailingStop[1], 0), max(nz(xATRTrailingStop[1]), src - nLoss),
if(src < nz(xATRTrailingStop[1], 0) and src[1] < nz(xATRTrailingStop[1], 0), min(nz(xATRTrailingStop[1]), src + nLoss),
if(src > nz(xATRTrailingStop[1], 0), src - nLoss, src + nLoss))),0);
#pos = 0
def pos = compoundValue(1, if(src[1] < nz(xATRTrailingStop[1], 0) and src > nz(xATRTrailingStop[1], 0), 1,
if(src[1] > nz(xATRTrailingStop[1], 0) and src < nz(xATRTrailingStop[1], 0), -1, nz(pos[1], 0))) , 0);
def ema = expaverage(src,1);
def above = crosses(ema, xATRTrailingStop, crossingDirection.ABOVE);
def below = crosses(xATRTrailingStop, ema, crossingDirection.ABOVE);
def buy = src > xATRTrailingStop and above ;
def sell = src < xATRTrailingStop and below;
def barbuy = src > xATRTrailingStop ;
def barsell = src < xATRTrailingStop ;
defineglobalColor("Green", color.Green);
defineglobalcolor("Red", color.Red);
addchartbubble(show_labels and buy, low, "B", globalColor("Green"), no);
addchartbubble(show_labels and sell, high, "S", globalColor("Red"), yes);
input price_color_on = yes;
assignPriceColor(if !price_color_on then color.current else if barbuy then globalColor("Green") else color.CURRENT);
assignpriceColor(if !price_color_on then color.current else if barsell then globalColor("Red") else color.currENT);
input alert_sound_on = no;
alert(buy, "UT Long", alert.bar,if alert_sound_on then sound.ring else sound.NoSound);
alert(sell, "UT Short", alert.bar,if alert_sound_on then sound.bell else sound.NoSound);
thank you for share it! really like it, can add the scan and a MTF? that will be great. thanks in advance!!I actually paid someone on Fiverr to convert UT Bot To TOS. Here's the code. Maybe you can use some of what he wrote. And yes I know he mis-spelled Value early in the code. Doesn't matter. The conversion seems accurate, and the signals are great. I had him shorten Buy and Sell to B and S to conserve screen space. Good luck.
Ruby:input Key_Vaule = 1.0; def a = key_vaule;# input(1, title = "Key Vaule. 'This changes the sensitivity'") input atr_period = 10; def c = atr_period; # input(10, title = "ATR Period") input Signals_from_Heikin_Ashi_Candles = no; def h = signals_from_Heikin_Ashi_Candles; # input(false, title = "Signals from Heikin Ashi Candles") input show_labels = yes; def xATR = atr(c); def nLoss = a * xATR; def src = if h then (open + high + low + close) / 4 else close; script nz{ input x = close; input y = 0; plot result = if isnan(x) then y else x; } #xATRTrailingStop = 0.0 def xATRTrailingStop =compoundValue(1, if(src > nz(xATRTrailingStop[1], 0) and src[1] > nz(xATRTrailingStop[1], 0), max(nz(xATRTrailingStop[1]), src - nLoss), if(src < nz(xATRTrailingStop[1], 0) and src[1] < nz(xATRTrailingStop[1], 0), min(nz(xATRTrailingStop[1]), src + nLoss), if(src > nz(xATRTrailingStop[1], 0), src - nLoss, src + nLoss))),0); #pos = 0 def pos = compoundValue(1, if(src[1] < nz(xATRTrailingStop[1], 0) and src > nz(xATRTrailingStop[1], 0), 1, if(src[1] > nz(xATRTrailingStop[1], 0) and src < nz(xATRTrailingStop[1], 0), -1, nz(pos[1], 0))) , 0); def ema = expaverage(src,1); def above = crosses(ema, xATRTrailingStop, crossingDirection.ABOVE); def below = crosses(xATRTrailingStop, ema, crossingDirection.ABOVE); def buy = src > xATRTrailingStop and above ; def sell = src < xATRTrailingStop and below; def barbuy = src > xATRTrailingStop ; def barsell = src < xATRTrailingStop ; defineglobalColor("Green", color.Green); defineglobalcolor("Red", color.Red); addchartbubble(show_labels and buy, low, "B", globalColor("Green"), no); addchartbubble(show_labels and sell, high, "S", globalColor("Red"), yes); input price_color_on = yes; assignPriceColor(if !price_color_on then color.current else if barbuy then globalColor("Green") else color.CURRENT); assignpriceColor(if !price_color_on then color.current else if barsell then globalColor("Red") else color.currENT); input alert_sound_on = no; alert(buy, "UT Long", alert.bar,if alert_sound_on then sound.ring else sound.NoSound); alert(sell, "UT Short", alert.bar,if alert_sound_on then sound.bell else sound.NoSound);
to all great coding here! it is possible to create a multi time frame labels for this indicator. i will like to see a label for a time frame : M-W-D_4H, thank you in advanceI actually paid someone on Fiverr to convert UT Bot To TOS. Here's the code. Maybe you can use some of what he wrote. And yes I know he mis-spelled Value early in the code. Doesn't matter. The conversion seems accurate, and the signals are great. I had him shorten Buy and Sell to B and S to conserve screen space. Good luck.
Ruby:input Key_Vaule = 1.0; def a = key_vaule;# input(1, title = "Key Vaule. 'This changes the sensitivity'") input atr_period = 10; def c = atr_period; # input(10, title = "ATR Period") input Signals_from_Heikin_Ashi_Candles = no; def h = signals_from_Heikin_Ashi_Candles; # input(false, title = "Signals from Heikin Ashi Candles") input show_labels = yes; def xATR = atr(c); def nLoss = a * xATR; def src = if h then (open + high + low + close) / 4 else close; script nz{ input x = close; input y = 0; plot result = if isnan(x) then y else x; } #xATRTrailingStop = 0.0 def xATRTrailingStop =compoundValue(1, if(src > nz(xATRTrailingStop[1], 0) and src[1] > nz(xATRTrailingStop[1], 0), max(nz(xATRTrailingStop[1]), src - nLoss), if(src < nz(xATRTrailingStop[1], 0) and src[1] < nz(xATRTrailingStop[1], 0), min(nz(xATRTrailingStop[1]), src + nLoss), if(src > nz(xATRTrailingStop[1], 0), src - nLoss, src + nLoss))),0); #pos = 0 def pos = compoundValue(1, if(src[1] < nz(xATRTrailingStop[1], 0) and src > nz(xATRTrailingStop[1], 0), 1, if(src[1] > nz(xATRTrailingStop[1], 0) and src < nz(xATRTrailingStop[1], 0), -1, nz(pos[1], 0))) , 0); def ema = expaverage(src,1); def above = crosses(ema, xATRTrailingStop, crossingDirection.ABOVE); def below = crosses(xATRTrailingStop, ema, crossingDirection.ABOVE); def buy = src > xATRTrailingStop and above ; def sell = src < xATRTrailingStop and below; def barbuy = src > xATRTrailingStop ; def barsell = src < xATRTrailingStop ; defineglobalColor("Green", color.Green); defineglobalcolor("Red", color.Red); addchartbubble(show_labels and buy, low, "B", globalColor("Green"), no); addchartbubble(show_labels and sell, high, "S", globalColor("Red"), yes); input price_color_on = yes; assignPriceColor(if !price_color_on then color.current else if barbuy then globalColor("Green") else color.CURRENT); assignpriceColor(if !price_color_on then color.current else if barsell then globalColor("Red") else color.currENT); input alert_sound_on = no; alert(buy, "UT Long", alert.bar,if alert_sound_on then sound.ring else sound.NoSound); alert(sell, "UT Short", alert.bar,if alert_sound_on then sound.bell else sound.NoSound);
For 5 min charts or less, I find the best setting to be key value of 2.0 and atr period of 4. I suggest trying it on the 5 min SPX and 5 min /ES charts. Then a 5 min SPX daily options chart. Usually the options chart buy signals will follow the signals on the SPX and /ES charts.@esvafromdc @ttsdmagic Thank you. The input parameter for the first post code is "keyvalue" of 3, and for the second post code, it is "key value" of 1. What is the ideal input configuration (key value and atrperiod) for the 1 or 2 min time frame, based on your experience?. Thank you
@ttsdmagic Thank you for posting this UT Bot Alerts study. Of the 200+ signal type studies that I posses, this one is by far the best! That was very kind of you to share a study that you paid to have converted.I actually paid someone to convert UT Bot To TOS. Here's the code. Maybe you can use some of what he wrote. And yes I know he mis-spelled Value early in the code. Doesn't matter. The conversion seems accurate, and the signals are great. I had him shorten Buy and Sell to B and S to conserve screen space. Good luck.
Ruby:input Key_Vaule = 1.0; def a = key_vaule;# input(1, title = "Key Vaule. 'This changes the sensitivity'") input atr_period = 10; def c = atr_period; # input(10, title = "ATR Period") input Signals_from_Heikin_Ashi_Candles = no; def h = signals_from_Heikin_Ashi_Candles; # input(false, title = "Signals from Heikin Ashi Candles") input show_labels = yes; def xATR = atr(c); def nLoss = a * xATR; def src = if h then (open + high + low + close) / 4 else close; script nz{ input x = close; input y = 0; plot result = if isnan(x) then y else x; } #xATRTrailingStop = 0.0 def xATRTrailingStop =compoundValue(1, if(src > nz(xATRTrailingStop[1], 0) and src[1] > nz(xATRTrailingStop[1], 0), max(nz(xATRTrailingStop[1]), src - nLoss), if(src < nz(xATRTrailingStop[1], 0) and src[1] < nz(xATRTrailingStop[1], 0), min(nz(xATRTrailingStop[1]), src + nLoss), if(src > nz(xATRTrailingStop[1], 0), src - nLoss, src + nLoss))),0); #pos = 0 def pos = compoundValue(1, if(src[1] < nz(xATRTrailingStop[1], 0) and src > nz(xATRTrailingStop[1], 0), 1, if(src[1] > nz(xATRTrailingStop[1], 0) and src < nz(xATRTrailingStop[1], 0), -1, nz(pos[1], 0))) , 0); def ema = expaverage(src,1); def above = crosses(ema, xATRTrailingStop, crossingDirection.ABOVE); def below = crosses(xATRTrailingStop, ema, crossingDirection.ABOVE); def buy = src > xATRTrailingStop and above ; def sell = src < xATRTrailingStop and below; def barbuy = src > xATRTrailingStop ; def barsell = src < xATRTrailingStop ; defineglobalColor("Green", color.Green); defineglobalcolor("Red", color.Red); addchartbubble(show_labels and buy, low, "B", globalColor("Green"), no); addchartbubble(show_labels and sell, high, "S", globalColor("Red"), yes); input price_color_on = yes; assignPriceColor(if !price_color_on then color.current else if barbuy then globalColor("Green") else color.CURRENT); assignpriceColor(if !price_color_on then color.current else if barsell then globalColor("Red") else color.currENT); input alert_sound_on = no; alert(buy, "UT Long", alert.bar,if alert_sound_on then sound.ring else sound.NoSound); alert(sell, "UT Short", alert.bar,if alert_sound_on then sound.bell else sound.NoSound);
On the 1 minute for /ES, I find that Key Value of 3.0 and ATR period of 2 works good for me.For 5 min charts or less, I find the best setting to be key value of 2.0 and atr period of 4. I suggest trying it on the 5 min SPX and 5 min /ES charts. Then a 5 min SPX daily options chart. Usually the options chart buy signals will follow the signals on the SPX and /ES charts.
input mobile_arrows_on = yes;
plot mobile_arrows_buy = if buy and mobile_arrows_on then 1 else 0;
mobile_arrows_buy.SetLineWeight(5);
mobile_arrows_buy.SetPaintingStrategy(PaintingStrategy.BOOLEAN_ARROW_UP);
mobile_arrows_buy.SetDefaultColor(Color.UPTICK);
plot mobile_arrows_sell = if sell and mobile_arrows_on then 1 else 0;
mobile_arrows_sell.SetLineWeight(5);
mobile_arrows_sell.SetPaintingStrategy(PaintingStrategy.BOOLEAN_ARROW_DOWN);
mobile_arrows_sell.SetDefaultColor(Color.DOWNTICK);
You may want to tweak the parameters for the time frames you use. If anyone can come up with a more accurate conversion, that would be great too.Comparing this UT Bot and one in TradingView I see minor differences. The one in TV is a bit more accurate. So far I can't spot what makes this difference? Can someone compare two codes?
# ATR Trailing Stop
# This script implements an ATR-based trailing stop with some additional features
# Input variables
input Key_Value = 1.0; # This changes the sensitivity of the stop loss
input atr_period = 5; # The period used for the ATR calculation
input Signals_from_Heikin_Ashi_Candles = yes; # Use Heikin-Ashi candles instead of regular candles
input show_labels = yes; # Show labels for buy and sell signals on the chart
# ATR calculation
def xATR = atr(atr_period);
# Loss calculation
# The nLoss variable represents the stop loss value
def nLoss = Key_Value * xATR;
# Heikin-Ashi calculation
def src = if Signals_from_Heikin_Ashi_Candles then (open + high + low + close) / 4 else close;
# nz function
# This function is used to ensure that the xATRTrailingStop variable
# does not contain any NaN values
script nz{
input x = close;
input y = 0;
plot result = if isnan(x) then y else x;
}
# xATRTrailingStop calculation
# This variable represents the current value of the trailing stop
def xATRTrailingStop =compoundValue(1,
# If the current src is greater than the previous xATRTrailingStop and the previous src is also greater than the previous xATRTrailingStop
if(src > nz(xATRTrailingStop[1], 0) and src[1] > nz(xATRTrailingStop[1], 0),
# Set the current xATRTrailingStop to the max of the previous xATRTrailingStop and the current src minus nLoss
max(nz(xATRTrailingStop[1]), src - nLoss),
# If the current src is less than the previous xATRTrailingStop and the previous src is also less than the previous xATRTrailingStop
if(src < nz(xATRTrailingStop[1], 0) and src[1] < nz(xATRTrailingStop[1], 0),
# Set the current xATRTrailingStop to the min of the previous xATRTrailingStop and the current src plus nLoss
min(nz(xATRTrailingStop[1]), src + nLoss),
# If the current src is greater than the previous xATRTrailingStop
if(src > nz(xATRTrailingStop[1], 0),
# Set the current xATRTrailingStop to the current src minus nLoss
src - nLoss,
# If the current src is less than the previous xATRTrailingStop
src + nLoss))),0);
# Position calculation
# This variable represents the current position (long = 1, short = -1, flat = 0)
def pos = compoundValue(1,
# If the previous src is less than the previous xATRTrailingStop and the current src is greater than the current xATRTrailingStop
if(src[1] < nz(xATRTrailingStop[1], 0) and src > nz(xATRTrailingStop[1], 0), 1,
# If the previous src is greater than the previous xATRTrailingStop and the current src is less than the current xATRTrailingStop
if(src[1] > nz(xATRTrailingStop[1], 0) and src < nz(xATRTrailingStop[1], 0), -1,
# Otherwise, use the previous position
nz(pos[1], 0))) , 0);
# EMA calculation
# This variable represents the Exponential Moving Average of the src variable
def ema = expaverage(src,1);
# Buy and sell signals
# These variables represent the buy and sell signals generated by the script
def above = crosses(ema, xATRTrailingStop, crossingDirection.ABOVE);
def below = crosses(xATRTrailingStop, ema, crossingDirection.ABOVE);
def buy = src > xATRTrailingStop and above ;
def sell = src < xATRTrailingStop and below;
def barbuy = src > xATRTrailingStop ;
def barsell = src < xATRTrailingStop ;
# Chart label colors
defineglobalColor("Green", color.Green);
defineglobalcolor("Red", color.Red);
# Chart labels for buy and sell signals
addchartbubble(show_labels and buy, low, "B", globalColor("Green"), no);
addchartbubble(show_labels and sell, high, "S", globalColor("Red"), yes);
# Bar coloring
input price_color_on = yes;
assignPriceColor(if !price_color_on then color.current else if barbuy then globalColor("Green") else color.CURRENT);
assignpriceColor(if !price_color_on then color.current else if barsell then globalColor("Red") else color.currENT);
# Alerts
input alert_sound_on = no;
alert(buy, "UT Long", alert.bar,if alert_sound_on then sound.ring else sound.NoSound);
alert(sell, "UT Short", alert.bar,if alert_sound_on then sound.bell else sound.NoSound);
It gives me an error of "Exactly one plot expected" when I want to save it as an scanner.I actually paid someone to convert UT Bot To TOS. Here's the code. Maybe you can use some of what he wrote. And yes I know he mis-spelled Value early in the code. Doesn't matter. The conversion seems accurate, and the signals are great. The original Tradingview code spells value that way. I had him shorten Buy and Sell to B and S to conserve screen space. Good luck.
Ruby:input Key_Vaule = 1.0; def a = key_vaule;# input(1, title = "Key Vaule. 'This changes the sensitivity'") input atr_period = 10; def c = atr_period; # input(10, title = "ATR Period") input Signals_from_Heikin_Ashi_Candles = no; def h = signals_from_Heikin_Ashi_Candles; # input(false, title = "Signals from Heikin Ashi Candles") input show_labels = yes; def xATR = atr(c); def nLoss = a * xATR; def src = if h then (open + high + low + close) / 4 else close; script nz{ input x = close; input y = 0; plot result = if isnan(x) then y else x; } #xATRTrailingStop = 0.0 def xATRTrailingStop =compoundValue(1, if(src > nz(xATRTrailingStop[1], 0) and src[1] > nz(xATRTrailingStop[1], 0), max(nz(xATRTrailingStop[1]), src - nLoss), if(src < nz(xATRTrailingStop[1], 0) and src[1] < nz(xATRTrailingStop[1], 0), min(nz(xATRTrailingStop[1]), src + nLoss), if(src > nz(xATRTrailingStop[1], 0), src - nLoss, src + nLoss))),0); #pos = 0 def pos = compoundValue(1, if(src[1] < nz(xATRTrailingStop[1], 0) and src > nz(xATRTrailingStop[1], 0), 1, if(src[1] > nz(xATRTrailingStop[1], 0) and src < nz(xATRTrailingStop[1], 0), -1, nz(pos[1], 0))) , 0); def ema = expaverage(src,1); def above = crosses(ema, xATRTrailingStop, crossingDirection.ABOVE); def below = crosses(xATRTrailingStop, ema, crossingDirection.ABOVE); def buy = src > xATRTrailingStop and above ; def sell = src < xATRTrailingStop and below; def barbuy = src > xATRTrailingStop ; def barsell = src < xATRTrailingStop ; defineglobalColor("Green", color.Green); defineglobalcolor("Red", color.Red); addchartbubble(show_labels and buy, low, "B", globalColor("Green"), no); addchartbubble(show_labels and sell, high, "S", globalColor("Red"), yes); input price_color_on = yes; assignPriceColor(if !price_color_on then color.current else if barbuy then globalColor("Green") else color.CURRENT); assignpriceColor(if !price_color_on then color.current else if barsell then globalColor("Red") else color.currENT); input alert_sound_on = no; alert(buy, "UT Long", alert.bar,if alert_sound_on then sound.ring else sound.NoSound); alert(sell, "UT Short", alert.bar,if alert_sound_on then sound.bell else sound.NoSound);
It gives me an error "Exactly one plot expected " when I want to use it to scan. Any idea?I actually paid someone to convert UT Bot To TOS. Here's the code. Maybe you can use some of what he wrote. And yes I know he mis-spelled Value early in the code. Doesn't matter. The conversion seems accurate, and the signals are great. The original Tradingview code spells value that way. I had him shorten Buy and Sell to B and S to conserve screen space. Good luck.
Ruby:input Key_Vaule = 1.0; def a = key_vaule;# input(1, title = "Key Vaule. 'This changes the sensitivity'") input atr_period = 10; def c = atr_period; # input(10, title = "ATR Period") input Signals_from_Heikin_Ashi_Candles = no; def h = signals_from_Heikin_Ashi_Candles; # input(false, title = "Signals from Heikin Ashi Candles") input show_labels = yes; def xATR = atr(c); def nLoss = a * xATR; def src = if h then (open + high + low + close) / 4 else close; script nz{ input x = close; input y = 0; plot result = if isnan(x) then y else x; } #xATRTrailingStop = 0.0 def xATRTrailingStop =compoundValue(1, if(src > nz(xATRTrailingStop[1], 0) and src[1] > nz(xATRTrailingStop[1], 0), max(nz(xATRTrailingStop[1]), src - nLoss), if(src < nz(xATRTrailingStop[1], 0) and src[1] < nz(xATRTrailingStop[1], 0), min(nz(xATRTrailingStop[1]), src + nLoss), if(src > nz(xATRTrailingStop[1], 0), src - nLoss, src + nLoss))),0); #pos = 0 def pos = compoundValue(1, if(src[1] < nz(xATRTrailingStop[1], 0) and src > nz(xATRTrailingStop[1], 0), 1, if(src[1] > nz(xATRTrailingStop[1], 0) and src < nz(xATRTrailingStop[1], 0), -1, nz(pos[1], 0))) , 0); def ema = expaverage(src,1); def above = crosses(ema, xATRTrailingStop, crossingDirection.ABOVE); def below = crosses(xATRTrailingStop, ema, crossingDirection.ABOVE); def buy = src > xATRTrailingStop and above ; def sell = src < xATRTrailingStop and below; def barbuy = src > xATRTrailingStop ; def barsell = src < xATRTrailingStop ; defineglobalColor("Green", color.Green); defineglobalcolor("Red", color.Red); addchartbubble(show_labels and buy, low, "B", globalColor("Green"), no); addchartbubble(show_labels and sell, high, "S", globalColor("Red"), yes); input price_color_on = yes; assignPriceColor(if !price_color_on then color.current else if barbuy then globalColor("Green") else color.CURRENT); assignpriceColor(if !price_color_on then color.current else if barsell then globalColor("Red") else color.currENT); input alert_sound_on = no; alert(buy, "UT Long", alert.bar,if alert_sound_on then sound.ring else sound.NoSound); alert(sell, "UT Short", alert.bar,if alert_sound_on then sound.bell else sound.NoSound);
Does this Repaint?I actually paid someone to convert UT Bot To TOS. Here's the code. Maybe you can use some of what he wrote. And yes I know he mis-spelled Value early in the code. Doesn't matter. The conversion seems accurate, and the signals are great. The original Tradingview code spells value that way. I had him shorten Buy and Sell to B and S to conserve screen space. Good luck.
Ruby:input Key_Vaule = 1.0; def a = key_vaule;# input(1, title = "Key Vaule. 'This changes the sensitivity'") input atr_period = 10; def c = atr_period; # input(10, title = "ATR Period") input Signals_from_Heikin_Ashi_Candles = no; def h = signals_from_Heikin_Ashi_Candles; # input(false, title = "Signals from Heikin Ashi Candles") input show_labels = yes; def xATR = atr(c); def nLoss = a * xATR; def src = if h then (open + high + low + close) / 4 else close; script nz{ input x = close; input y = 0; plot result = if isnan(x) then y else x; } #xATRTrailingStop = 0.0 def xATRTrailingStop =compoundValue(1, if(src > nz(xATRTrailingStop[1], 0) and src[1] > nz(xATRTrailingStop[1], 0), max(nz(xATRTrailingStop[1]), src - nLoss), if(src < nz(xATRTrailingStop[1], 0) and src[1] < nz(xATRTrailingStop[1], 0), min(nz(xATRTrailingStop[1]), src + nLoss), if(src > nz(xATRTrailingStop[1], 0), src - nLoss, src + nLoss))),0); #pos = 0 def pos = compoundValue(1, if(src[1] < nz(xATRTrailingStop[1], 0) and src > nz(xATRTrailingStop[1], 0), 1, if(src[1] > nz(xATRTrailingStop[1], 0) and src < nz(xATRTrailingStop[1], 0), -1, nz(pos[1], 0))) , 0); def ema = expaverage(src,1); def above = crosses(ema, xATRTrailingStop, crossingDirection.ABOVE); def below = crosses(xATRTrailingStop, ema, crossingDirection.ABOVE); def buy = src > xATRTrailingStop and above ; def sell = src < xATRTrailingStop and below; def barbuy = src > xATRTrailingStop ; def barsell = src < xATRTrailingStop ; defineglobalColor("Green", color.Green); defineglobalcolor("Red", color.Red); addchartbubble(show_labels and buy, low, "B", globalColor("Green"), no); addchartbubble(show_labels and sell, high, "S", globalColor("Red"), yes); input price_color_on = yes; assignPriceColor(if !price_color_on then color.current else if barbuy then globalColor("Green") else color.CURRENT); assignpriceColor(if !price_color_on then color.current else if barsell then globalColor("Red") else color.currENT); input alert_sound_on = no; alert(buy, "UT Long", alert.bar,if alert_sound_on then sound.ring else sound.NoSound); alert(sell, "UT Short", alert.bar,if alert_sound_on then sound.bell else sound.NoSound);
Yes, it does. For my style of trading, the key to using any study that repaints is to also use several other studies that do not repaint. So if I have five non repainting studies on my chart (both of the moving average and histogram type). And all are in a bullish mode denoted by their color. When the UT Bot starts to show green, that is a valid buy signal.is that UT bot a repainting indicator?
mod note:
The indicator that is the subject of this thread is NOT A REPAINTING INDICATOR. There is no zigzag in this code.
This is an ATR Trailing Stop script written for use with Heiken Ashi candles
read more: https://usethinkscript.com/threads/ut-bot-for-thinkorswim.12640/page-2#post-118044
I think this comment is incorrect. If this is a true conversion from Tradingview, it is NOT a repainting indicator. It may repaint while the candle is forming but once the candle is formed, it does not repaint.Yes, it does. For my style of trading, the key to using any study that repaints is to also use several other studies that do not repaint. So if I have five non repainting studies on my chart (both of the moving average and histogram type). And all are in a bullish mode denoted by their color. When the UT Bot starts to show green, that is a valid buy signal.
Thread starter | Similar threads | Forum | Replies | Date |
---|---|---|---|---|
S | TV Community Algo for ThinkOrSwim | Custom | 2 | |
S | Daily Moving Average with Percentage Diff Label For ThinkOrSwim | Custom | 0 | |
S | [blackcat] L2 Super Oscillator for ThinkOrSwim | Custom | 1 | |
![]() |
Maximum Pain Indicator For ThinkOrSwim | Custom | 0 | |
S | Drip's 11am rule breakout/breakdown For ThinkOrSwim | Custom | 4 |
Start a new thread and receive assistance from our community.
useThinkScript is the #1 community of stock market investors using indicators and other tools to power their trading strategies. Traders of all skill levels use our forums to learn about scripting and indicators, help each other, and discover new ways to gain an edge in the markets.
We get it. Our forum can be intimidating, if not overwhelming. With thousands of topics, tens of thousands of posts, our community has created an incredibly deep knowledge base for stock traders. No one can ever exhaust every resource provided on our site.
If you are new, or just looking for guidance, here are some helpful links to get you started.