Volume Percent Breakout Indicator (with scan) for ThinkorSwim

Townsend

Active member
VIP
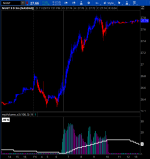
This is a volume indicator has two Input values, where the longer length is compared to the shorter length.
  • long length: the overall length to look back.
  • short length: the most forward length to be compared to the longer length.
What makes this indicator especially useful is how the short length, is excluded from the long length length. Notice there is a label, in white, displaying the percentage difference between the long length and the short length. In this particular case, during this Friday's close it shows the volume in the most recent 5 bars has fallen off 99% from the most recent 100 bars. Note: this is not the actual percent by a shortened derived percent, for ease of viewing.

That percent value is a hidden plot called vol_pct, which can be easily used in a Scan to find volume breakouts on any time frame. Use this vol_pct plot to create a custom column on your Scan Results list. Then when you do a Scan, for example: stocks that have had a 200% volume increase in the past 15 minutes, the vol_pct column on your Scan Results will match the white label Percent Value, displayed on your chart. If your results don't match, let me know.

PS: If you have two monitors, rather than saving the entire Scan Results to a Watchlist, you might find it easier to drag and drop potential breakouts from the Scan Results list to a chart on your 2nd monitor. Also, the potential breakouts that you want to keep an eye on, can also be easily dragged and dropped into any existing Watchlist. The one with the Gadgets that pops out from the left hand size of the screen.

IzcEjMU.png


Code:
## Paul Townsend, 2019

declare lower;

input LongLenth = 100;
input shortLength = 5;

def lookBackVolume = average(volume[shortLength] /10000,LongLenth);
def recentVolume = average(volume /10000,shortLength);

plot lookback_Length = roundup(lookBackVolume,0);
lookback_Length.AssignValueColor(Color.white);
lookback_Length.SetLineWeight(3);

plot recent_percent_length = roundup(recentVolume,0);
recent_percent_length.AssignValueColor(Color.green);
recent_percent_length.AssignValueColor(if recentVolume > recentVolume[1] then Color.cyan else Color.magenta );
recent_percent_length.SetPaintingStrategy(PaintingStrategy.HISTOGRAM);
recent_percent_length.SetLineWeight(2);

def volpct = round((recentVolume - lookBackVolume) / lookBackVolume * 100,0);
plot vol_pct = volpct;
vol_pct.hide();
addlabel(yes, volpct + " %",color.white);
 

Attachments

  • IzcEjMU.png
    IzcEjMU.png
    94.1 KB · Views: 159
Last edited by a moderator:

Join useThinkScript to post your question to a community of 21,000+ developers and traders.

Note: In the original code above the input Value longLength was misspelled as longLenth.
For simplicity sake, I'm leaving the misspelling in for now.


1- Place you mouse over one of the column names on the Scan Search Results list.
2- Right click and select Customize.
3- On the left hand size, under Lookup a column... choose Custom Quotes.
4- Choose one that isn't being used. Click on the little scroll icon, (to the left of the name), to edit.
5- You'll probably need to click on the Delete button to get rid of the existing scan formula.
6- You'll notice two tabs at the top. Funny thing about the Custom Wizard tab, (if you go that way), it only allows you to choose one Input parameter. For now you can ignore that tab. Click on the thinkScript Editor tab and paste in this code:
Code:
def look = myVolume_v2("longLenth" = 100, "shortLength" = 5)."vol_pct";
plot looking = look;
looking.AssignValueColor(if look > look[1] then Color.GREEN else Color.RED);
Notice my Volume Percent Breakout indicator is called, myVolume_v2. You need to rename your indicator OR change the name here, myVolume_v2 to the name you used when you originally set up this Percent Breakout indicator.

7- Before clicking on the OK button, go to the top of the screen and enter a column name and a time from. If for instance, I am using a 15 minute time from, so I use the name vPct_15m. You can use any name you want. But if you set up more than one of these, it's best to include the time frame in the heading name.
8- Finally, the last thing is to click on the OK button. This will take you back to your list of Custom Indicators. The name you used, won't show up immediately. (TOS bug.) Just move your cursor to another line and back again, and it will show up fine.
9- Lastly add the newly setup column to your Current Set and press OK.

Oh... if you need to change the parameters any time, (100 & 5), and go to edit the Script, you'll find TOS has added all the code from the original indicator. You can change the parameters at the very bottom of that edit window. Say, change 100 to 150 might be good.

That should do it! If you see anything that needs to be changed or updated in these step by step directions, let me know and I'll do an edit.
 
@Townsend thanks for sharing, it's always good to see a different way to work with volume. And, welcome to useThinkScript!
 
@Townsend, many thanks for your indicator script. I was delighted to discover and implement it today.
The scanner script, however, is not displaying the same numbers as the chart, and I wonder if there is a bug in the script or in my implementation (I cut and pasted your script and changed only the indicator name). Thank you!!

@Townsend, issue resolved. Thanks again for the code!
 
@tomsk I seen your volume color code
which is good.
can we add more thing in them.

like if volume will increase suddenly 3x or certain qty like more then avg it will send alert on screen.
because always when stock breakout at that time volume will increase also
can we do volume label on that breakout volume bar with qty so we know
how much qty MM applying to lift the stock.
Perhaps you can modify post#1 to your needs
 

Not the exact question you're looking for?

Start a new thread and receive assistance from our community.

87k+ Posts
450 Online
Create Post

The Market Trading Game Changer

Join 2,500+ subscribers inside the useThinkScript VIP Membership Club
  • Exclusive indicators
  • Proven strategies & setups
  • Private Discord community
  • ‘Buy The Dip’ signal alerts
  • Exclusive members-only content
  • Add-ons and resources
  • 1 full year of unlimited support

Frequently Asked Questions

What is useThinkScript?

useThinkScript is the #1 community of stock market investors using indicators and other tools to power their trading strategies. Traders of all skill levels use our forums to learn about scripting and indicators, help each other, and discover new ways to gain an edge in the markets.

How do I get started?

We get it. Our forum can be intimidating, if not overwhelming. With thousands of topics, tens of thousands of posts, our community has created an incredibly deep knowledge base for stock traders. No one can ever exhaust every resource provided on our site.

If you are new, or just looking for guidance, here are some helpful links to get you started.

What are the benefits of VIP Membership?
VIP members get exclusive access to these proven and tested premium indicators: Buy the Dip, Advanced Market Moves 2.0, Take Profit, and Volatility Trading Range. In addition, VIP members get access to over 50 VIP-only custom indicators, add-ons, and strategies, private VIP-only forums, private Discord channel to discuss trades and strategies in real-time, customer support, trade alerts, and much more. Learn all about VIP membership here.
How can I access the premium indicators?
To access the premium indicators, which are plug and play ready, sign up for VIP membership here.
Back
Top