Volume Forecast (VF) Indicator for ThinkorSwim

Status
Not open for further replies.

zeek

Active member
2019 Donor
Curious to know if anyone here have a Volume Forecast indicator for stocks? I know there are some traders that have this tool and I contacted one of them to ask if he could share but unfortunately he did not want to. From what I have seen, the forecast works extremely well and can be very useful to spot demand/supply imbalances. If anyone here could code something like this, I would be very interested in it.

The image below comes from Twitter and from this trader @team3dstocks

YLoTH2L.png


Update #1: @XeoNoX built his own version of the Volume Forecast indicator here: https://usethinkscript.com/threads/...ator-for-stocks-in-thinkorswim.307/post-48137
 

Attachments

  • YLoTH2L.png
    YLoTH2L.png
    9.9 KB · Views: 160

Join useThinkScript to post your question to a community of 21,000+ developers and traders.

We will figure it on this forum, many smart people on here. It's probably posted on github or a website anyway. If we can't find it, we will create a better one.

Here something I found on the tube


Link to script: https://usethinkscript.com/threads/custom-thinkscript-volume-stats-for-thinkorswim.970/

Forecast PreMarket Volume

Code:
# PreMarketForecast Volume
# TOS
def LabelTime = if SecondsFromTime(0800) > 0 and
                   SecondsTillTime(1000) >= 0
                then 1
                else 0;
def isRollover = GetYYYYMMDD() != GetYYYYMMDD()[1];
def beforeStart = GetTime() < RegularTradingStart(GetYYYYMMDD());
def vol = if isRollover and beforeStart then volume else if beforeStart then vol[1] + volume else Double.NaN;
def PreMarketVol = if IsNaN(vol) then PreMarketVol[1] else vol;
AddLabel(LabelTime, "PreMarket Volume = " + PreMarketVol, Color.WHITE);
 
Sad when something as simple as a label can't be shared without a good reason. If they bought it, that's different.

How to find a comparable:
  1. Try this: https://usethinkscript.com/threads/yesterdays-volume-vs-todays-volume-at-same-time-indicator.317/
  2. Use the search box above.
  3. Go to the Universe of Thinkscript in the Tutorials on our site. There's more there than can be read in a week. When you open the onedrive link, look for a tab that says 02. Education Scripts and StanL Snippets (200 pages of indexed goodies). Then go to Tab 14, JQs Workshop. From there the 3rd tab will be 'Other Onenote. Inside are 2 excellent resources. The first one will have labels galore, Duncan's Onenote.
 
That script by Enigma is also good but unfortunately does not show forecasting of volume.

This trader also has a VF tool and he hints in one of his tweets on what to look for when building a forecast tool. The blogpost he mention is this one by EpicaCapital talking about relative strength & weakness for intraday trading https://www.siliconinvestor.com/readmsg.aspx?msgid=29390810
The first step is to figure out the formula used to do the forecasting. Once we know this, coding the tool should be fairly easy is my guess.

IBIPWwR.jpg
 

Attachments

  • IBIPWwR.jpg
    IBIPWwR.jpg
    328.6 KB · Views: 255
Last edited by a moderator:
@zeek my almost 40 years of trading says this one sounds fishy. Markets are Fractal but intraday is random, flip a coin. The successful day traders I know put risk management first. Then for the day, they have a system to capture Alpha. IMO.
 
As a baseline, I propose a naïve strategy that uses the in-trade volume information. This strategy simply sums the n prior volume intervals of the current day interval, where n is the number of total intervals of a day. As an example, in the beginning of a day, the strategy sums all intraday volume intervals of the previous day. In the end of the day, the strategy uses all the intraday information of that day. The idea behind this strategy is that the previous volume of the day is a good estimative to the volume of the next day. Moreover, this strategy reduces the volume estimative error during the day
 
OK here is a 30 min chart of Point of control with 80% value area. You can see if 80 % rule might work with this interpretation.

7JNhgHf.png
 

Attachments

  • 7JNhgHf.png
    7JNhgHf.png
    80.1 KB · Views: 144
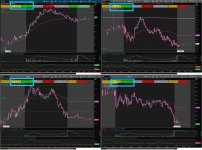
Here`s two examples of how Volume Forecasting can be of great use when thinking about shorting over extended stocks. The VF images are borrowed from user Team3dStocks twitter page.
In example 1, symbol MBIO traded about 38 million shares on april 18th 2019 and as you can see, the volume forecast was very close to the actual end of day volume.
In example 2, symbol MBRX on april 22nd had a volume forecast of 19,6 million shares and the end of day volume was over 4 times of that.

So basically, as soon as the traded volume exceeds the forecasted volume early in the day, its a good sign to stay away from shorting because of the imbalance between demand/supply. Vice versa, when the traded volume doesn't even come close to exceed the forecasted volume, its very likely to fade and can be a good short opp as can be seen in the charts.

Example 1

Example 2
 
Let me understand this, you want volume to tell you if it's ok to jump onto or off of a Wide Spread Penny Stock??? Good luck with that strategy. I don't understand it, maybe someone else does.
 
@markos I have been trading small caps for many years now and don't see the problem with it. I trade big caps too but sometimes the small caps offer good opportunities so I like to take advantage of that. The VF tool will of course work for all type of stocks so its not exclusively for small caps.
 
How is this possible? My guess it is the VF is just an average of previous volume. If it was an actual forecast the events zeek described prove there is no such thing as a volume forecast, at least not a accurate one(VF 19m Vol 82M). So why not just look at stock with high or low volume for the day, would that not give the same information as comparing volume to some nebulous VF.
 
@horserider So 37,5mil VF vs 37,3mil actual is not accurate enough? The VF is very accurate from what I have seen and its quite fascinating actually how close it gets when they correspond. The whole reason for the 19 vs 82 is that there was a ton more of demand which the chart clearly shows. Shorts got murdered on this particular day.
 
@zeek if that works for you, then that is ok. Just out of the mainstream of my, and apparently, @horserider 's trading accumen. What was the short interest on the stock? Thanks.
 
Any luck @zeek? I been testing out my own, but nothing close to team3stocks...his is so accurate...was wondering if you found anything revealing in any way? looking forward to sharing ideas.
 
No sorry @mwalstea, no luck yet but i am still researching this topic because it`s very interesting. I was in contact with another trader who has the VF and he was considering to maybe sell it but looks like he will not so my only hope now is that someone can figure out the formula needed and then code it.

I did came across this interesting blog post the other day about how to create a VF model and there are some basic starting guidelines in there. This blog post belongs to another trader i found on twitter who also has a VF tool. https://inthemoneyadds.com/how-to-create-volume-forecast-model-backed-by-data/
 
Yeah I saw that too, I've been researching it a lot as well, and am making some discoveries. But I genuinely have no idea how before the market even opens team3stocks gets a total day forecast. But the interval volume analysis helps, have you looked into that?
 
@zeek

I would question everything and everybody you see on twitter with regards to trading. Most of those folks are in cahoots with each other and will promote the same penny stocks through various accounts each with their own secret strategy. For example in the image you posted for the stated traded account. There is no such thing as Volume Forecast, he is just taking simple math and renaming as if it's some new volume indicator.

For example, in the stock in the image show, MBRX, this guy's magical indicator shows the below numbers:

VF: 19,677,066
Volume so Far: 82,891,156
% of VF: 421

Plug the above numbers in the calculator and you get:

VF / Volume so Far = % of VF
82,891,156 / 19,677,066 = 4.21

Now, he posted the chart at the end of the day at 5:15 pm after the market closed showing how his "secret" Volume Forecast indicator forecasted the end of the day volume to be at 421 percent.


Now, let's get down and get in the weeds. All he is doing is taking a commonly shared Volume Stats indicator which is shared on this forum and various other locations, renaming the labels, removing some of the other labels and touting is as some new "Volume Forecast" indicator.

Below is one of the threads on this forum where this indicator is shared.

Volume Stats Indicator: https://usethinkscript.com/threads/custom-thinkscript-volume-stats-for-thinkorswim.970/

How is he trying to dupe new investors?

He is posting the charts at the end of the day and showing how his indicator forecasted the volume to be to the exact percentage of volume traded for the day. Genius, right? :rolleyes:

Let's check the labels on his indicator. So the label on his indicator VF is nothing more than the average for the last 20 or 30 days.

The Volume so Far label is nothing more than the volume traded for the day. The % of VF is nothing much more than these two numbers divided to arrive at a percentage of volume traded so far for that day.

Posting the chart at the end of the day makes him seem like a genius because he supposedly he "forecasted" the volume to be at the level and with the right chart showing a parabolic move upwards make him seem like his indicator is the next big thing.

The reality is, he didn't forecast anything. He just took the volume traded today vs the average traded for the last 30 days (or whatever other time period he has) and divided these up to arrive at the percentage.

There is no way me and you can forecast tomorrow's volume unless you're part of a dark pool or insider trader. With the indicators shared on this forum, you can create your own strategy that will blow these fake hucksters from twitter out of the water. Be cautious and don't get duped by them.
 
Last edited by a moderator:
Hi guys, my name is Niv, I'm the one behind the post mentioned above https://inthemoneyadds.com/how-to-create-volume-forecast-model-backed-by-data/

First, team3dstocks is not "so accurate" as mwalstea said above. The goal is not to predict EOD volume accurately. The goal is to see how those predictions change throughout the day. That's why jox51 mistakingly judge team3dstocks in my opinion. He takes every opportunity to say that days he got the volume 100% predicted upfront are just fun to see, real edge is when you are actually wrong with the prediction. He also doesn't sell or promote anything, so I think its unfair to critic his honesty.

Regarding the indicator itself, the post I wrote should help you create VF model exactly like the one I use. The bottom line is that after creating it, my accuracy in one of my strategies (late day fade of micro cap stocks 1st day) went up from 41% with 1:2 RR to 52% with 1:2.55 RR, and I'm sure there are many more strategies that can gain some extra edge with VF.

Happy trading ;)
 
@jox51 I agree with the first bold highlight about always question everything what is said on platforms like twitter for example with regards to trading. But in this particular case, i think you are very wrong because this user shares a lot of good ideas almost daily. Not just buy/sell ideas but mostly about trading in general and what to look out for and how to stay disciplined. I have actually learned quite a lot from his tweets over the years and he is not selling anything like many other gurus and furus. He simply shares his ideas about trading and i know many appreciate them so when you call him a fake hukster, i think you are unfair but i respect your opinion.

Regarding the last bold highlight about forecasting. Yes, if you look at those pics i posted earlier it may seem like it was all in hindsight and i can see why you think there is no way to forecast the volume but trust me, i`ve seen how this tool works many times and if you had read all of team3dstocks tweets you would also know that he has posted several times early in the day about the traded volume exceeding the VF so it`s not just hindsight posting after the close like you are trying to insinuate.
 
Status
Not open for further replies.

Not the exact question you're looking for?

Start a new thread and receive assistance from our community.

87k+ Posts
291 Online
Create Post

The Market Trading Game Changer

Join 2,500+ subscribers inside the useThinkScript VIP Membership Club
  • Exclusive indicators
  • Proven strategies & setups
  • Private Discord community
  • ‘Buy The Dip’ signal alerts
  • Exclusive members-only content
  • Add-ons and resources
  • 1 full year of unlimited support

Frequently Asked Questions

What is useThinkScript?

useThinkScript is the #1 community of stock market investors using indicators and other tools to power their trading strategies. Traders of all skill levels use our forums to learn about scripting and indicators, help each other, and discover new ways to gain an edge in the markets.

How do I get started?

We get it. Our forum can be intimidating, if not overwhelming. With thousands of topics, tens of thousands of posts, our community has created an incredibly deep knowledge base for stock traders. No one can ever exhaust every resource provided on our site.

If you are new, or just looking for guidance, here are some helpful links to get you started.

What are the benefits of VIP Membership?
VIP members get exclusive access to these proven and tested premium indicators: Buy the Dip, Advanced Market Moves 2.0, Take Profit, and Volatility Trading Range. In addition, VIP members get access to over 50 VIP-only custom indicators, add-ons, and strategies, private VIP-only forums, private Discord channel to discuss trades and strategies in real-time, customer support, trade alerts, and much more. Learn all about VIP membership here.
How can I access the premium indicators?
To access the premium indicators, which are plug and play ready, sign up for VIP membership here.
Back
Top