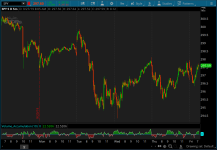
Volume Accumulation Percentage Indicator for ThinkorSwim

BenTen

Administrative
Staff member
Staff
VIP
Lifetime
Volume Accumulation Percentage Indicator (VAPI) is a variation of the classic volume-accumulation indicators. It uses volume the same way as OBV except that it assigns volume weights based on intraday volatility.

In a positive trend, if the stock price is close to a (local) new high, the VAPI should be at its maximum as well (and vice versa for a negative trend).

If the market is looking for a direction, if the price is in the bottom side of his current trading range and if, at the same moment the VAPI osc slopes up, there is accumulation on the stock and that the prices should start to climb.

The SELL signal is given when the VAPI decreases (distribution). Divergences are usually very effective too.

Tuning the "length" parameter may be needed for your instrument (default is 10), do let me know if you find a different value to be optimal for majority of instruments.

E0K596o.png

This indicator was converted from TradingView.

thinkScript Code

Code:
# Volume Accumulation Percentage Indicator [LazyBear]
# Assembled by BenTen at useThinkScript.com
# Converted from https://www.tradingview.com/script/kVk6pN9z-Volume-Accumulation-Percentage-Indicator-LazyBear/

declare lower;

input length = 10;
def x = (2 * close - high - low) / (high - low);
def tva = sum(volume * x, length);
def tv = sum(volume, length);
def va = 100 * tva / tv;
plot ZeroLine = 0;
plot histogram = va;
plot line = va;

histogram.SetPaintingStrategy(PaintingStrategy.HISTOGRAM);
histogram.assignValueColor(if va > 0 then Color.green else Color.red);
 

Attachments

  • E0K596o.png
    E0K596o.png
    103.8 KB · Views: 561
Last edited by a moderator:
This uses 2x the closing price. Chaikin Money Flow uses close-low, otherwise this is about the same.
 
@horserider You would have to make that decision for yourself. If OBV is working for you I don't see any reason to use this.
 
OBV, Chaikin, Twiggs, ..all types of money flow indicators are out there. What Speaks to one trader and there individual style is up to them.
What BenTen is sharing for this community is giving them a choice that they might not know of. just my 2 cents.
 
From my experience testing OBV, Chaikin, MFI. And imho the best volume flow oscillator for daily+ timeframe is FVE (finite volume element).

But what I really use is just relative volume on every bar and the price action. Volume oscillators works very similar to price oscillators and share same issues- they are great for confirmation, but by themselves produce A LOT of false signals. Cannot be used as primary signal imho
 
Last edited by a moderator:
Looking for the Tradingview Volume Accumulation Percentage Indicator converted to ToS
 
Last edited by a moderator:
Since there was a signal line I thought we would use it - labels and entry/exits..
pY8Loff.png


shared study link: https://tos.mx/!rcwTAhMt MUST follow these instructions for loading shared links.
Code:
declare lower;

# Inputs
input length = 5; # Period for VAP calculation
input signalLength = 3; # Period for signal line smoothing
input overboughtLevel = 20; # Reduced overbought threshold
input oversoldLevel = -20; # Reduced oversold threshold
input minDivergenceBars = 3; # Reduced minimum bars between divergence signals
input tmoSlopeLength = 3; # Period for TmoSlope smoothing

# Define BarNumber
def bn = BarNumber();

# Volume Accumulation Percentage Calculation
def x = (2 * close - high - low) / (high - low);
def tva = sum(volume * x, length);
def tv = sum(volume, length);
def va = if tv != 0 and high != low then 100 * tva / tv else 0; # Avoid division by zero or flat prices

# Signal Line (smoothed VAP)
def signal = Average(va, signalLength);

# Zero Line
plot ZeroLine = 0;

# Plots
plot histogram = va; # Raw VAP as histogram
plot line = va; # Line overlay for clarity
plot SignalLine = signal;
def rawTmoSlope = if bn > 1 then (va - va[1]) else 0;
plot TmoSlope = Average(rawTmoSlope, tmoSlopeLength); # Smoothed TmoSlope as thermal line

histogram.SetPaintingStrategy(PaintingStrategy.HISTOGRAM);
histogram.assignValueColor(if va > 0 then Color.GREEN else Color.RED);
line.SetDefaultColor(Color.YELLOW);
SignalLine.SetDefaultColor(Color.BLUE);
TmoSlope.SetPaintingStrategy(PaintingStrategy.LINE);
TmoSlope.AssignValueColor(if TmoSlope > 0 then CreateColor(0, 255 - (255 * Min(1, AbsValue(TmoSlope) / 0.2)), 0) else if TmoSlope < 0 then CreateColor(255 - (255 * Min(1, AbsValue(TmoSlope) / 0.2)), 0, 0) else Color.GRAY);

# Divergence Detection
def priceHigh = high > Highest(high[1], length);
def priceLow = low < Lowest(low[1], length);
def vaHigherHigh = va > Highest(va[1], length);
def vaLowerLow = va < Lowest(va[1], length);

# Divergence conditions
def bullishDivergence = priceLow and vaLowerLow[1] and va > va[1];
def bearishDivergence = priceHigh and vaHigherHigh[1] and va < va[1];

# Track last divergence bar to enforce spacing
rec lastDivergenceBar = if bullishDivergence or bearishDivergence then bn else lastDivergenceBar[1];
def barsSinceLastDivergence = if IsNaN(lastDivergenceBar) then 0 else bn - lastDivergenceBar;
def bullishDivergenceSpaced = bullishDivergence and barsSinceLastDivergence >= minDivergenceBars;
def bearishDivergenceSpaced = bearishDivergence and barsSinceLastDivergence >= minDivergenceBars;

# Target Hit
def priorHigh = Highest(high, length)[1];
def priorLow = Lowest(low, length)[1];
def targetHit = if bullishDivergenceSpaced[1] then close >= priorHigh else if bearishDivergenceSpaced[1] then close <= priorLow else 0;

# Momentum Shift
def momentumShift = Crosses(va, signal, CrossingDirection.ANY);

# Overbought/Oversold
def overbought = va > overboughtLevel;
def oversold = va < oversoldLevel;

# Trend Score (0–5)
def tmoSlopeValue = TmoSlope; # Renamed to avoid conflict
def crossoverPresent = momentumShift;
def distanceFromSignal = AbsValue(va - signal);
def volumeTrend = if volume > volume[1] then 1 else 0;
def trendScore = (if tmoSlopeValue > 0 then 1 else 0) + (if crossoverPresent then 1 else 0) + (if distanceFromSignal > 0.5 then 1 else 0) + (if volumeTrend then 1 else 0) + (if va > 0 then 1 else 0);

# Trend Confirmation
def priceTrend = if close > close[1] then 1 else if close < close[1] then -1 else 0;
def vapTrend = if va > va[1] then 1 else if va < va[1] then -1 else 0;
def trendAlignment = if priceTrend == vapTrend and priceTrend != 0 then 1 else 0;

# New Signal
def newSignal = bullishDivergenceSpaced or bearishDivergenceSpaced;

# Zero Line Cross Arrows
def upCross = Crosses(SignalLine, ZeroLine, CrossingDirection.ABOVE);
def downCross = Crosses(SignalLine, ZeroLine, CrossingDirection.BELOW);
AddChartBubble(upCross, if !IsNaN(va) then va + (va * 0.1) else va, "UP", Color.GREEN, no);
AddChartBubble(downCross, if !IsNaN(va) then va - (va * 0.1) else va, "DN", Color.RED, yes);

# Labels
AddLabel(yes, "VAP: " + Round(va, 2), Color.WHITE); # Debug
AddLabel(yes, "Signal: " + Round(signal, 2), Color.WHITE); # Debug
AddLabel(yes, if bullishDivergenceSpaced then "Bullish Divergence" else "", Color.GREEN);
AddLabel(yes, if bearishDivergenceSpaced then "Bearish Divergence" else "", Color.RED);
AddLabel(yes, if targetHit then "Target Hit ✅" else "", Color.LIGHT_GREEN);
AddLabel(yes, if momentumShift then "Momentum Shift 🔄" else "", Color.YELLOW);
AddLabel(yes, if overbought then "Overbought" else if oversold then "Oversold" else "", if overbought then Color.MAGENTA else if oversold then Color.GRAY else Color.CURRENT);
AddLabel(yes, if newSignal then "New Signal 🔔" else "", Color.ORANGE);
AddLabel(yes, "Trend Score: " + trendScore, Color.CYAN);
AddLabel(yes, "Trend Alignment: " + (if trendAlignment then "Yes" else "No"), Color.LIGHT_GRAY);
 

Join useThinkScript to post your question to a community of 21,000+ developers and traders.

Similar threads

Not the exact question you're looking for?

Start a new thread and receive assistance from our community.

87k+ Posts
489 Online
Create Post

Similar threads

Similar threads

The Market Trading Game Changer

Join 2,500+ subscribers inside the useThinkScript VIP Membership Club
  • Exclusive indicators
  • Proven strategies & setups
  • Private Discord community
  • ‘Buy The Dip’ signal alerts
  • Exclusive members-only content
  • Add-ons and resources
  • 1 full year of unlimited support

Frequently Asked Questions

What is useThinkScript?

useThinkScript is the #1 community of stock market investors using indicators and other tools to power their trading strategies. Traders of all skill levels use our forums to learn about scripting and indicators, help each other, and discover new ways to gain an edge in the markets.

How do I get started?

We get it. Our forum can be intimidating, if not overwhelming. With thousands of topics, tens of thousands of posts, our community has created an incredibly deep knowledge base for stock traders. No one can ever exhaust every resource provided on our site.

If you are new, or just looking for guidance, here are some helpful links to get you started.

What are the benefits of VIP Membership?
VIP members get exclusive access to these proven and tested premium indicators: Buy the Dip, Advanced Market Moves 2.0, Take Profit, and Volatility Trading Range. In addition, VIP members get access to over 50 VIP-only custom indicators, add-ons, and strategies, private VIP-only forums, private Discord channel to discuss trades and strategies in real-time, customer support, trade alerts, and much more. Learn all about VIP membership here.
How can I access the premium indicators?
To access the premium indicators, which are plug and play ready, sign up for VIP membership here.
Back
Top