VIX Fear & Greed Mean Reversion Indicator for ThinkorSwim

BenTen

Administrative
Staff member
Staff
VIP
Lifetime
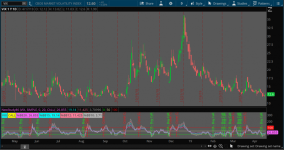
Similar to the previous Fear and Greed indicator, this one was designed for the $VIX. The strategy generate buy and sell signals in ThinkorSwim using Bollinger Bands, Percent B (%B), and a few other parameters.

Calls

  • go long VIX calls when %B(20,1.5) crosses > 0
  • cover VIX calls when %B(20,1.5) crosses > 100

Puts
  • go long VIX puts when %B(20,1.2) crosses < 100
  • cover VIX puts when %B(20,2) crosses < 0

FmW5Znl.png


VIX Fear and Greed Strategy

Rich (BB code):
#
# $VIX Fear & Greed Mean Reversion Study (VIX_FGMR)
#
# This script adapted from posts from @kerberos007
# https://twitter.com/kerberos007
#
# Want the latest version of this script?
# https://github.com/korygill/technical-analysis
#
# Use on thinkorswim and thinkscript
# author @korygill
#

script GetBollingerBandPercent
{
    input price = close;
    input upper = 2;
    input lower = -2;
    input averageType = AverageType.SIMPLE;
    input displace = 0;
    input length = 20;

    def upperBand = BollingerBands(price, displace, length, lower, upper, averageType).UpperBand;
    def lowerBand = BollingerBands(price, displace, length, lower, upper, averageType).LowerBand;

    plot BBPercent = (price - lowerBand) / (upperBand - lowerBand) * 100;
}

declare lower;

input sym = "VIX";
def price = close(sym);
input averageType = AverageType.SIMPLE;
input displace = 0;
input length = 20;
input signalType = {default CALL, PUT};

plot PB20 = GetBollingerBandPercent(price, 2.0, -2.0);
plot PB15 = GetBollingerBandPercent(price, 1.5, -1.5);
plot PB12 = GetBollingerBandPercent(price, 1.2, -1.2);
plot PB10 = GetBollingerBandPercent(price, 1.0, -1.0);
#plot symPlot = price;

plot ZeroLine = 0;
plot HalfLine = 50;
plot UnitLine = 100;
ZeroLine.SetDefaultColor(Color.GREEN);
HalfLine.SetDefaultColor(GetColor(8));
UnitLine.SetDefaultColor(Color.RED);

def callput;
switch (signalType)
{
case CALL:
callput = 1;
default:
callput = 0;
}

# -----------------
AddVerticalLine(
  Crosses(PB20, ZeroLine, CrossingDirection.BELOW) and callput == 0,
  "--- (OS - Cover Puts) ---", Color.MAGENTA, curve.SHORT_DASH
);

AddVerticalLine(
  Crosses(PB12, UnitLine, CrossingDirection.BELOW) and callput == 0,
  "--- (OB - Buy Puts) ---", Color.YELLOW, curve.SHORT_DASH
);

# -----------------
AddVerticalLine(
  Crosses(PB15, ZeroLine, CrossingDirection.ABOVE) and callput == 1,
  "+++ OS - Buy Calls +++", Color.GREEN, curve.SHORT_DASH
);

AddVerticalLine(
  Crosses(PB15, UnitLine, CrossingDirection.ABOVE) and callput == 1,
  "+++ OB - Cover Calls +++", Color.RED, curve.SHORT_DASH
);

AddLabel(yes, sym, COLOR.CYAN);
AddLabel(yes, signalType, COLOR.YELLOW);
PB20.SetdefaultColor(GetColor(0));
PB15.SetdefaultColor(GetColor(1));
PB12.SetdefaultColor(GetColor(2));
PB10.SetdefaultColor(GetColor(3));
AddLabel(yes, "%BB20: "+PB20, GetColor(0));
AddLabel(yes, "%BB15: "+PB15, GetColor(1));
AddLabel(yes, "%BB12: "+PB12, GetColor(2));
AddLabel(yes, "%BB10: "+PB10, GetColor(3));

A strategy for this indicator is still under development. For now, you can follow the signals given by the lower study.

BNyiBUM.png


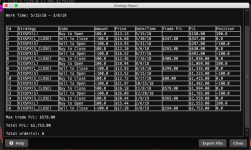
The above screenshot came from backtesting using the SPX Fear and Greed upper strategy on the VIX.

Credits:
 

Attachments

  • FmW5Znl.png
    FmW5Znl.png
    216 KB · Views: 145
  • BNyiBUM.png
    BNyiBUM.png
    295 KB · Views: 148
Last edited:
@Henk Create a new Strategy and plug this in:

Rich (BB code):
#
# $SPX Fear & Greed Mean Reversion Strategy (FGMR_Strat)
#
# This script adapted from posts from @kerberos007
# https://twitter.com/kerberos007
# 
# Want the latest version of this script?
# https://github.com/korygill/technical-analysis
#
# Use on thinkorswim and thinkscript
# author @korygill
#

script GetBollingerBandPercent
{
    input price = close;
    input upper = 2;
    input lower = -2;
    input averageType = AverageType.SIMPLE;
    input displace = 0;
    input length = 20;

    def upperBand = BollingerBands(price, displace, length, lower, upper, averageType).UpperBand;
    def lowerBand = BollingerBands(price, displace, length, lower, upper, averageType).LowerBand;

    plot BBPercent = (price - lowerBand) / (upperBand - lowerBand) * 100;
}

input averageType = AverageType.SIMPLE;
input price = close;
input displace = 0;
input length = 20;
input StdDev_DnBuy = -2.0;
input StdDev_UpBuy = 2.0;
input StdDev_DnSell = -1.0;
input StdDev_UpSell = 1.0;
input LongShortBoth = {Long, Short, default Both};

def PercentBBuy = GetBollingerBandPercent(price, StdDev_UpBuy, StdDev_DnBuy);

def PercentBSell = GetBollingerBandPercent(price, StdDev_UpSell, StdDev_DnSell);

def ZeroLine = 0;
def HalfLine = 50;
def UnitLine = 100;

def lsb;
switch (LongShortBoth)
{
    case Long: lsb = 0;
    case Short: lsb = 1;
    default: lsb = 2;
}

# LONG
AddOrder(OrderType.BUY_TO_OPEN, 
    Crosses(PercentBBuy, ZeroLine, CrossingDirection.ABOVE) and lsb != 1,
    tickColor = COLOR.WHITE, arrowColor = COLOR.GREEN
    );

AddOrder(OrderType.SELL_TO_CLOSE, 
    Crosses(PercentBSell, UnitLine, CrossingDirection.ABOVE) and lsb != 1,
    tickColor = COLOR.WHITE, arrowColor = COLOR.RED
    );

# SHORT
AddOrder(OrderType.SELL_TO_OPEN, 
    Crosses(PercentBBuy, UnitLine, CrossingDirection.BELOW) and lsb != 0,
    tickColor = COLOR.WHITE, arrowColor = COLOR.YELLOW
    );

AddOrder(OrderType.BUY_TO_CLOSE, 
    Crosses(PercentBSell, ZeroLine, CrossingDirection.BELOW) and lsb != 0,
    tickColor = COLOR.WHITE, arrowColor = COLOR.MAGENTA
    );

AddLabel(yes, "Go Long", COLOR.GREEN);
AddLabel(yes, "Cover Long", COLOR.RED);
AddLabel(yes, "Go Short", COLOR.YELLOW);
AddLabel(yes, "Cover Short", COLOR.MAGENTA);
 
Last edited:
@BenTen hey bro i have Volume forecast script , can you check it out i dont know it right or not . VF big cap and small cap are different .

VF is 1) Supply imbalance- If they're trying to dump 20M shares, but volume forecast is only 10M=not enough demand to absorb the supply. Those end up being the best faders

2) Avoiding squeezes- 90% of squeezers reach their 4pm VF very early in the day. So early warning to cover or long

As a baseline, i propose a naive strategy that uses the in-

traday volume information. This strategy simply sums the n prior volume intervals of the current day interval, where n is the number of total intervals of a day. As an example, in the beginning of a day, the strategy sums all intraday volume intervals of the previous day. In the end of the day, the strategy uses all the intraday information of that day. The idea behind this strategy is that the previous volume of the day is a good estimative to the volume of the next day. Moreover, this strategy reduces the volume estimative error during the day.

Rich (BB code):
declare upper;
def newDay = GetDay() <> GetDay()[1];
# vsf is Volume So Far
rec vsf = CompoundValue(1, if newDay then volume else vsf[1] + volume, 0);
# vf is Volume Forecast
rec vf = if newDay then vsf[1] else vf[1];
# pvf is Percent of Volume Forecast
def pvf = 100 * (vsf / vf);
plot data = close;
data.Hide();
data.HideTitle();
data.HideBubble();

#---------- Global Colors
DefineGlobalColor("vf", Color.YELLOW);
DefineGlobalColor("vsf", Color.GREEN);
DefineGlobalColor("pvf", Color.GRAY);

#---------- Chart Labels
AddLabel(vf, Concat("VF: ", vf), GlobalColor("vf"));
AddLabel(vsf, Concat("VSF: ", vsf), GlobalColor("vsf"));
AddLabel(pvf, Concat(Concat("PVF: ", Round(pvf, 1)), "%"), GlobalColor("pvf"));
 
Last edited by a moderator:
@Henk Create a new Strategy and plug this in:

Rich (BB code):
#
# $SPX Fear & Greed Mean Reversion Strategy (FGMR_Strat)
#
# This script adapted from posts from @kerberos007
# https://twitter.com/kerberos007
#
# Want the latest version of this script?
# https://github.com/korygill/technical-analysis
#
# Use on thinkorswim and thinkscript
# author @korygill
#

script GetBollingerBandPercent
{
    input price = close;
    input upper = 2;
    input lower = -2;
    input averageType = AverageType.SIMPLE;
    input displace = 0;
    input length = 20;

    def upperBand = BollingerBands(price, displace, length, lower, upper, averageType).UpperBand;
    def lowerBand = BollingerBands(price, displace, length, lower, upper, averageType).LowerBand;

    plot BBPercent = (price - lowerBand) / (upperBand - lowerBand) * 100;
}

input averageType = AverageType.SIMPLE;
input price = close;
input displace = 0;
input length = 20;
input StdDev_DnBuy = -2.0;
input StdDev_UpBuy = 2.0;
input StdDev_DnSell = -1.0;
input StdDev_UpSell = 1.0;
input LongShortBoth = {Long, Short, default Both};

def PercentBBuy = GetBollingerBandPercent(price, StdDev_UpBuy, StdDev_DnBuy);

def PercentBSell = GetBollingerBandPercent(price, StdDev_UpSell, StdDev_DnSell);

def ZeroLine = 0;
def HalfLine = 50;
def UnitLine = 100;

def lsb;
switch (LongShortBoth)
{
    case Long: lsb = 0;
    case Short: lsb = 1;
    default: lsb = 2;
}

# LONG
AddOrder(OrderType.BUY_TO_OPEN,
    Crosses(PercentBBuy, ZeroLine, CrossingDirection.ABOVE) and lsb != 1,
    tickColor = COLOR.WHITE, arrowColor = COLOR.GREEN
    );

AddOrder(OrderType.SELL_TO_CLOSE,
    Crosses(PercentBSell, UnitLine, CrossingDirection.ABOVE) and lsb != 1,
    tickColor = COLOR.WHITE, arrowColor = COLOR.RED
    );

# SHORT
AddOrder(OrderType.SELL_TO_OPEN,
    Crosses(PercentBBuy, UnitLine, CrossingDirection.BELOW) and lsb != 0,
    tickColor = COLOR.WHITE, arrowColor = COLOR.YELLOW
    );

AddOrder(OrderType.BUY_TO_CLOSE,
    Crosses(PercentBSell, ZeroLine, CrossingDirection.BELOW) and lsb != 0,
    tickColor = COLOR.WHITE, arrowColor = COLOR.MAGENTA
    );

AddLabel(yes, "Go Long", COLOR.GREEN);
AddLabel(yes, "Cover Long", COLOR.RED);
AddLabel(yes, "Go Short", COLOR.YELLOW);
AddLabel(yes, "Cover Short", COLOR.MAGENTA);
Hi @BenTen,
Thank you so much for your great contribution to help us improve our trading. It's greatly appreciated.
Is there a a way to show the current fear/greed value, on a TOS chart label, from the a website (example: https://www.cnn.com/markets/fear-and-greed)? This video shows details on this using Python to scrape data. It's interesting
("youtu.be/6r3Ecf8KkTI"). It would be powerful to combine this with the Breadth Thrust indicator to find major turning points. Thx again
 
Last edited by a moderator:

Join useThinkScript to post your question to a community of 21,000+ developers and traders.

Not the exact question you're looking for?

Start a new thread and receive assistance from our community.

87k+ Posts
585 Online
Create Post

The Market Trading Game Changer

Join 2,500+ subscribers inside the useThinkScript VIP Membership Club
  • Exclusive indicators
  • Proven strategies & setups
  • Private Discord community
  • ‘Buy The Dip’ signal alerts
  • Exclusive members-only content
  • Add-ons and resources
  • 1 full year of unlimited support

Frequently Asked Questions

What is useThinkScript?

useThinkScript is the #1 community of stock market investors using indicators and other tools to power their trading strategies. Traders of all skill levels use our forums to learn about scripting and indicators, help each other, and discover new ways to gain an edge in the markets.

How do I get started?

We get it. Our forum can be intimidating, if not overwhelming. With thousands of topics, tens of thousands of posts, our community has created an incredibly deep knowledge base for stock traders. No one can ever exhaust every resource provided on our site.

If you are new, or just looking for guidance, here are some helpful links to get you started.

What are the benefits of VIP Membership?
VIP members get exclusive access to these proven and tested premium indicators: Buy the Dip, Advanced Market Moves 2.0, Take Profit, and Volatility Trading Range. In addition, VIP members get access to over 50 VIP-only custom indicators, add-ons, and strategies, private VIP-only forums, private Discord channel to discuss trades and strategies in real-time, customer support, trade alerts, and much more. Learn all about VIP membership here.
How can I access the premium indicators?
To access the premium indicators, which are plug and play ready, sign up for VIP membership here.
Back
Top