Recently stumbled upon this indicator with auto buy/sell strategy for ThinkorSwim called $SPX Fear & Greed Mean Reversion. It was developed by korygill based on the work of @kerberos007.
The indicator generate buy and sell signals based on Bollinger Bands, Percent B (%B), and a few other parameters.
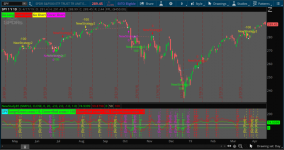
Here is what it looks like.

As you can see, it comes in 2 parts. An indicator on the lower study that tells you when to Go long, Go short, Cover long, and Cover short. Same thing with the upper study. However, with the upper study, that is a strategy that automatically buys and sells based on 100 shares of the stock. It also gives you fewer signals.
Notes from the author:
You should add both indicators into your chart and learn how to use it, tweak it, and improve it to your own trading style.
The indicator and strategy were designed for $SPX and $SPY. You can try it on other stocks as well but result may vary. You can also pair it with the VIX Fear and Greed indicator.
The indicator generate buy and sell signals based on Bollinger Bands, Percent B (%B), and a few other parameters.
Here is what it looks like.
As you can see, it comes in 2 parts. An indicator on the lower study that tells you when to Go long, Go short, Cover long, and Cover short. Same thing with the upper study. However, with the upper study, that is a strategy that automatically buys and sells based on 100 shares of the stock. It also gives you fewer signals.
Notes from the author:
- go long when %B(20,1) crosses > 0
- cover long when %B(20,2) crosses > 100
- go short when %B(20,2) crosses < 100
- cover short when %B(20,1) crosses < 0
You should add both indicators into your chart and learn how to use it, tweak it, and improve it to your own trading style.
Fear and Greed Strategy
Rich (BB code):
#
# $SPX Fear & Greed Mean Reversion Strategy (FGMR_Strat)
#
# This script adapted from posts from @kerberos007
# https://twitter.com/kerberos007
#
# Want the latest version of this script?
# https://github.com/korygill/technical-analysis
#
# Use on thinkorswim and thinkscript
# author @korygill
#

script GetBollingerBandPercent
{
    input price = close;
    input upper = 2;
    input lower = -2;
    input averageType = AverageType.SIMPLE;
    input displace = 0;
    input length = 20;

    def upperBand = BollingerBands(price, displace, length, lower, upper, averageType).UpperBand;
    def lowerBand = BollingerBands(price, displace, length, lower, upper, averageType).LowerBand;

    plot BBPercent = (price - lowerBand) / (upperBand - lowerBand) * 100;
}

input averageType = AverageType.SIMPLE;
input price = close;
input displace = 0;
input length = 20;
input StdDev_DnBuy = -2.0;
input StdDev_UpBuy = 2.0;
input StdDev_DnSell = -1.0;
input StdDev_UpSell = 1.0;
input LongShortBoth = {Long, Short, default Both};

def PercentBBuy = GetBollingerBandPercent(price, StdDev_UpBuy, StdDev_DnBuy);

def PercentBSell = GetBollingerBandPercent(price, StdDev_UpSell, StdDev_DnSell);

def ZeroLine = 0;
def HalfLine = 50;
def UnitLine = 100;

def lsb;
switch (LongShortBoth)
{
    case Long: lsb = 0;
    case Short: lsb = 1;
    default: lsb = 2;
}

# LONG
AddOrder(OrderType.BUY_TO_OPEN,
    Crosses(PercentBBuy, ZeroLine, CrossingDirection.ABOVE) and lsb != 1,
    tickColor = COLOR.WHITE, arrowColor = COLOR.GREEN
    );

AddOrder(OrderType.SELL_TO_CLOSE,
    Crosses(PercentBSell, UnitLine, CrossingDirection.ABOVE) and lsb != 1,
    tickColor = COLOR.WHITE, arrowColor = COLOR.RED
    );

# SHORT
AddOrder(OrderType.SELL_TO_OPEN,
    Crosses(PercentBBuy, UnitLine, CrossingDirection.BELOW) and lsb != 0,
    tickColor = COLOR.WHITE, arrowColor = COLOR.YELLOW
    );

AddOrder(OrderType.BUY_TO_CLOSE,
    Crosses(PercentBSell, ZeroLine, CrossingDirection.BELOW) and lsb != 0,
    tickColor = COLOR.WHITE, arrowColor = COLOR.MAGENTA
    );

AddLabel(yes, "Go Long", COLOR.GREEN);
AddLabel(yes, "Cover Long", COLOR.RED);
AddLabel(yes, "Go Short", COLOR.YELLOW);
AddLabel(yes, "Cover Short", COLOR.MAGENTA);
thinkScript Code
Rich (BB code):
#
# $SPX Fear & Greed Mean Reversion Study (FGMR)
#
# This script adapted from posts from @kerberos007
# https://twitter.com/kerberos007
#
# Want the latest version of this script?
# https://github.com/korygill/technical-analysis
#
# Use on thinkorswim and thinkscript
# author @korygill
#

script GetBollingerBandPercent
{
    input price = close;
    input upper = 2;
    input lower = -2;
    input averageType = AverageType.SIMPLE;
    input displace = 0;
    input length = 20;

    def upperBand = BollingerBands(price, displace, length, lower, upper, averageType).UpperBand;
    def lowerBand = BollingerBands(price, displace, length, lower, upper, averageType).LowerBand;

    plot BBPercent = (price - lowerBand) / (upperBand - lowerBand) * 100;
}

declare lower;

input averageType = AverageType.Simple;
input price = close;
input displace = 0;
input length = 20;
input StdDev_DnBuy = -2.0;
input StdDev_UpBuy = 2.0;
input StdDev_DnSell = -1.0;
input StdDev_UpSell = 1.0;

plot PercentBBuy = GetBollingerBandPercent(price, StdDev_UpBuy, StdDev_DnBuy);
plot PercentBSell = GetBollingerBandPercent(price, StdDev_UpSell, StdDev_DnSell);

plot ZeroLine = 0;
plot HalfLine = 50;
plot UnitLine = 100;

def vixPrice = close("VIX");
def vixPercentBBuy = GetBollingerBandPercent(vixPrice, StdDev_UpBuy, StdDev_DnBuy);
def vixPercentBSell = GetBollingerBandPercent(vixPrice, StdDev_UpSell, StdDev_DnSell);

def opacity = 25;
def linewidth = 1;

PercentBBuy.SetDefaultColor(Color.GREEN);#(GetColor(3));
PercentBBuy.AssignValueColor(CreateColor(
    0,
    255, #255-Max(0,Min(100-opacity,PercentBBuy))*2.55,
    0));
PercentBBuy.SetPaintingStrategy(PaintingStrategy.LINE);
PercentBBuy.SetLineWeight(linewidth);

PercentBSell.SetDefaultColor(Color.RED);#(GetColor(7));
PercentBSell.AssignValueColor(CreateColor(
    255, #Max(opacity,Min(100,PercentBSell))*2.55,
    0,
    0));
PercentBSell.SetPaintingStrategy(PaintingStrategy.LINE);
PercentBSell.SetLineWeight(linewidth);

ZeroLine.SetDefaultColor(Color.GREEN);
HalfLine.SetDefaultColor(GetColor(8));
UnitLine.SetDefaultColor(Color.RED);

# LONG
AddVerticalLine(
  Crosses(PercentBBuy, ZeroLine, CrossingDirection.ABOVE),
  "+++ Go Long +++", Color.GREEN, curve.SHORT_DASH
);

AddVerticalLine(
  Crosses(PercentBSell, UnitLine, CrossingDirection.ABOVE),
  "+++ Cover Long +++", Color.RED, curve.SHORT_DASH
);

# SHORT
AddVerticalLine(
  Crosses(PercentBBuy, UnitLine, CrossingDirection.BELOW),
  "--- (Go Short) ---", Color.YELLOW, curve.SHORT_DASH
);

AddVerticalLine(
  Crosses(PercentBSell, ZeroLine, CrossingDirection.BELOW),
  "--- (Cover Short) ---", Color.MAGENTA, curve.SHORT_DASH
);

#AddVerticalLine(
#  GetDayofWeek(GetYYYYMMDD()) == 5,
#  "Friday", Color.LIGHT_GRAY, curve.MEDIUM_DASH
#);

AddLabel(yes, GetSymbol(), COLOR.CYAN);
AddLabel(yes, "Long=Green cross > 0, Cover=Red cross > 100", COLOR.GREEN);
AddLabel(yes, "Short=Red cross < 100, Cover=Green cross < 0", COLOR.RED);
The indicator and strategy were designed for $SPX and $SPY. You can try it on other stocks as well but result may vary. You can also pair it with the VIX Fear and Greed indicator.
Attachments
Last edited:

