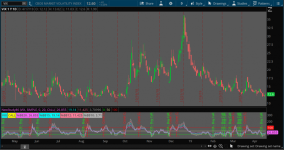
Similar to the previous Fear and Greed indicator, this one was designed for the $VIX. The strategy generate buy and sell signals in ThinkorSwim using Bollinger Bands, Percent B (%B), and a few other parameters.

A strategy for this indicator is still under development. For now, you can follow the signals given by the lower study.

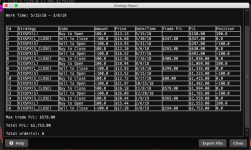
The above screenshot came from backtesting using the SPX Fear and Greed upper strategy on the VIX.
Credits:
Calls
- go long VIX calls when %B(20,1.5) crosses > 0
- cover VIX calls when %B(20,1.5) crosses > 100
Puts
- go long VIX puts when %B(20,1.2) crosses < 100
- cover VIX puts when %B(20,2) crosses < 0
VIX Fear and Greed Strategy
Rich (BB code):
#
# $VIX Fear & Greed Mean Reversion Study (VIX_FGMR)
#
# This script adapted from posts from @kerberos007
# https://twitter.com/kerberos007
#
# Want the latest version of this script?
# https://github.com/korygill/technical-analysis
#
# Use on thinkorswim and thinkscript
# author @korygill
#

script GetBollingerBandPercent
{
    input price = close;
    input upper = 2;
    input lower = -2;
    input averageType = AverageType.SIMPLE;
    input displace = 0;
    input length = 20;

    def upperBand = BollingerBands(price, displace, length, lower, upper, averageType).UpperBand;
    def lowerBand = BollingerBands(price, displace, length, lower, upper, averageType).LowerBand;

    plot BBPercent = (price - lowerBand) / (upperBand - lowerBand) * 100;
}

declare lower;

input sym = "VIX";
def price = close(sym);
input averageType = AverageType.SIMPLE;
input displace = 0;
input length = 20;
input signalType = {default CALL, PUT};

plot PB20 = GetBollingerBandPercent(price, 2.0, -2.0);
plot PB15 = GetBollingerBandPercent(price, 1.5, -1.5);
plot PB12 = GetBollingerBandPercent(price, 1.2, -1.2);
plot PB10 = GetBollingerBandPercent(price, 1.0, -1.0);
#plot symPlot = price;

plot ZeroLine = 0;
plot HalfLine = 50;
plot UnitLine = 100;
ZeroLine.SetDefaultColor(Color.GREEN);
HalfLine.SetDefaultColor(GetColor(8));
UnitLine.SetDefaultColor(Color.RED);

def callput;
switch (signalType)
{
case CALL:
callput = 1;
default:
callput = 0;
}

# -----------------
AddVerticalLine(
  Crosses(PB20, ZeroLine, CrossingDirection.BELOW) and callput == 0,
  "--- (OS - Cover Puts) ---", Color.MAGENTA, curve.SHORT_DASH
);

AddVerticalLine(
  Crosses(PB12, UnitLine, CrossingDirection.BELOW) and callput == 0,
  "--- (OB - Buy Puts) ---", Color.YELLOW, curve.SHORT_DASH
);

# -----------------
AddVerticalLine(
  Crosses(PB15, ZeroLine, CrossingDirection.ABOVE) and callput == 1,
  "+++ OS - Buy Calls +++", Color.GREEN, curve.SHORT_DASH
);

AddVerticalLine(
  Crosses(PB15, UnitLine, CrossingDirection.ABOVE) and callput == 1,
  "+++ OB - Cover Calls +++", Color.RED, curve.SHORT_DASH
);

AddLabel(yes, sym, COLOR.CYAN);
AddLabel(yes, signalType, COLOR.YELLOW);
PB20.SetdefaultColor(GetColor(0));
PB15.SetdefaultColor(GetColor(1));
PB12.SetdefaultColor(GetColor(2));
PB10.SetdefaultColor(GetColor(3));
AddLabel(yes, "%BB20: "+PB20, GetColor(0));
AddLabel(yes, "%BB15: "+PB15, GetColor(1));
AddLabel(yes, "%BB12: "+PB12, GetColor(2));
AddLabel(yes, "%BB10: "+PB10, GetColor(3));
A strategy for this indicator is still under development. For now, you can follow the signals given by the lower study.
The above screenshot came from backtesting using the SPX Fear and Greed upper strategy on the VIX.
Credits:
- @kerberos007
- @korygill
Attachments
Last edited:


