VIP News

MerryDay

Administrative
Staff member
Staff
VIP
Lifetime
Welcome To Earnings Season

Created For VIP members:
Here is how to use technical indicators to find the strongest stocks with the best chances of profitable earning moves.
https://usethinkscript.com/threads/lets-trade-earnings.16115/
A0Sck9E.png

4vT4PfF.png

93dzKiM.png

qlJSIIL.png

read more about:
Volume Price Trends https://usethinkscript.com/threads/volume-price-trends.16117/
Volume Tape Reader https://usethinkscript.com/threads/volume-tape-reader.16118/
Relative Strength Rank
https://usethinkscript.com/threads/relative-strength-ranking.15999/

Scan: for best and strongest stocks to analyze for possible earning pops.
K9odFKk.png
 
Last edited:
Here is a three timeframe grid to use to evaluate Pre-Earnings Trading
Trade the period before earning and exit before the announcement to preserve profits.
May not have as high a reward, but substantial less risk.
Change the number of days in the scanner, to reflect, how many days before earnings, you are looking to trade.
Currently, it scans for earnings occurring one day before, change it to x days before.

Here is an All-In-One Chart.
https://usethinkscript.com/threads/lets-trade-earnings.16115/#post-128558
It contains the 10min chart, the weekly chart and a tick chart stacked on top of each other.
Set the timeframes to reflect the 3 timeframes that you use and add your favorite indicators
Just use the arrows to flip to ALWAYS ALWAYS ALWAYS review your THREE timeframes.
lXR9rUH.jpg


QjhECWc.png
 
Last edited:
Identifying the choicest stocks to trade is an essential part of a strategy.
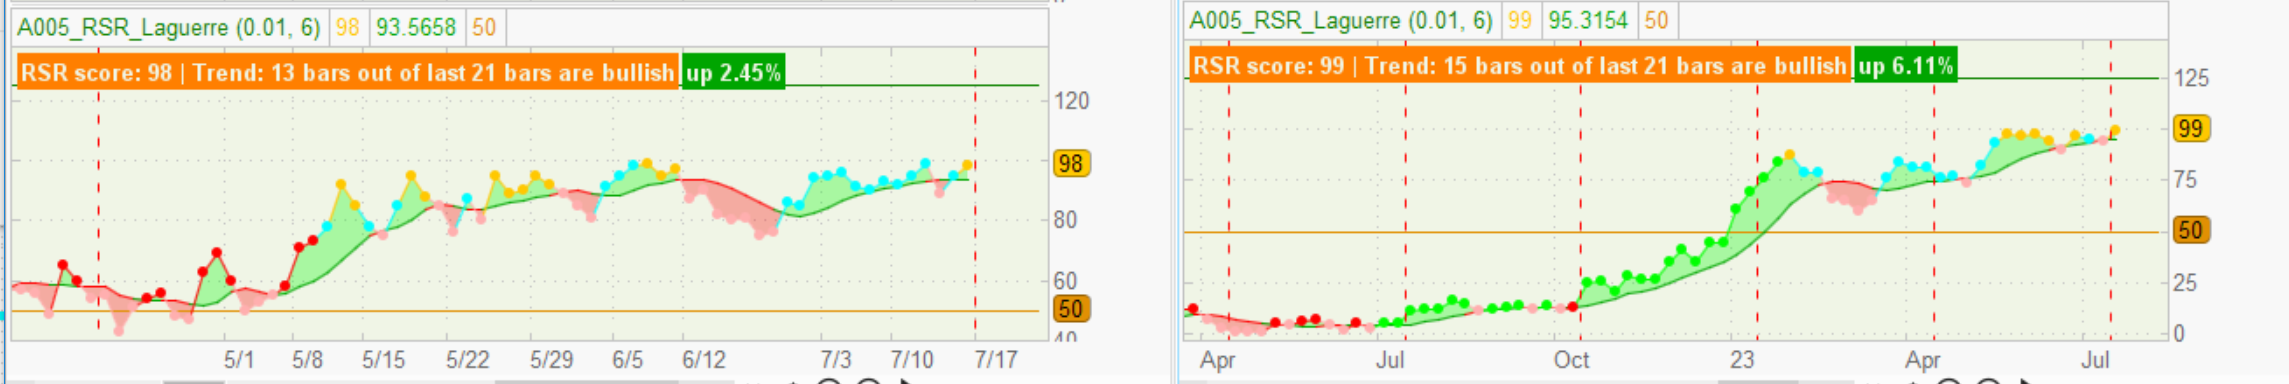
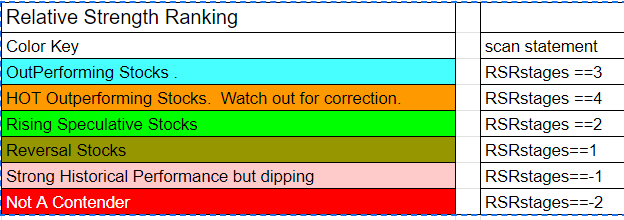
The VIP Relative Strength Ranking v2
https://usethinkscript.com/threads/relative-strength-ranking.15999/
  • finds the stocks which are outperforming their peers
  • also pinpoints the hottest stocks in the market
  • it ascertains the up-and-coming stocks that deserve a look
  • and which of the strongest stocks are dipping and may represent an opportunity
  • of equal importance: the RSR highlights stocks NOT to trade
26WnEAv.png


1QfyTQT.png

Novice, risk-adverse, day and swing traders apply their strategies to outperforming stocks.
During bull market periods, these strong stocks, have a tendency to increase in price in the absence of bad news, economic data, geopolitical events, etc.
Reduce your risk by trading these outperforming instruments.

pQhVIV4.png

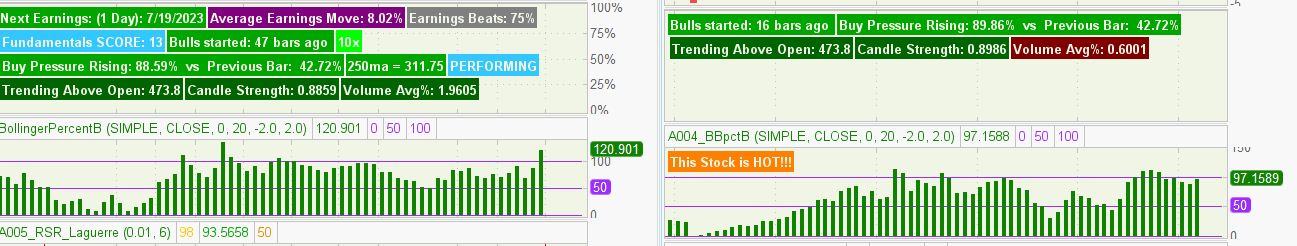
Hot Outperforming Stocks are Outperformers that are trading at the top or over the Bollinger Bands.
These stocks have the momentum to accumulate large gains.
But with great rewards comes great risk. These stocks can be subjected to sudden correction. Trend carefully.

Ia5SvVw.png

Reversion Traders, who are looking to aggressively build income, take on higher levels of risk to potentially achieve higher returns.
Many stocks were beaten down during the bear market and are now regaining strength. These underperformers have great potential.

Reversal Stocks have no trend; have no performance. Their downward movement has stopped.
Rising Speculative Stocks are underperformers, who are starting to shoot up.
Both of these groupings can experience explosive profits or losses.


mTt6NoV.png
Outperformers, who are dipping.
Swing Traders love a down market day. Bargain Basement Shopping at its finest.
Swing Traders' Strategy is predicated on choosing the right stocks.
These dipped outperformers are great stocks, who are having a bad day.
These strong stocks, have a tendency to increase in price when the next rally day hits; in the absence of bad news, economic data, geopolitical events, etc.
As long as the lower timeframes are all bullish, swing traders will take entry on dipping stocks.
Swing traders don't worry as much about the exact timing of the entry. Often times, this stocks will continue dipping; leading to an initial loss. But swing traders will hold until the next new high or longer.
With these trades, it is important to monitor the news. Negative events will cause this trade to downward correct.

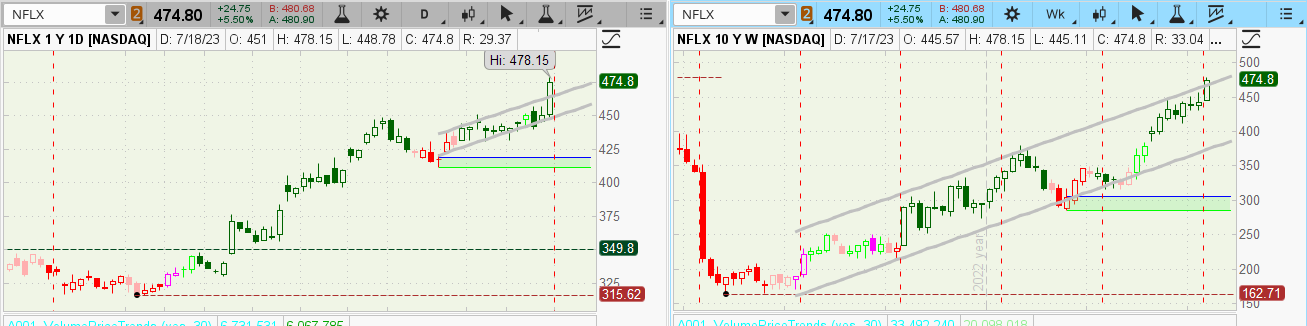
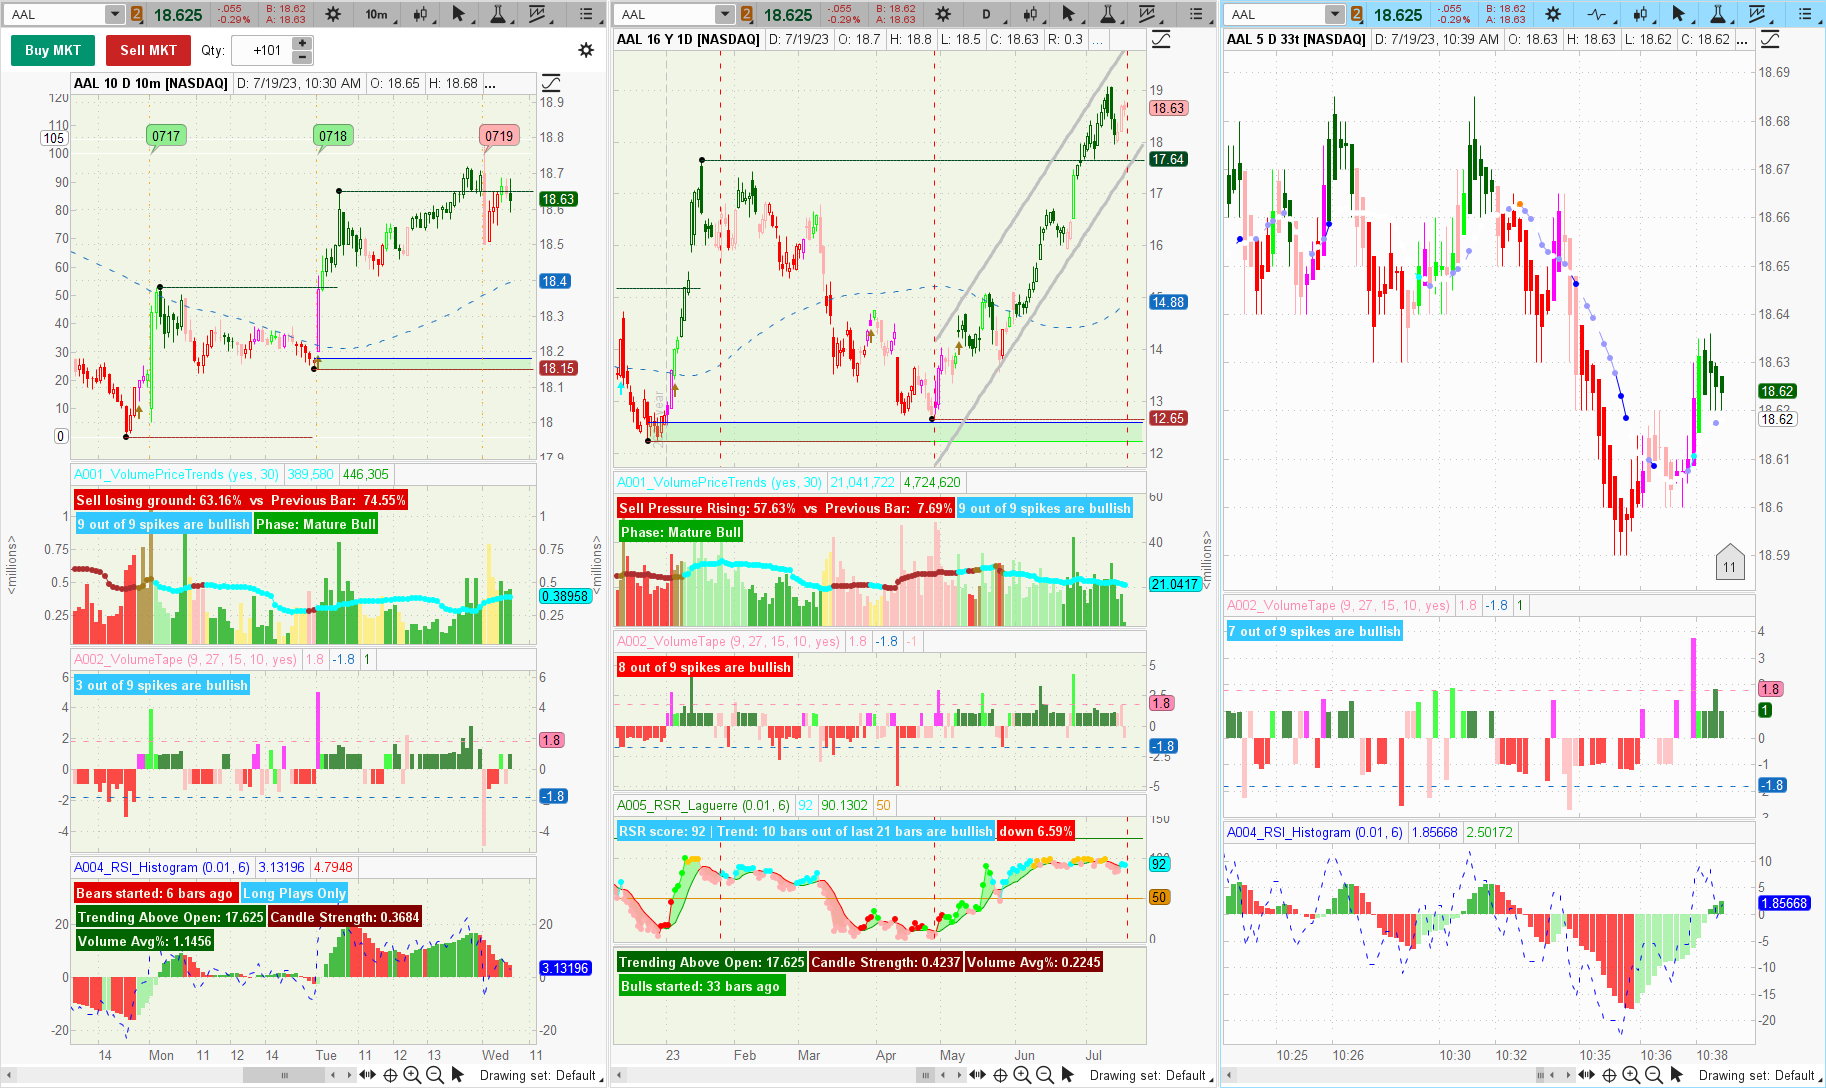
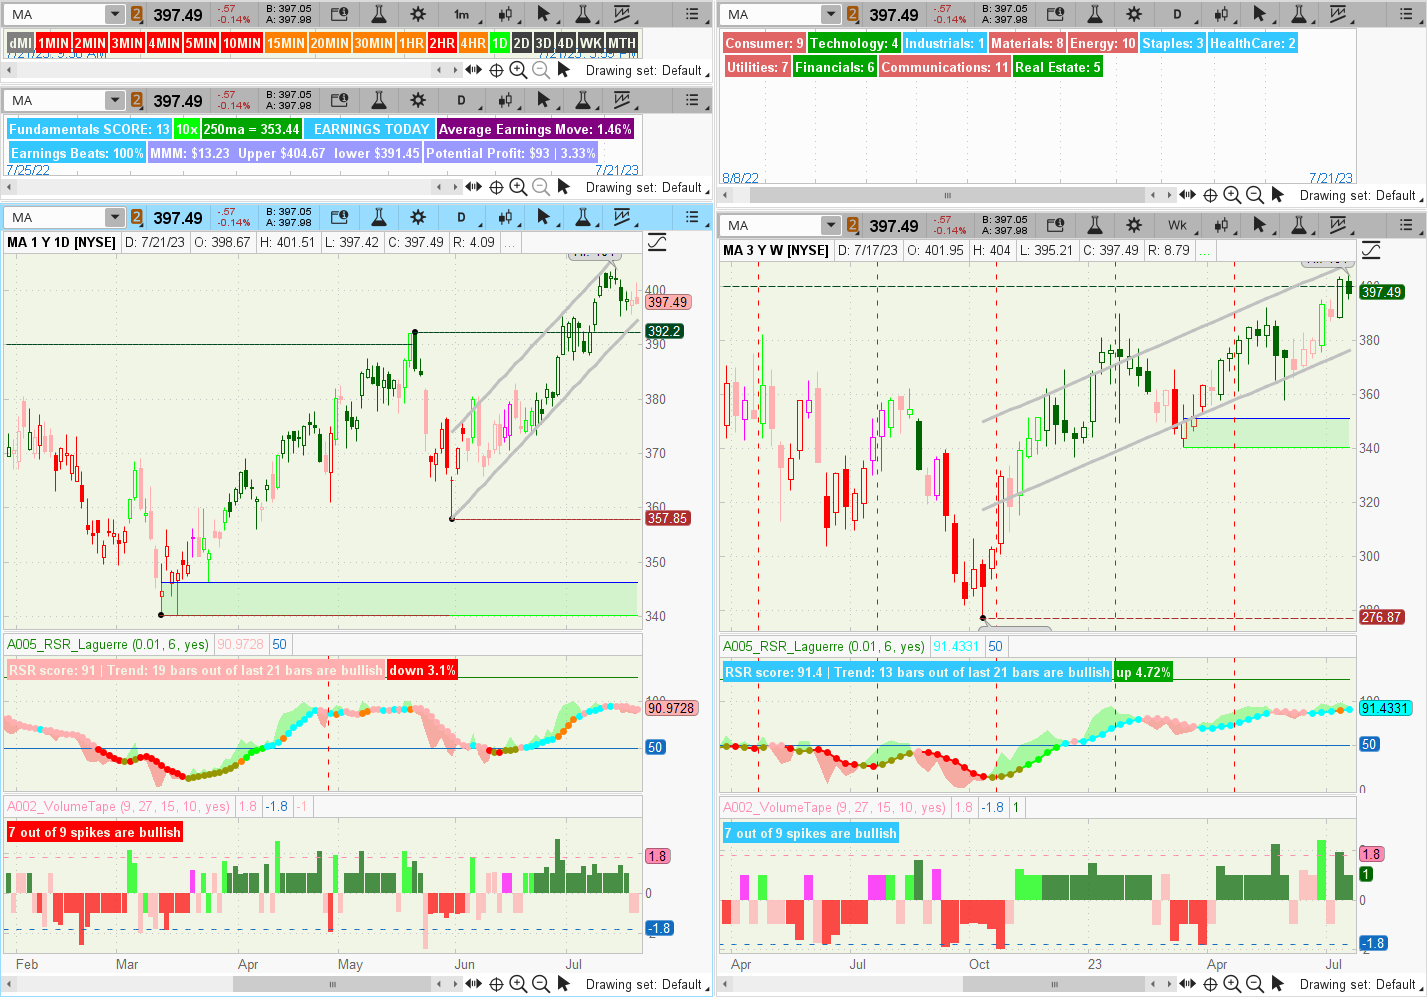
The scan results must be reviewed on the daily and weekly chart.
The stock may be so volatile as to negate any trend the computer found.

This chart allows all aspects of a stock to be verified.
Outperforming stocks will have a dMI trend.
Dipping stocks will not.
All stocks should have strong fundamentals, Decent earnings moves.
Review the stocks' sector. Is it also up trending (cyan or green)?
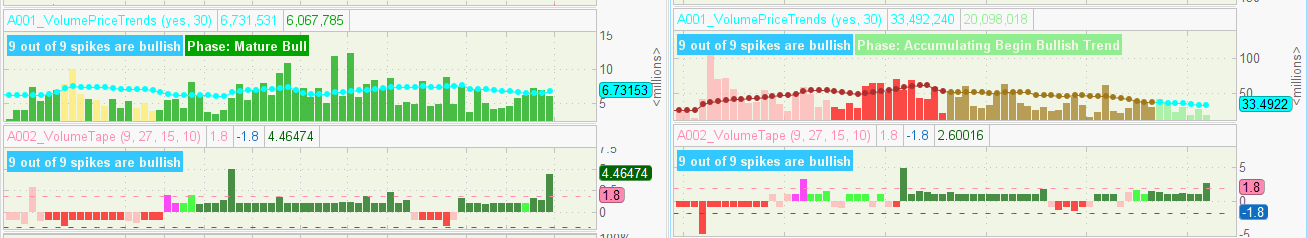
On the volume tape, more up bars than down bars is preferred.

The daily and weekly charts are stacked on top of each other.
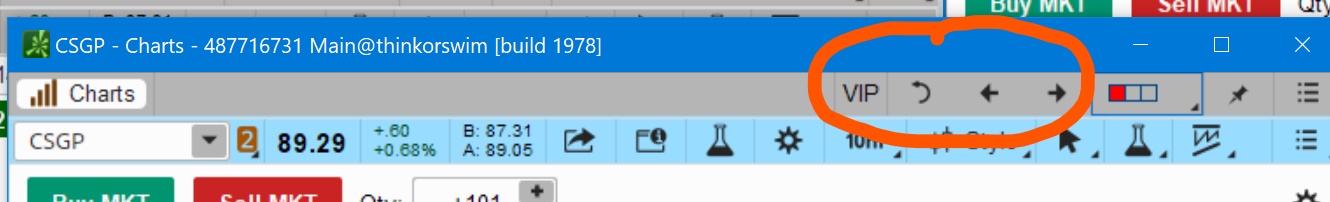
To flip through the charts, click on the arrows at the top of th screen:
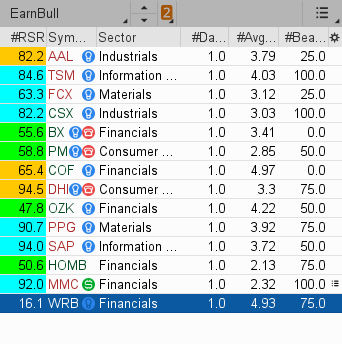
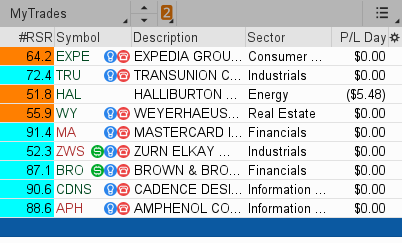
ZADmB2T.jpg

8l0dOyG.png


Watchlist:
Put the Relative Strength Ranking on your favorite Quotes Table.
The higher the number, the stronger the performance.
But do not discount those lower rankings that are colored cyan. They represent underperformers, who are trending.
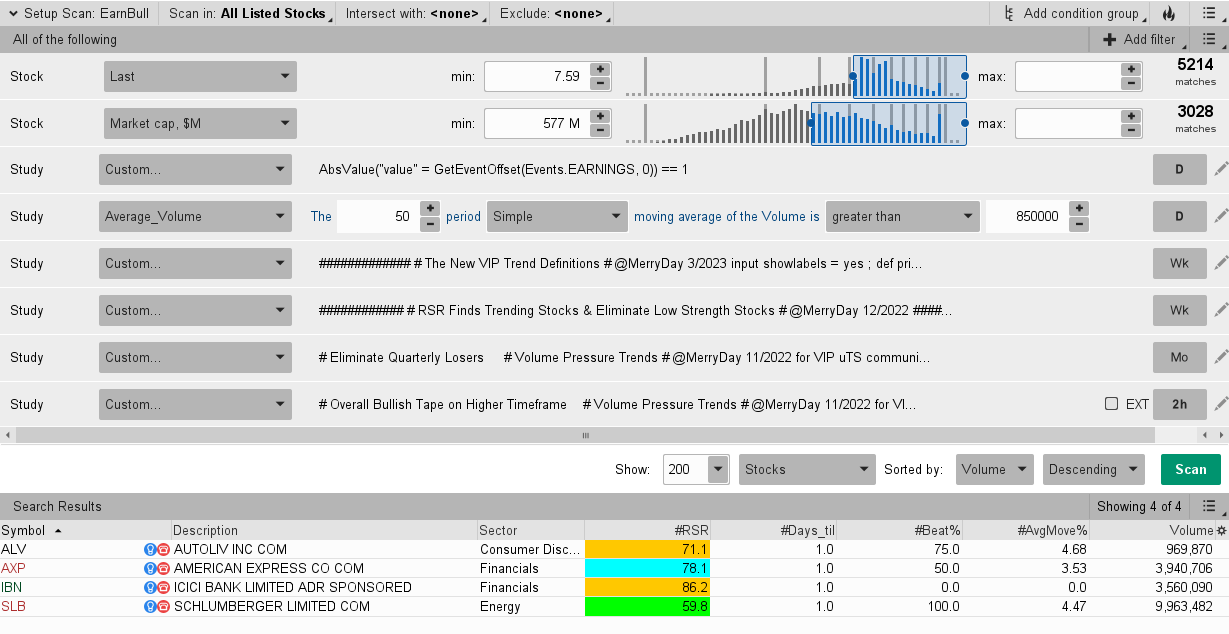
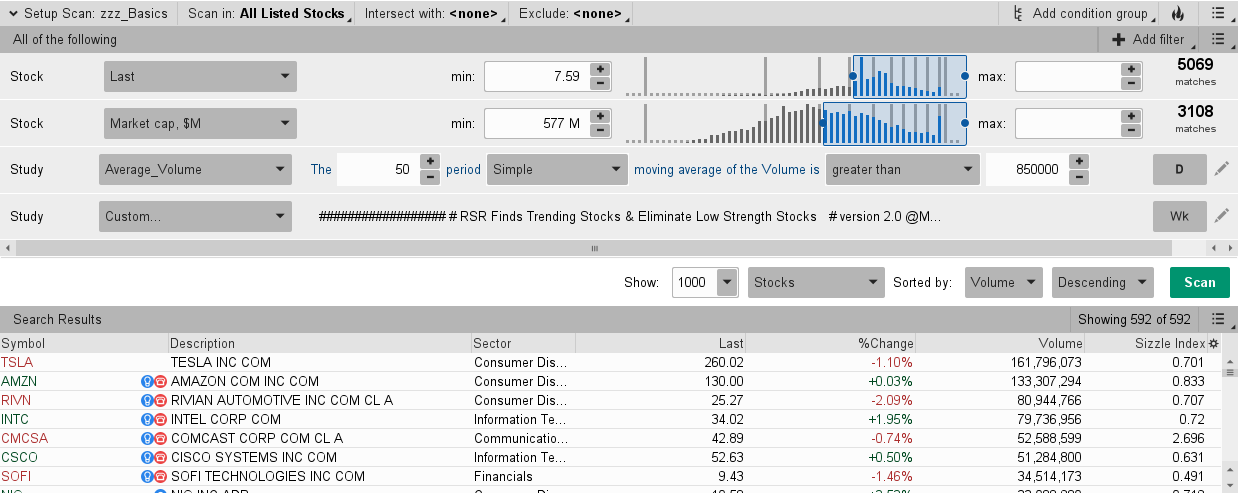
FCFQQ2m.png


Scan Hacker:
70% of trade analysis should be taking place on charts with timeframes of 2 hours and higher.
Yet the majority of scalpers and day traders, never look at charts over 10min.

Stack the deck in your favor, by adding these higher timeframe filters to your scans.
Zup29lQ.png
 
Last edited:
VIP Adaptive QStick Laguerre
The QStick candlestick reading indicator, created by Tushar Chande, calculates a quick moving average of the difference between candlestick open and close.

A green VIP Quick Stick plot is indicative of a micro-trend of increasing buying pressure.
Quick micro-trends provide signals faster. This is useful in filtering out false signals when using trend/momentum oscillators.

https://usethinkscript.com/threads/adaptive-qstick-laguerre.17010/
APkZmej.png
 

Join useThinkScript to post your question to a community of 21,000+ developers and traders.

Similar threads

Not the exact question you're looking for?

Start a new thread and receive assistance from our community.

87k+ Posts
471 Online
Create Post

Similar threads

Similar threads

The Market Trading Game Changer

Join 2,500+ subscribers inside the useThinkScript VIP Membership Club
  • Exclusive indicators
  • Proven strategies & setups
  • Private Discord community
  • ‘Buy The Dip’ signal alerts
  • Exclusive members-only content
  • Add-ons and resources
  • 1 full year of unlimited support

Frequently Asked Questions

What is useThinkScript?

useThinkScript is the #1 community of stock market investors using indicators and other tools to power their trading strategies. Traders of all skill levels use our forums to learn about scripting and indicators, help each other, and discover new ways to gain an edge in the markets.

How do I get started?

We get it. Our forum can be intimidating, if not overwhelming. With thousands of topics, tens of thousands of posts, our community has created an incredibly deep knowledge base for stock traders. No one can ever exhaust every resource provided on our site.

If you are new, or just looking for guidance, here are some helpful links to get you started.

What are the benefits of VIP Membership?
VIP members get exclusive access to these proven and tested premium indicators: Buy the Dip, Advanced Market Moves 2.0, Take Profit, and Volatility Trading Range. In addition, VIP members get access to over 50 VIP-only custom indicators, add-ons, and strategies, private VIP-only forums, private Discord channel to discuss trades and strategies in real-time, customer support, trade alerts, and much more. Learn all about VIP membership here.
How can I access the premium indicators?
To access the premium indicators, which are plug and play ready, sign up for VIP membership here.
Back
Top