
can anyone provide me with instructions on how to create a watchlist that would signal when this indicator triggers in either direction?
You are using an out of date browser. It may not display this or other websites correctly.
You should upgrade or use an alternative browser.
You should upgrade or use an alternative browser.
Turtle Trade Channels Indicator(TuTCI) for ThinkOrSwim
- Thread starter samer800
- Start date
Join useThinkScript to post your question to a community of 21,000+ developers and traders.
Here is the basic structure. Clean it up, and modify it to your needs.can anyone provide me with instructions on how to create a watchlist that would signal when this indicator triggers in either direction?
If you are utilizing the MTF option, the watchlist will not match your charts.
The ToS platform does not support the use of multiple timeframes in Watchlists, Scans, Chart Alerts, Conditional Orders.
Turtle Trade Channels Watchlist
Shared Watchlist Link: http://tos.mx/LIHeKX5 Click here for --> Easiest way to load shared links
Ruby:
#//@version=4
#//author: @kivancozbilgic
#https://www.tradingview.com/script/pB5nv16J/
#study(title="Turtle Trade Channels Indicator", shorttitle="TuTCI"
# Converted and modifiedTrueRange by Sam4COK@Samer800 - 08/2022

input EntryLength   = 20;   # "Entry Length"
input ExitLength    = 10;   # "Exit Length"

#barssince(Condition) =>
script barssince {
    input Condition = 0;
    def barssince = if Condition then 1 else barssince[1] + 1;
    plot return = barssince;
}

def TFLow   = low;
def TFHigh  = high;
def TFClose = close;

def up = Highest(TFHigh, EntryLength);
def down = Lowest(TFLow, EntryLength);
def sup = Highest(TFHigh, ExitLength);
def sdown = Lowest(TFLow, ExitLength);

def K1 = if barssince(TFHigh >= up[1]) <= barssince(TFLow <= down[1]) then down else up;
def K2 = If(barssince(TFHigh >= up[1]) <= barssince(TFLow <= down[1]), sdown, sup);
def K3 = If(TFClose > K1, down, double.NaN);
def K4 = If(TFClose < K1, up, double.NaN);

def lower = Lowest(TFLow, EntryLength);
def upper = Highest(TFHigh, EntryLength);

def buySignal  = TFHigh == upper[1] or TFHigh crosses above upper[1];
def sellSignal = TFLow  == lower[1] or lower[1] crosses above TFLow;
def buyExit    = TFLow  == sdown[1] or sdown[1] crosses above TFLow;
def sellExit   = TFHigh == sup[1]   or TFHigh crosses above sup[1];

def O1 = barssince(buySignal);
def O2 = barssince(sellSignal);
def O3 = barssince(buyExit);
def O4 = barssince(sellExit);
def E1 = barssince(buySignal[1]);
def E2 = barssince(sellSignal[1]);
def E3 = barssince(buyExit[1]);
def E4 = barssince(sellExit[1]);


AddLabel(yes,
if buyExit and O1 < O3[1] then "buyExit" else
if sellExit and O2 < O4[1] then  "sellExit" else
if buySignal and O3 < O1[1] then "buySignal" else
if sellSignal and O4 < O2[1] then "sellSignal" else " ");

AssignBackgroundColor(
if buyExit and O1 < O3[1] then color.red else
if sellExit and O2 < O4[1] then color.dark_orange else
if buySignal and O3 < O1[1] then color.green else
if sellSignal and O4 < O2[1] then color.plum else color.light_gray);
Last edited:
OMG Thank you so much! Is this for daily chart?
OMG Thank you so much! Is this for daily chart?
- The aggregation is selected when you edit the watchlist
- Nothing in the script precludes it being used on any timeframe
- A Google search determines that the Turtle Strategy was created to run on the daily aggregation.
TradingNumbers
Active member
Here is the strategy version so you can see the performance.
Code:
#//@version=4
#//author: @kivancozbilgic
#https://www.tradingview.com/script/pB5nv16J/
#study(title="Turtle Trade Channels Indicator", shorttitle="TuTCI"
# Converted and modifiedTrueRange by Sam4COK@Samer800 - 08/2022
# Added strategy by TradingNumbers

input EntryLength   = 20;   # "Entry Length"
input ExitLength    = 10;   # "Exit Length"
input ShowLines     = yes;  # "Show Lines?"
input showSignals   = yes;  # "Show Entry/Exit Signals ?"
input SignalOnPrice = no;   # "Show Entry/Exit Signals on Price?"
input ShowCloud     = yes;  # "Highlighter On/Off ?"
input UseChartTime  = yes;  # "Use Chart timeframe or Aggregation?"
input aggregation   = AggregationPeriod.DAY;

def na = Double.NaN;

#barssince(Condition) =>
script barssince {
    input Condition = 0;
    def barssince = if Condition then 1 else barssince[1] + 1;
    plot return = barssince;
}

#//MTF
def TFLow;
def TFHigh;
def TFClose;

if UseChartTime
then {
    TFLow   = low;
    TFHigh  = high;
    TFClose = close;
} else {
    TFLow = low(period = aggregation);
    TFHigh = high(period = aggregation);
    TFClose = close(period = aggregation);
}

def up = Highest(TFHigh, EntryLength);
def down = Lowest(TFLow, EntryLength);
def sup = Highest(TFHigh, ExitLength);
def sdown = Lowest(TFLow, ExitLength);

def K1 = if barssince(TFHigh >= up[1]) <= barssince(TFLow <= down[1]) then down else up;
def K2 = If(barssince(TFHigh >= up[1]) <= barssince(TFLow <= down[1]), sdown, sup);
def K3 = If(TFClose > K1, down, na);
def K4 = If(TFClose < K1, up, na);

plot TrendLine = K1;
TrendLine.SetDefaultColor(CreateColor(255, 82, 82));
TrendLine.SetLineWeight(2);
TrendLine.SetHiding(!ShowLines);
plot ExitLine = K2;
ExitLine.SetStyle(Curve.POINTS);
ExitLine.SetDefaultColor(CreateColor(0, 148, 255));
ExitLine.SetHiding(!ShowLines);

def lower = Lowest(TFLow, EntryLength);
def upper = Highest(TFHigh, EntryLength);
plot u = upper;
plot l = lower;
u.SetDefaultColor(CreateColor(0, 148, 255));
u.SetHiding(!ShowLines);
l.SetDefaultColor(CreateColor(0, 148, 255));
l.SetHiding(!ShowLines);

def buySignal  = TFHigh == upper[1] or TFHigh crosses above upper[1];
def sellSignal = TFLow  == lower[1] or lower[1] crosses above TFLow;
def buyExit    = TFLow  == sdown[1] or sdown[1] crosses above TFLow;
def sellExit   = TFHigh == sup[1]   or TFHigh crosses above sup[1];

def O1 = barssince(buySignal);
def O2 = barssince(sellSignal);
def O3 = barssince(buyExit);
def O4 = barssince(sellExit);
def E1 = barssince(buySignal[1]);
def E2 = barssince(sellSignal[1]);
def E3 = barssince(buyExit[1]);
def E4 = barssince(sellExit[1]);

plot LongExit = if buyExit and O1 < O3[1] then up else na;
LongExit.SetPaintingStrategy(PaintingStrategy.POINTS);
LongExit.SetDefaultColor(CreateColor(0, 148, 255));
LongExit.SetLineWeight(3);
LongExit.SetHiding(!ShowLines);

plot ShortExit = if sellExit and O2 < O4[1] then down else na;
ShortExit.SetPaintingStrategy(PaintingStrategy.POINTS);
ShortExit.SetDefaultColor(CreateColor(0, 148, 255));
ShortExit.SetLineWeight(3);
ShortExit.SetHiding(!ShowLines);

plot LongEntry = if buySignal and O3 < O1[1] then down else na;
LongEntry.SetPaintingStrategy(PaintingStrategy.POINTS);
LongEntry.SetDefaultColor(Color.GREEN);
LongEntry.SetLineWeight(3);
LongEntry.SetHiding(!ShowLines);

plot ShortEntry = if sellSignal and O4 < O2[1] then up else na;
ShortEntry.SetPaintingStrategy(PaintingStrategy.POINTS);
ShortEntry.SetDefaultColor(CreateColor(255, 82, 82));
ShortEntry.SetLineWeight(3);
ShortEntry.SetHiding(!ShowLines);

#### Bubbles
def SignalUp = if showSignals then if SignalOnPrice then high else up else na;
def SignalDn = if showSignals then if SignalOnPrice then low else down else na;

def ExitLong  = if buyExit and SignalUp and O1 < O3[1] then up else na;
AddChartBubble(ExitLong, SignalUp, "Exit Long", CreateColor(0, 148, 255), yes);
def ExitShort = if sellExit and SignalDn and O2 < O4[1] then down else na;
AddChartBubble(ExitShort, SignalDn, "Exit Short", CreateColor(0, 148, 255), no);

def Long  =  if buySignal and SignalDn and O3 < O1[1] then down else na;
AddChartBubble(Long, SignalDn, "Long Entry", Color.GREEN, no);
def Short =  if sellSignal and SignalUp and O4 < O2[1] then up else na;
AddChartBubble(Short, SignalUp, "Short Entry", Color.RED, yes);

#### Cloud
def color1 = if ShowCloud and (Min(Min(O1, O2), O3) == O1) then 1 else na;
def color2 = if ShowCloud and (Min(Min(O1, O2), O4) == O2) then 1 else na;
AddCloud(if color1 then u else na, ExitLine, Color.DARK_GREEN);
AddCloud(if color2 then ExitLine else na, l, Color.DARK_RED);

### Strategy
AddOrder(type = OrderType.BUY_TO_OPEN, condition = LongEntry);
AddOrder(type = OrderType.SELL_TO_CLOSE, condition = LongExit);
AddOrder(type = OrderType.SELL_TO_OPEN, condition = ShortEntry);
AddOrder(type = OrderType.BUY_TO_CLOSE, condition = ShortExit);

##### ENDCould you add an input to turn odd the long or turn off the short so there both not on the chart?
I added to the below more setting to remove/add lines and signals with option to use the indicator in different timeframe.
Release Note:
Legendary trade system which proved that great traders can be made, not born.
Turtle Trade Experiment made 80% annual return for 4 years and made 150 million $
Turtle Trade trend following system is a complete opposite to the "buy low and sell high" approach.
This trend following system was taught to a group of average and normal individuals, and almost everyone turned into a profitable trader.
They used the basis logic of well known DONCHIAN CHANNELS which developed by Richard Donchian .
The main rule is "Trade an 20-day breakout and take profits when an 10-day high or low is breached ". Examples:
Buy a 20-day breakout and close the trade when price action reaches a 10-day low.
Go short a 20-day breakout and close the trade when price action reaches a 10-day high.
In this indicator,
The red line is the trading line which indicates the trend direction:
Price bars over the trend line indicates uptrend
Price bars under the trend line means downtrend
The dotted blue line is the exit line.
Original system is:
Go long when the price High is equal to or above previous 20 day Highest price.
Go short when the price Low is equal to or below previous 20 day Lowest price.
Exit long positions when the price touches the exit line
Exit short positions when the price touches the exit line
Recommended initial stop-loss is ATR * 2 from the opening price.
Default system parameters were 20,10 and 55,20.
Original Turtle Rules:
To trade exactly like the turtles did, you need to set up two indicators representing the main and the failsafe system.
Set up the main indicator with EntryPeriod = 20 and ExitPeriod = 10 (A.k.a S1) (My comments: Good for Swing - Long timeframe)
Set up the failsafe indicator with EntryPeriod = 55 and ExitPeriod = 20 using a different color. (A.k.a S2) (My comment: Good for intraday - Short timeframe)
The entry strategy using S1 is as follows
Buy 20-day breakouts using S1 only if last signaled trade was a loss.
Sell 20-day breakouts using S1 only if last signaled trade was a loss.
If last signaled trade by S1 was a win, you shouldn't trade -Irregardless of the direction or if you traded last signal it or not-
The entry strategy using S2 is as follows:
Buy 55-day breakouts only if you ignored last S1 signal and the market is rallying without you
Sell 55-day breakouts only if you ignored last S1 signal and the market is pluging without you
You can Highlight the chart with provided trade signals:
Green cloud color when Long
Red cloud color when Short
No cloud color when flat
CSS:#//@version=4 #//author: @kivancozbilgic #https://www.tradingview.com/script/pB5nv16J/ #study(title="Turtle Trade Channels Indicator", shorttitle="TuTCI" # Converted and modifiedTrueRange by Sam4COK@Samer800 - 08/2022 input EntryLength = 20; # "Entry Length" input ExitLength = 10; # "Exit Length" input ShowLines = yes; # "Show Lines?" input showSignals = yes; # "Show Entry/Exit Signals ?" input SignalOnPrice = no; # "Show Entry/Exit Signals on Price?" input ShowCloud = yes; # "Highlighter On/Off ?" input UseChartTime = yes; # "Use Chart timeframe or Aggregation?" input aggregation = AggregationPeriod.DAY; def na = Double.NaN; #barssince(Condition) => script barssince { input Condition = 0; def barssince = if Condition then 1 else barssince[1] + 1; plot return = barssince; } #//MTF def TFLow; def TFHigh; def TFClose; if UseChartTime then { TFLow = low; TFHigh = high; TFClose = close; } else { TFLow = low(period = aggregation); TFHigh = high(period = aggregation); TFClose = close(period = aggregation); } def up = Highest(TFHigh, EntryLength); def down = Lowest(TFLow, EntryLength); def sup = Highest(TFHigh, ExitLength); def sdown = Lowest(TFLow, ExitLength); def K1 = if barssince(TFHigh >= up[1]) <= barssince(TFLow <= down[1]) then down else up; def K2 = If(barssince(TFHigh >= up[1]) <= barssince(TFLow <= down[1]), sdown, sup); def K3 = If(TFClose > K1, down, na); def K4 = If(TFClose < K1, up, na); plot TrendLine = K1; TrendLine.SetDefaultColor(CreateColor(255, 82, 82)); TrendLine.SetLineWeight(2); TrendLine.SetHiding(!ShowLines); plot ExitLine = K2; ExitLine.SetStyle(Curve.POINTS); ExitLine.SetDefaultColor(CreateColor(0, 148, 255)); ExitLine.SetHiding(!ShowLines); def lower = Lowest(TFLow, EntryLength); def upper = Highest(TFHigh, EntryLength); plot u = upper; plot l = lower; u.SetDefaultColor(CreateColor(0, 148, 255)); u.SetHiding(!ShowLines); l.SetDefaultColor(CreateColor(0, 148, 255)); l.SetHiding(!ShowLines); def buySignal = TFHigh == upper[1] or TFHigh crosses above upper[1]; def sellSignal = TFLow == lower[1] or lower[1] crosses above TFLow; def buyExit = TFLow == sdown[1] or sdown[1] crosses above TFLow; def sellExit = TFHigh == sup[1] or TFHigh crosses above sup[1]; def O1 = barssince(buySignal); def O2 = barssince(sellSignal); def O3 = barssince(buyExit); def O4 = barssince(sellExit); def E1 = barssince(buySignal[1]); def E2 = barssince(sellSignal[1]); def E3 = barssince(buyExit[1]); def E4 = barssince(sellExit[1]); plot LongExit = if buyExit and O1 < O3[1] then up else na; LongExit.SetPaintingStrategy(PaintingStrategy.POINTS); LongExit.SetDefaultColor(CreateColor(0, 148, 255)); LongExit.SetLineWeight(3); LongExit.SetHiding(!ShowLines); plot ShortExit = if sellExit and O2 < O4[1] then down else na; ShortExit.SetPaintingStrategy(PaintingStrategy.POINTS); ShortExit.SetDefaultColor(CreateColor(0, 148, 255)); ShortExit.SetLineWeight(3); ShortExit.SetHiding(!ShowLines); plot LongEntry = if buySignal and O3 < O1[1] then down else na; LongEntry.SetPaintingStrategy(PaintingStrategy.POINTS); LongEntry.SetDefaultColor(Color.GREEN); LongEntry.SetLineWeight(3); LongEntry.SetHiding(!ShowLines); plot ShortEntry = if sellSignal and O4 < O2[1] then up else na; ShortEntry.SetPaintingStrategy(PaintingStrategy.POINTS); ShortEntry.SetDefaultColor(CreateColor(255, 82, 82)); ShortEntry.SetLineWeight(3); ShortEntry.SetHiding(!ShowLines); #### Bubbles def SignalUp = if showSignals then if SignalOnPrice then high else up else na; def SignalDn = if showSignals then if SignalOnPrice then low else down else na; def ExitLong = if buyExit and SignalUp and O1 < O3[1] then up else na; AddChartBubble(ExitLong, SignalUp, "Exit Long", CreateColor(0, 148, 255), yes); def ExitShort = if sellExit and SignalDn and O2 < O4[1] then down else na; AddChartBubble(ExitShort, SignalDn, "Exit Short", CreateColor(0, 148, 255), no); def Long = if buySignal and SignalDn and O3 < O1[1] then down else na; AddChartBubble(Long, SignalDn, "Long Entry", Color.GREEN, no); def Short = if sellSignal and SignalUp and O4 < O2[1] then up else na; AddChartBubble(Short, SignalUp, "Short Entry", Color.RED, yes); #### Cloud def color1 = if ShowCloud and (Min(Min(O1, O2), O3) == O1) then 1 else na; def color2 = if ShowCloud and (Min(Min(O1, O2), O4) == O2) then 1 else na; AddCloud(if color1 then u else na, ExitLine, Color.DARK_GREEN); AddCloud(if color2 then ExitLine else na, l, Color.DARK_RED); ##### END
@samer800 Code could have an error, testing the lower times frames like this chart on the 5 min for Globex futures and you will notice there's no short exit
I added to the below more setting to remove/add lines and signals with option to use the indicator in different timeframe.
Release Note:
Legendary trade system which proved that great traders can be made, not born.
Turtle Trade Experiment made 80% annual return for 4 years and made 150 million $
Turtle Trade trend following system is a complete opposite to the "buy low and sell high" approach.
This trend following system was taught to a group of average and normal individuals, and almost everyone turned into a profitable trader.
They used the basis logic of well known DONCHIAN CHANNELS which developed by Richard Donchian .
The main rule is "Trade an 20-day breakout and take profits when an 10-day high or low is breached ". Examples:
Buy a 20-day breakout and close the trade when price action reaches a 10-day low.
Go short a 20-day breakout and close the trade when price action reaches a 10-day high.
In this indicator,
The red line is the trading line which indicates the trend direction:
Price bars over the trend line indicates uptrend
Price bars under the trend line means downtrend
The dotted blue line is the exit line.
Original system is:
Go long when the price High is equal to or above previous 20 day Highest price.
Go short when the price Low is equal to or below previous 20 day Lowest price.
Exit long positions when the price touches the exit line
Exit short positions when the price touches the exit line
Recommended initial stop-loss is ATR * 2 from the opening price.
Default system parameters were 20,10 and 55,20.
Original Turtle Rules:
To trade exactly like the turtles did, you need to set up two indicators representing the main and the failsafe system.
Set up the main indicator with EntryPeriod = 20 and ExitPeriod = 10 (A.k.a S1) (My comments: Good for Swing - Long timeframe)
Set up the failsafe indicator with EntryPeriod = 55 and ExitPeriod = 20 using a different color. (A.k.a S2) (My comment: Good for intraday - Short timeframe)
The entry strategy using S1 is as follows
Buy 20-day breakouts using S1 only if last signaled trade was a loss.
Sell 20-day breakouts using S1 only if last signaled trade was a loss.
If last signaled trade by S1 was a win, you shouldn't trade -Irregardless of the direction or if you traded last signal it or not-
The entry strategy using S2 is as follows:
Buy 55-day breakouts only if you ignored last S1 signal and the market is rallying without you
Sell 55-day breakouts only if you ignored last S1 signal and the market is pluging without you
You can Highlight the chart with provided trade signals:
Green cloud color when Long
Red cloud color when Short
No cloud color when flat
CSS:#//@version=4 #//author: @kivancozbilgic #https://www.tradingview.com/script/pB5nv16J/ #study(title="Turtle Trade Channels Indicator", shorttitle="TuTCI" # Converted and modifiedTrueRange by Sam4COK@Samer800 - 08/2022 input EntryLength = 20; # "Entry Length" input ExitLength = 10; # "Exit Length" input ShowLines = yes; # "Show Lines?" input showSignals = yes; # "Show Entry/Exit Signals ?" input SignalOnPrice = no; # "Show Entry/Exit Signals on Price?" input ShowCloud = yes; # "Highlighter On/Off ?" input UseChartTime = yes; # "Use Chart timeframe or Aggregation?" input aggregation = AggregationPeriod.DAY; def na = Double.NaN; #barssince(Condition) => script barssince { input Condition = 0; def barssince = if Condition then 1 else barssince[1] + 1; plot return = barssince; } #//MTF def TFLow; def TFHigh; def TFClose; if UseChartTime then { TFLow = low; TFHigh = high; TFClose = close; } else { TFLow = low(period = aggregation); TFHigh = high(period = aggregation); TFClose = close(period = aggregation); } def up = Highest(TFHigh, EntryLength); def down = Lowest(TFLow, EntryLength); def sup = Highest(TFHigh, ExitLength); def sdown = Lowest(TFLow, ExitLength); def K1 = if barssince(TFHigh >= up[1]) <= barssince(TFLow <= down[1]) then down else up; def K2 = If(barssince(TFHigh >= up[1]) <= barssince(TFLow <= down[1]), sdown, sup); def K3 = If(TFClose > K1, down, na); def K4 = If(TFClose < K1, up, na); plot TrendLine = K1; TrendLine.SetDefaultColor(CreateColor(255, 82, 82)); TrendLine.SetLineWeight(2); TrendLine.SetHiding(!ShowLines); plot ExitLine = K2; ExitLine.SetStyle(Curve.POINTS); ExitLine.SetDefaultColor(CreateColor(0, 148, 255)); ExitLine.SetHiding(!ShowLines); def lower = Lowest(TFLow, EntryLength); def upper = Highest(TFHigh, EntryLength); plot u = upper; plot l = lower; u.SetDefaultColor(CreateColor(0, 148, 255)); u.SetHiding(!ShowLines); l.SetDefaultColor(CreateColor(0, 148, 255)); l.SetHiding(!ShowLines); def buySignal = TFHigh == upper[1] or TFHigh crosses above upper[1]; def sellSignal = TFLow == lower[1] or lower[1] crosses above TFLow; def buyExit = TFLow == sdown[1] or sdown[1] crosses above TFLow; def sellExit = TFHigh == sup[1] or TFHigh crosses above sup[1]; def O1 = barssince(buySignal); def O2 = barssince(sellSignal); def O3 = barssince(buyExit); def O4 = barssince(sellExit); def E1 = barssince(buySignal[1]); def E2 = barssince(sellSignal[1]); def E3 = barssince(buyExit[1]); def E4 = barssince(sellExit[1]); plot LongExit = if buyExit and O1 < O3[1] then up else na; LongExit.SetPaintingStrategy(PaintingStrategy.POINTS); LongExit.SetDefaultColor(CreateColor(0, 148, 255)); LongExit.SetLineWeight(3); LongExit.SetHiding(!ShowLines); plot ShortExit = if sellExit and O2 < O4[1] then down else na; ShortExit.SetPaintingStrategy(PaintingStrategy.POINTS); ShortExit.SetDefaultColor(CreateColor(0, 148, 255)); ShortExit.SetLineWeight(3); ShortExit.SetHiding(!ShowLines); plot LongEntry = if buySignal and O3 < O1[1] then down else na; LongEntry.SetPaintingStrategy(PaintingStrategy.POINTS); LongEntry.SetDefaultColor(Color.GREEN); LongEntry.SetLineWeight(3); LongEntry.SetHiding(!ShowLines); plot ShortEntry = if sellSignal and O4 < O2[1] then up else na; ShortEntry.SetPaintingStrategy(PaintingStrategy.POINTS); ShortEntry.SetDefaultColor(CreateColor(255, 82, 82)); ShortEntry.SetLineWeight(3); ShortEntry.SetHiding(!ShowLines); #### Bubbles def SignalUp = if showSignals then if SignalOnPrice then high else up else na; def SignalDn = if showSignals then if SignalOnPrice then low else down else na; def ExitLong = if buyExit and SignalUp and O1 < O3[1] then up else na; AddChartBubble(ExitLong, SignalUp, "Exit Long", CreateColor(0, 148, 255), yes); def ExitShort = if sellExit and SignalDn and O2 < O4[1] then down else na; AddChartBubble(ExitShort, SignalDn, "Exit Short", CreateColor(0, 148, 255), no); def Long = if buySignal and SignalDn and O3 < O1[1] then down else na; AddChartBubble(Long, SignalDn, "Long Entry", Color.GREEN, no); def Short = if sellSignal and SignalUp and O4 < O2[1] then up else na; AddChartBubble(Short, SignalUp, "Short Entry", Color.RED, yes); #### Cloud def color1 = if ShowCloud and (Min(Min(O1, O2), O3) == O1) then 1 else na; def color2 = if ShowCloud and (Min(Min(O1, O2), O4) == O2) then 1 else na; AddCloud(if color1 then u else na, ExitLine, Color.DARK_GREEN); AddCloud(if color2 then ExitLine else na, l, Color.DARK_RED); ##### END
I noticed that the Short exit was turned off in the code. It should work properly now.@samer800 Code could have an error, testing the lower times frames like this chart on the 5 min for Globex futures and you will notice there's no short exit
Hi, Is it possible you can take another look at this code? It doesn't seem to be matching up with the (strategy) Example I only use this strategy on the Daily time frame-I just got a short entry lable on the chart but it is not reflected on the watch list?Here is the basic structure. Clean it up, and modify it to your needs.
If you are utilizing the MTF option, the watchlist will not match your charts.
The ToS platform does not support the use of multiple timeframes in Watchlists, Scans, Chart Alerts, Conditional Orders.
Turtle Trade Channels Watchlist
Shared Watchlist Link: http://tos.mx/LIHeKX5 Click here for --> Easiest way to load shared links
View attachment 17672
Ruby:#//@version=4 #//author: @kivancozbilgic #https://www.tradingview.com/script/pB5nv16J/ #study(title="Turtle Trade Channels Indicator", shorttitle="TuTCI" # Converted and modifiedTrueRange by Sam4COK@Samer800 - 08/2022 input EntryLength = 20; # "Entry Length" input ExitLength = 10; # "Exit Length" #barssince(Condition) => script barssince { input Condition = 0; def barssince = if Condition then 1 else barssince[1] + 1; plot return = barssince; } def TFLow = low; def TFHigh = high; def TFClose = close; def up = Highest(TFHigh, EntryLength); def down = Lowest(TFLow, EntryLength); def sup = Highest(TFHigh, ExitLength); def sdown = Lowest(TFLow, ExitLength); def K1 = if barssince(TFHigh >= up[1]) <= barssince(TFLow <= down[1]) then down else up; def K2 = If(barssince(TFHigh >= up[1]) <= barssince(TFLow <= down[1]), sdown, sup); def K3 = If(TFClose > K1, down, double.NaN); def K4 = If(TFClose < K1, up, double.NaN); def lower = Lowest(TFLow, EntryLength); def upper = Highest(TFHigh, EntryLength); def buySignal = TFHigh == upper[1] or TFHigh crosses above upper[1]; def sellSignal = TFLow == lower[1] or lower[1] crosses above TFLow; def buyExit = TFLow == sdown[1] or sdown[1] crosses above TFLow; def sellExit = TFHigh == sup[1] or TFHigh crosses above sup[1]; def O1 = barssince(buySignal); def O2 = barssince(sellSignal); def O3 = barssince(buyExit); def O4 = barssince(sellExit); def E1 = barssince(buySignal[1]); def E2 = barssince(sellSignal[1]); def E3 = barssince(buyExit[1]); def E4 = barssince(sellExit[1]); AddLabel(yes, if buyExit and O1 < O3[1] then "buyExit" else if sellExit and O2 < O4[1] then "sellExit" else if buySignal and O3 < O1[1] then "buySignal" else if sellSignal and O4 < O2[1] then "sellSignal" else " "); AssignBackgroundColor( if buyExit and O1 < O3[1] then color.red else if sellExit and O2 < O4[1] then color.dark_orange else if buySignal and O3 < O1[1] then color.green else if sellSignal and O4 < O2[1] then color.plum else color.light_gray);
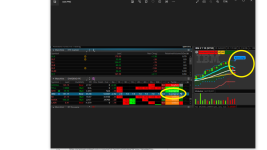
see attached image for example-- IBM signaling short on chart but watch list says buy signal?Hi, Is it possible you can take another look at this code? It doesn't seem to be matching up with the (strategy) Example I only use this strategy on the Daily time frame-I just got a short entry lable on the chart but it is not reflected on the watch list?
Attachments
Wonderful strategy, Thank you all
No, there is not a way to make the MTF indicator plot like the non-MTF due to the repainting of the MTFHi, Is it possible you can take another look at this code? It doesn't seem to be matching up with the (strategy) Example I only use this strategy on the Daily time frame-I just got a short entry lable on the chart but it is not reflected on the watch list?
see attached image for example-- IBM signaling short on chart but watch list says buy signal?
@samer800 Could you provide the code or make an update for a label on the chart for the upper left corner for Bullish when the system is a buy or Bearish when the system turns to a sell (for MTF as well if possible)?View attachment 15487
I added to the below more setting to remove/add lines and signals with option to use the indicator in different timeframe.
Release Note:
Legendary trade system which proved that great traders can be made, not born.
Turtle Trade Experiment made 80% annual return for 4 years and made 150 million $
Turtle Trade trend following system is a complete opposite to the "buy low and sell high" approach.
This trend following system was taught to a group of average and normal individuals, and almost everyone turned into a profitable trader.
They used the basis logic of well known DONCHIAN CHANNELS which developed by Richard Donchian .
The main rule is "Trade an 20-day breakout and take profits when an 10-day high or low is breached ". Examples:
Buy a 20-day breakout and close the trade when price action reaches a 10-day low.
Go short a 20-day breakout and close the trade when price action reaches a 10-day high.
In this indicator,
The red line is the trading line which indicates the trend direction:
Price bars over the trend line indicates uptrend
Price bars under the trend line means downtrend
The dotted blue line is the exit line.
Original system is:
Go long when the price High is equal to or above previous 20 day Highest price.
Go short when the price Low is equal to or below previous 20 day Lowest price.
Exit long positions when the price touches the exit line
Exit short positions when the price touches the exit line
Recommended initial stop-loss is ATR * 2 from the opening price.
Default system parameters were 20,10 and 55,20.
Original Turtle Rules:
To trade exactly like the turtles did, you need to set up two indicators representing the main and the failsafe system.
Set up the main indicator with EntryPeriod = 20 and ExitPeriod = 10 (A.k.a S1) (My comments: Good for Swing - Long timeframe)
Set up the failsafe indicator with EntryPeriod = 55 and ExitPeriod = 20 using a different color. (A.k.a S2) (My comment: Good for intraday - Short timeframe)
The entry strategy using S1 is as follows
Buy 20-day breakouts using S1 only if last signaled trade was a loss.
Sell 20-day breakouts using S1 only if last signaled trade was a loss.
If last signaled trade by S1 was a win, you shouldn't trade -Irregardless of the direction or if you traded last signal it or not-
The entry strategy using S2 is as follows:
Buy 55-day breakouts only if you ignored last S1 signal and the market is rallying without you
Sell 55-day breakouts only if you ignored last S1 signal and the market is pluging without you
You can Highlight the chart with provided trade signals:
Green cloud color when Long
Red cloud color when Short
No cloud color when flat
CSS:#//@version=4 #//author: @kivancozbilgic #https://www.tradingview.com/script/pB5nv16J/ #study(title="Turtle Trade Channels Indicator", shorttitle="TuTCI" # Converted and modifiedTrueRange by Sam4COK@Samer800 - 08/2022 input EntryLength = 20; # "Entry Length" input ExitLength = 10; # "Exit Length" input ShowLines = yes; # "Show Lines?" input showSignals = yes; # "Show Entry/Exit Signals ?" input SignalOnPrice = no; # "Show Entry/Exit Signals on Price?" input ShowCloud = yes; # "Highlighter On/Off ?" input UseChartTime = yes; # "Use Chart timeframe or Aggregation?" input aggregation = AggregationPeriod.DAY; def na = Double.NaN; #barssince(Condition) => script barssince { input Condition = 0; def barssince = if Condition then 1 else barssince[1] + 1; plot return = barssince; } #//MTF def TFLow; def TFHigh; def TFClose; if UseChartTime then { TFLow = low; TFHigh = high; TFClose = close; } else { TFLow = low(period = aggregation); TFHigh = high(period = aggregation); TFClose = close(period = aggregation); } def up = Highest(TFHigh, EntryLength); def down = Lowest(TFLow, EntryLength); def sup = Highest(TFHigh, ExitLength); def sdown = Lowest(TFLow, ExitLength); def K1 = if barssince(TFHigh >= up[1]) <= barssince(TFLow <= down[1]) then down else up; def K2 = If(barssince(TFHigh >= up[1]) <= barssince(TFLow <= down[1]), sdown, sup); def K3 = If(TFClose > K1, down, na); def K4 = If(TFClose < K1, up, na); plot TrendLine = K1; TrendLine.SetDefaultColor(CreateColor(255, 82, 82)); TrendLine.SetLineWeight(2); TrendLine.SetHiding(!ShowLines); plot ExitLine = K2; ExitLine.SetStyle(Curve.POINTS); ExitLine.SetDefaultColor(CreateColor(0, 148, 255)); ExitLine.SetHiding(!ShowLines); def lower = Lowest(TFLow, EntryLength); def upper = Highest(TFHigh, EntryLength); plot u = upper; plot l = lower; u.SetDefaultColor(CreateColor(0, 148, 255)); u.SetHiding(!ShowLines); l.SetDefaultColor(CreateColor(0, 148, 255)); l.SetHiding(!ShowLines); def buySignal = TFHigh == upper[1] or TFHigh crosses above upper[1]; def sellSignal = TFLow == lower[1] or lower[1] crosses above TFLow; def buyExit = TFLow == sdown[1] or sdown[1] crosses above TFLow; def sellExit = TFHigh == sup[1] or TFHigh crosses above sup[1]; def O1 = barssince(buySignal); def O2 = barssince(sellSignal); def O3 = barssince(buyExit); def O4 = barssince(sellExit); def E1 = barssince(buySignal[1]); def E2 = barssince(sellSignal[1]); def E3 = barssince(buyExit[1]); def E4 = barssince(sellExit[1]); plot LongExit = if buyExit and O1 < O3[1] then up else na; LongExit.SetPaintingStrategy(PaintingStrategy.POINTS); LongExit.SetDefaultColor(CreateColor(0, 148, 255)); LongExit.SetLineWeight(3); LongExit.SetHiding(!ShowLines); plot ShortExit = if sellExit and O2 < O4[1] then down else na; ShortExit.SetPaintingStrategy(PaintingStrategy.POINTS); ShortExit.SetDefaultColor(CreateColor(0, 148, 255)); ShortExit.SetLineWeight(3); ShortExit.SetHiding(!ShowLines); plot LongEntry = if buySignal and O3 < O1[1] then down else na; LongEntry.SetPaintingStrategy(PaintingStrategy.POINTS); LongEntry.SetDefaultColor(Color.GREEN); LongEntry.SetLineWeight(3); LongEntry.SetHiding(!ShowLines); plot ShortEntry = if sellSignal and O4 < O2[1] then up else na; ShortEntry.SetPaintingStrategy(PaintingStrategy.POINTS); ShortEntry.SetDefaultColor(CreateColor(255, 82, 82)); ShortEntry.SetLineWeight(3); ShortEntry.SetHiding(!ShowLines); #### Bubbles def SignalUp = if showSignals then if SignalOnPrice then high else up else na; def SignalDn = if showSignals then if SignalOnPrice then low else down else na; def ExitLong = if buyExit and SignalUp and O1 < O3[1] then up else na; AddChartBubble(ExitLong, SignalUp, "Exit Long", CreateColor(0, 148, 255), yes); def ExitShort = if sellExit and SignalDn and O2 < O4[1] then down else na; AddChartBubble(ExitShort, SignalDn, "Exit Short", CreateColor(0, 148, 255), no); def Long = if buySignal and SignalDn and O3 < O1[1] then down else na; AddChartBubble(Long, SignalDn, "Long Entry", Color.GREEN, no); def Short = if sellSignal and SignalUp and O4 < O2[1] then up else na; AddChartBubble(Short, SignalUp, "Short Entry", Color.RED, yes); #### Cloud def color1 = if ShowCloud and (Min(Min(O1, O2), O3) == O1) then 1 else na; def color2 = if ShowCloud and (Min(Min(O1, O2), O4) == O2) then 1 else na; AddCloud(if color1 then u else na, ExitLine, Color.DARK_GREEN); AddCloud(if color2 then ExitLine else na, l, Color.DARK_RED); ##### END
MatthewA
Active member
This is wonderful...Here's a decent write up on the Turtle method:
https://www.tradingsim.com/day-trading/would-the-turtle-trading-system-work-now
Especially the calming practice of being so balance that you only take a trade if the last trade FAILED ....

Of course this would not work with a coin toss as the odds of tossing a fair coin are always 50% heads 50% tails; and the odds of tossing a coin to get the same side multiple times are related to powers of 2....
The "turtle trading" implies that your methods and strategies are so balanced that you can enter with confidence after a trade failed and expect reasonable odds, rather than trying to investigate your model to worry about what went wrong...
Of course we don't have to copy the exact same model that the turtles used and we don't have to model an expectation of win, loss, win, loss as the turtles did.
We could go [ _____ market ] expect fake outs so enter after second failure....
(loss, do nothing win, loss, loss, enter win )
It truly doesn't get any less stressful than waiting for your strategy to fail while you are NOT in the market.@HODL-Lay-HE-hoo!
Last edited by a moderator:
dsvitale
New member
I got this indicator here.
https://usethinkscript.com/threads/turtle-trade-channels-indicator-tutci-for-thinkorswim.12231/
I am not sure how to change the bubbles that paint on the chart to just an arrow. Please help
Thank you
Vitale
https://usethinkscript.com/threads/turtle-trade-channels-indicator-tutci-for-thinkorswim.12231/
I am not sure how to change the bubbles that paint on the chart to just an arrow. Please help
Thank you
Vitale
Last edited by a moderator:
I got this indicator here.
https://usethinkscript.com/threads/turtle-trade-channels-indicator-tutci-for-thinkorswim.12231/
I am not sure how to change the bubbles that paint on the chart to just an arrow. Please help
Thank you
Vitale
These inputs added to the following code control the display of arrows and bubbles
input showarrows = yes;
input showexitbubbles = no;
input showsignalbubbles = no;
input showentrybubbles = no;

Code:#//@version=4 #//author: @kivancozbilgic #https://www.tradingview.com/script/pB5nv16J/ #study(title="Turtle Trade Channels Indicator", shorttitle="TuTCI" # Converted and modifiedTrueRange by Sam4COK@Samer800 - 08/2022 input EntryLength = 20; # "Entry Length" input ExitLength = 10; # "Exit Length" input ShowLines = yes; # "Show Lines?" input showSignals = yes; # "Show Entry/Exit Signals ?" input SignalOnPrice = no; # "Show Entry/Exit Signals on Price?" input ShowCloud = yes; # "Highlighter On/Off ?" input UseChartTime = yes; # "Use Chart timeframe or Aggregation?" input showarrows = yes; input showexitbubbles = no; input showsignalbubbles = no; input showentrybubbles = no; input aggregation = AggregationPeriod.DAY; def na = Double.NaN; #barssince(Condition) => script barssince { input Condition = 0; def barssince = if Condition then 1 else barssince[1] + 1; plot return = barssince; } #//MTF def TFLow; def TFHigh; def TFClose; if UseChartTime then { TFLow = low; TFHigh = high; TFClose = close; } else { TFLow = low(period = aggregation); TFHigh = high(period = aggregation); TFClose = close(period = aggregation); } def up = Highest(TFHigh, EntryLength); def down = Lowest(TFLow, EntryLength); def sup = Highest(TFHigh, ExitLength); def sdown = Lowest(TFLow, ExitLength); def K1 = if barssince(TFHigh >= up[1]) <= barssince(TFLow <= down[1]) then down else up; def K2 = If(barssince(TFHigh >= up[1]) <= barssince(TFLow <= down[1]), sdown, sup); def K3 = If(TFClose > K1, down, na); def K4 = If(TFClose < K1, up, na); plot TrendLine = K1; TrendLine.SetDefaultColor(CreateColor(255, 82, 82)); TrendLine.SetLineWeight(2); TrendLine.SetHiding(!ShowLines); plot ExitLine = K2; ExitLine.SetStyle(Curve.POINTS); ExitLine.SetDefaultColor(CreateColor(0, 148, 255)); ExitLine.SetHiding(!ShowLines); def lower = Lowest(TFLow, EntryLength); def upper = Highest(TFHigh, EntryLength); plot u = upper; plot l = lower; u.SetDefaultColor(CreateColor(0, 148, 255)); u.SetHiding(!ShowLines); l.SetDefaultColor(CreateColor(0, 148, 255)); l.SetHiding(!ShowLines); def buySignal = TFHigh == upper[1] or TFHigh crosses above upper[1]; def sellSignal = TFLow == lower[1] or lower[1] crosses above TFLow; def buyExit = TFLow == sdown[1] or sdown[1] crosses above TFLow; def sellExit = TFHigh == sup[1] or TFHigh crosses above sup[1]; def O1 = barssince(buySignal); def O2 = barssince(sellSignal); def O3 = barssince(buyExit); def O4 = barssince(sellExit); def E1 = barssince(buySignal[1]); def E2 = barssince(sellSignal[1]); def E3 = barssince(buyExit[1]); def E4 = barssince(sellExit[1]); plot LongExit = if buyExit and O1 < O3[1] then up else na; LongExit.SetPaintingStrategy(PaintingStrategy.POINTS); LongExit.SetDefaultColor(CreateColor(0, 148, 255)); LongExit.SetLineWeight(3); #LongExit.SetHiding(!ShowLines); plot ShortExit = if sellExit and O2 < O4[1] then down else na; ShortExit.SetPaintingStrategy(PaintingStrategy.POINTS); ShortExit.SetDefaultColor(CreateColor(0, 148, 255)); ShortExit.SetLineWeight(3); #ShortExit.SetHiding(!ShowLines); plot LongEntry = if buySignal and O3 < O1[1] then if !SignalOnPrice then down else low else na; LongEntry.SetPaintingStrategy(if !showarrows then na else PaintingStrategy.ARROW_UP); LongEntry.SetDefaultColor(Color.GREEN); LongEntry.SetLineWeight(3); #LongEntry.SetHiding(!ShowLines); plot ShortEntry = if sellSignal and O4 < O2[1] then if !SignalOnPrice then up else high else na; ShortEntry.SetPaintingStrategy(if !showarrows then na else PaintingStrategy.ARROW_DOWN); ShortEntry.SetDefaultColor(CreateColor(255, 82, 82)); ShortEntry.SetLineWeight(3); #ShortEntry.SetHiding(!ShowLines); #### Bubbles def SignalUp = if !showsignalbubbles then na else if showSignals then if SignalOnPrice then high else up else na; def SignalDn = if !showsignalbubbles then na else if showSignals then if SignalOnPrice then low else down else na; def ExitLong = if buyExit and SignalUp and O1 < O3[1] then up else na; AddChartBubble(if !showexitbubbles then na else ExitLong, SignalUp, "Exit Long", CreateColor(0, 148, 255), yes); def ExitShort = if sellExit and SignalDn and O2 < O4[1] then down else na; AddChartBubble(if !showexitbubbles then na else ExitShort, SignalDn, "Exit Short", CreateColor(0, 148, 255), no); def Long = if buySignal and SignalDn and O3 < O1[1] then down else na; AddChartBubble(if !showentrybubbles then na else Long, SignalDn, "Long Entry", Color.GREEN, no); def Short = if sellSignal and SignalUp and O4 < O2[1] then up else na; AddChartBubble(if !showentrybubbles then na else Short, SignalUp, "Short Entry", Color.RED, yes); #### Cloud def color1 = if ShowCloud and (Min(Min(O1, O2), O3) == O1) then 1 else na; def color2 = if ShowCloud and (Min(Min(O1, O2), O4) == O2) then 1 else na; AddCloud(if color1 then u else na, ExitLine, Color.DARK_GREEN); AddCloud(if color2 then ExitLine else na, l, Color.DARK_RED); ##### END
Last edited:
I appreciate this. Is it possible to separate the lines and the exit dots. When you click no for the lines the stop dots go away as well.
Fixed in above code. You can now move the arrows to be on the hidden lines or price.
What does "signal on price" (yes or no) in study parameters mean?
signal on price allows the bubble to appear on the candle instead of the trendline plot
Similar threads
-
Trade Ideas Intraday , single bar , Relative Volume RVOL For ThinkOrSwim
- Started by Svanoy
- Replies: 15
-

-
-
-
Not the exact question you're looking for?
Start a new thread and receive assistance from our community.
87k+
Posts
1899
Online
Similar threads
-
Trade Ideas Intraday , single bar , Relative Volume RVOL For ThinkOrSwim
- Started by Svanoy
- Replies: 15
-
-
-
-
Similar threads
-
Trade Ideas Intraday , single bar , Relative Volume RVOL For ThinkOrSwim
- Started by Svanoy
- Replies: 15
-
-
-
-
The Market Trading Game Changer
Join 2,500+ subscribers inside the useThinkScript VIP Membership Club
- Exclusive indicators
- Proven strategies & setups
- Private Discord community
- ‘Buy The Dip’ signal alerts
- Exclusive members-only content
- Add-ons and resources
- 1 full year of unlimited support
Frequently Asked Questions
What is useThinkScript?
useThinkScript is the #1 community of stock market investors using indicators and other tools to power their trading strategies. Traders of all skill levels use our forums to learn about scripting and indicators, help each other, and discover new ways to gain an edge in the markets.
How do I get started?
We get it. Our forum can be intimidating, if not overwhelming. With thousands of topics, tens of thousands of posts, our community has created an incredibly deep knowledge base for stock traders. No one can ever exhaust every resource provided on our site.
If you are new, or just looking for guidance, here are some helpful links to get you started.
- The most viewed thread:
https://usethinkscript.com/threads/repainting-trend-reversal-for-thinkorswim.183/ - Our most popular indicator:
https://usethinkscript.com/threads/buy-the-dip-indicator-for-thinkorswim.3553/ - Answers to frequently asked questions:
https://usethinkscript.com/threads/answers-to-commonly-asked-questions.6006/
What are the benefits of VIP Membership?
VIP members get exclusive access to these proven and tested premium indicators: Buy the Dip, Advanced Market Moves 2.0, Take Profit, and Volatility Trading Range. In addition, VIP members get access to over 50 VIP-only custom indicators, add-ons, and strategies, private VIP-only forums, private Discord channel to discuss trades and strategies in real-time, customer support, trade alerts, and much more. Learn all about VIP membership here.
How can I access the premium indicators?
To access the premium indicators, which are plug and play ready, sign up for VIP membership here.