You should upgrade or use an alternative browser.
Trust The Levels - Trade Options In ThinkOrSwim
- Thread starter METAL
- Start date
- Status
- Not open for further replies.
I had an idea to make you a label for your entry trigger. I am trading the LRC also- so this model is very fun for me. I trade futures. My friend Guava helped me polish it up syntax-wise... trigger 1= your risky entry (close >20EMA and <200 EMA for bull and opposite for bear.) trigger 2 is the safe entry (close > both 20 and 200 for bull) or the reverse for bear. Going to work on adding crossing the LRC lines- they are red and green to show direction.Did you trade spy at 9:50
I added a stacked emas (20/50/200) on the daily label as I like to trade the cantilever of the daily against the smaller timelines in futures. I would prob add an adx label as well.
http://tos.mx/!XhA7mVga entry trigger label (UPDATED!)
http://tos.mx/!giPE8JDb daily 20/50/200 stacked emas label
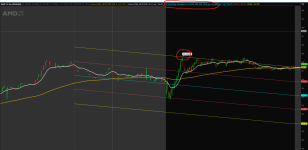
http://tos.mx/na9nCSA the chart in the picture
With this ticker and daily stacked Bull EMAs - I'd be looking at the LRC channel lines andkeeping an eye for adx/dmi to line up for upside on the hourly and seek 2m long/green triggers for entry.
Will work on adding close crossing the lines - I am not a coder- so bear with me...
Here is updated code for the trigger label it is working perfectly now..
#2m trigger Label for Metal's entry in LRC scalp model
def stackedPositive = expAverage(close(period=aggregationPeriod.day),20) > expAverage(close(period=aggregationPeriod.day),50) and expAverage(close(period=aggregationPeriod.day),200) ;
def stackedNegative = expAverage(close(period=aggregationPeriod.day),20) < expAverage(close(period=aggregationPeriod.day),50) and expAverage(close(period=aggregationPeriod.day),200);
addLabel(yes, "20/50/200 D Stacked", if stackedPositive then color.green else if stackedNegative then color.red else color.gray);
Nice additions, but please check your first 2 links. They appear to be the same when loaded. Thanks!I thought of a question you are tracking the 20 50 and 200 EMAs to guide entry.
I had an idea to make you a label for your entry trigger. I am trading the LRC also- so this model is very fun for me. I trade futures. My friend Guava helped me polish it up syntax-wise... trigger 1= your risky entry (close >20EMA and <200 EMA for bull and opposite for bear.) trigger 2 is the safe entry (close > both 20 and 200 for bull) or the reverse for bear. Going to work on adding crossing the LRC lines- they are red and green to show direction.
I added a stacked emas (20/50/200) on the daily label as I like to trade the cantilever of the daily against the smaller timelines in futures. I would prob add an adx label as well.
http://tos.mx/8bzhXNa entry trigger label
http://tos.mx/5Y1UQ6K daily 20/50/200 stacked emas label
http://tos.mx/na9nCSA the chart in the picture
With this ticker and daily stacked Bull EMAs - I'd be looking at the LRC channel lines andkeeping an eye for adx/dmi to line up for upside on the hourly and seek 2m long/green triggers for entry.
Will work on adding close crossing the lines - I am not a coder- so bear with me...
Awesome! ThanksI thought of a question you are tracking the 20 50 and 200 EMAs to guide entry.
I had an idea to make you a label for your entry trigger. I am trading the LRC also- so this model is very fun for me. I trade futures. My friend Guava helped me polish it up syntax-wise... trigger 1= your risky entry (close >20EMA and <200 EMA for bull and opposite for bear.) trigger 2 is the safe entry (close > both 20 and 200 for bull) or the reverse for bear. Going to work on adding crossing the LRC lines- they are red and green to show direction.
I added a stacked emas (20/50/200) on the daily label as I like to trade the cantilever of the daily against the smaller timelines in futures. I would prob add an adx label as well.
http://tos.mx/8bzhXNa entry trigger label
http://tos.mx/5Y1UQ6K daily 20/50/200 stacked emas label
http://tos.mx/na9nCSA the chart in the picture
With this ticker and daily stacked Bull EMAs - I'd be looking at the LRC channel lines andkeeping an eye for adx/dmi to line up for upside on the hourly and seek 2m long/green triggers for entry.
Will work on adding close crossing the lines - I am not a coder- so bear with me...
I am trying to stay away from too many indicators, however, I would like to see how the DMI and ADX may help. So far I have not had a losing day with this strat. I know that sounds impossible, but it is true. I even had a TOS issue this morning on a META trade that I should have profited at a minimum 350.00 but the sell market, Limit would not work for about 6 minutes. I had to start a new instance of TOS and finally got the market sell to work. I lost 1,877.00 on that trade. I ended the day with 298.00 positive even with that set back. I got in a TSLA PUT that I exited at 300%. I hope more people are using this as it works. Really the first consistent strategy I have used. Thank you for the additions! Have a great weekend everyone.I thought of a question you are tracking the 20 50 and 200 EMAs to guide entry.
I had an idea to make you a label for your entry trigger. I am trading the LRC also- so this model is very fun for me. I trade futures. My friend Guava helped me polish it up syntax-wise... trigger 1= your risky entry (close >20EMA and <200 EMA for bull and opposite for bear.) trigger 2 is the safe entry (close > both 20 and 200 for bull) or the reverse for bear. Going to work on adding crossing the LRC lines- they are red and green to show direction.
I added a stacked emas (20/50/200) on the daily label as I like to trade the cantilever of the daily against the smaller timelines in futures. I would prob add an adx label as well.
http://tos.mx/8bzhXNa entry trigger label
http://tos.mx/5Y1UQ6K daily 20/50/200 stacked emas label
http://tos.mx/na9nCSA the chart in the picture
With this ticker and daily stacked Bull EMAs - I'd be looking at the LRC channel lines andkeeping an eye for adx/dmi to line up for upside on the hourly and seek 2m long/green triggers for entry.
Will work on adding close crossing the lines - I am not a coder- so bear with me...
texas_trader
New member
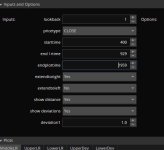
Can you please update the link to the code used for the Multiday LRC on the first page? I have used the existing link from the first page and my 5D2min chart shows slightly different lines/levels than yours, also the study parameters seem to be different, hence this request.Todays Trades:
View attachment 21696
I haven't had a loss in a day since I started using this strategy. I have had losses but not for the day. Is that what you are referring to?
If so, I decided to just show the actual trades because I feel that profit amount should not matter as each traders risk is different. For this trade I profited $1,773.00 I also traded a TSLA and lost 437.00 because I did not follow my rules. I should have only lost around $125.00 if i had stuck to my rules. I traded SPX mid day and made $727.00
Attachments
JOSHTHEBANKER
Member
Hi Sir, pls can you the chart where entered. ThanksAwesome! That is what I am talking about. It is the easiest most consistent system I have ever used. I Got TSLA today for $1,400.00, NVDA and SPX for a $1,933.00 total today.
trendtraderflow
New member
Cheers !! your set up has zero lag !! love it !! great work !!No. It is actually based off of Pre Market so it will not work with Pre market off.
adriantran
New member
Would be helpful to uncover some patterns so that we have additional entry criteria using the LRC.
It's just really hard to backtest since the LRC only applies to the current day. Is there any way to adjust it so it applies to each day independently?
Yes. If you are in eastern standard time. If you are not, then you will need to adjust.is this the correct start/stop time for this ?\
ideas for start time to use for futures?Yes. If you are in eastern standard time. If you are not, then you will need to adjust.
I just reloaded the middle label which was stacked EMAS- hope that fixes the issue.Nice additions, but please check your first 2 links. They appear to be the same when loaded. Thanks!
https://usethinkscript.com/threads/...tions-in-thinkorswim.18367/page-4#post-140739
Thinkscript uses Eastern Time Zone times in coding.is this the correct start/stop time for this ?\
So for all chart timeframes using the LRC, 0400-0929 is the correct Premarket time settings for stocks.
what would you try if using this for futures?Thinkscript uses Eastern Time Zone times in coding.
So for all chart timeframes using the LRC, 0400-0929 is the correct Premarket time settings for stocks.
what would you try if using this for futures?
1800 - 0929
- Status
- Not open for further replies.
Join useThinkScript to post your question to a community of 21,000+ developers and traders.
Similar threads
-
Money Zone Auto Fib Levels For ThinkOrSwim
- Started by BrooklynMintCapital
- Replies: 12
-
Hourly CCI -200/200 levels For ThinkOrSwim
- Started by autoloader
- Replies: 3
-
Swing Trade Stocks Outperforming Market In ThinkOrSwim
- Started by tellyt
- Replies: 15
-
Not the exact question you're looking for?
Start a new thread and receive assistance from our community.
Similar threads
-
Money Zone Auto Fib Levels For ThinkOrSwim
- Started by BrooklynMintCapital
- Replies: 12
-
Hourly CCI -200/200 levels For ThinkOrSwim
- Started by autoloader
- Replies: 3
-
Swing Trade Stocks Outperforming Market In ThinkOrSwim
- Started by tellyt
- Replies: 15
-
Similar threads
-
Money Zone Auto Fib Levels For ThinkOrSwim
- Started by BrooklynMintCapital
- Replies: 12
-
Hourly CCI -200/200 levels For ThinkOrSwim
- Started by autoloader
- Replies: 3
-
Swing Trade Stocks Outperforming Market In ThinkOrSwim
- Started by tellyt
- Replies: 15
-
The Market Trading Game Changer
- Exclusive indicators
- Proven strategies & setups
- Private Discord community
- ‘Buy The Dip’ signal alerts
- Exclusive members-only content
- Add-ons and resources
- 1 full year of unlimited support
Frequently Asked Questions
useThinkScript is the #1 community of stock market investors using indicators and other tools to power their trading strategies. Traders of all skill levels use our forums to learn about scripting and indicators, help each other, and discover new ways to gain an edge in the markets.
We get it. Our forum can be intimidating, if not overwhelming. With thousands of topics, tens of thousands of posts, our community has created an incredibly deep knowledge base for stock traders. No one can ever exhaust every resource provided on our site.
If you are new, or just looking for guidance, here are some helpful links to get you started.
- The most viewed thread:
https://usethinkscript.com/threads/repainting-trend-reversal-for-thinkorswim.183/ - Our most popular indicator:
https://usethinkscript.com/threads/buy-the-dip-indicator-for-thinkorswim.3553/ - Answers to frequently asked questions:
https://usethinkscript.com/threads/answers-to-commonly-asked-questions.6006/


