Brettser16
New member
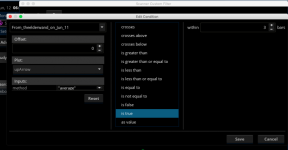
I was wondering if there was a way for this to send me an alert with the bell sound when one stock hits the reversal sign?

VTR is a momentum indicator that shows if a stock is overbought or oversold based on its Weekly and Monthly average volatility trading range.
| Thread starter | Similar threads | Forum | Replies | Date |
|---|---|---|---|---|
|
|
Repaints Enhanced Trend Reversal Indicator for ThinkorSwim | Indicators | 115 | |
|
|
Reversal Candles (Saikou / Hikui) Trend Change for ThinkorSwim | Indicators | 10 | |
|
|
L3 Banker Fund Flow Trend Oscillator for ThinkOrSwim | Indicators | 28 | |
|
|
Trend Meter For ThinkOrSwim | Indicators | 19 | |
|
|
Donchian Trend Ribbon For ThinkOrSwim | Indicators | 18 |
useThinkScript is the #1 community of stock market investors using indicators and other tools to power their trading strategies. Traders of all skill levels use our forums to learn about scripting and indicators, help each other, and discover new ways to gain an edge in the markets.
We get it. Our forum can be intimidating, if not overwhelming. With thousands of topics, tens of thousands of posts, our community has created an incredibly deep knowledge base for stock traders. No one can ever exhaust every resource provided on our site.
If you are new, or just looking for guidance, here are some helpful links to get you started.