The Confirmation Trend Chart Setup | The End All Be All | For ThinkOrSwim

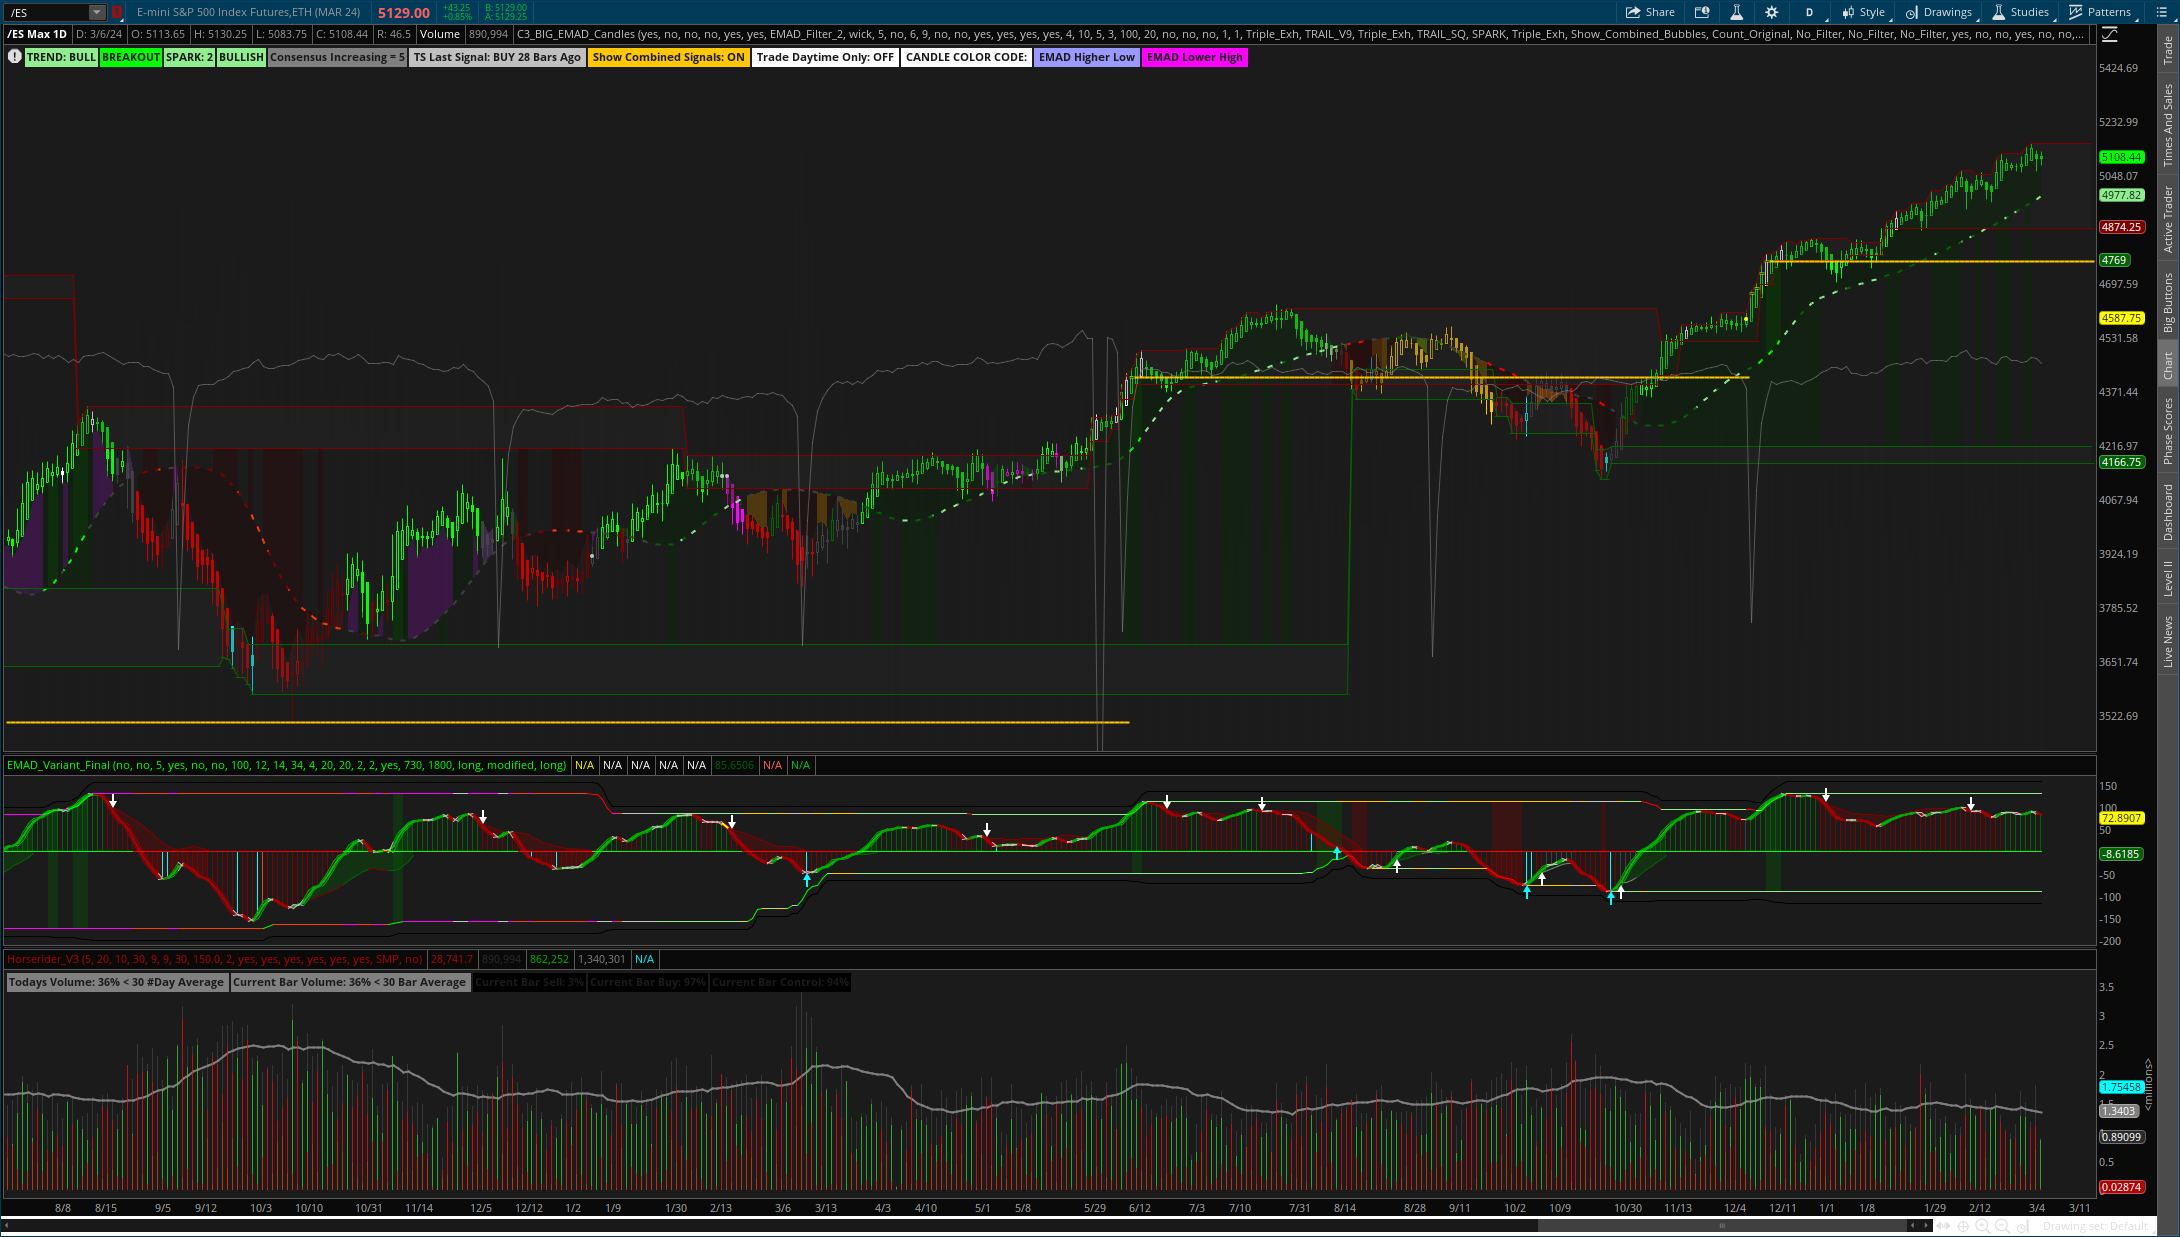
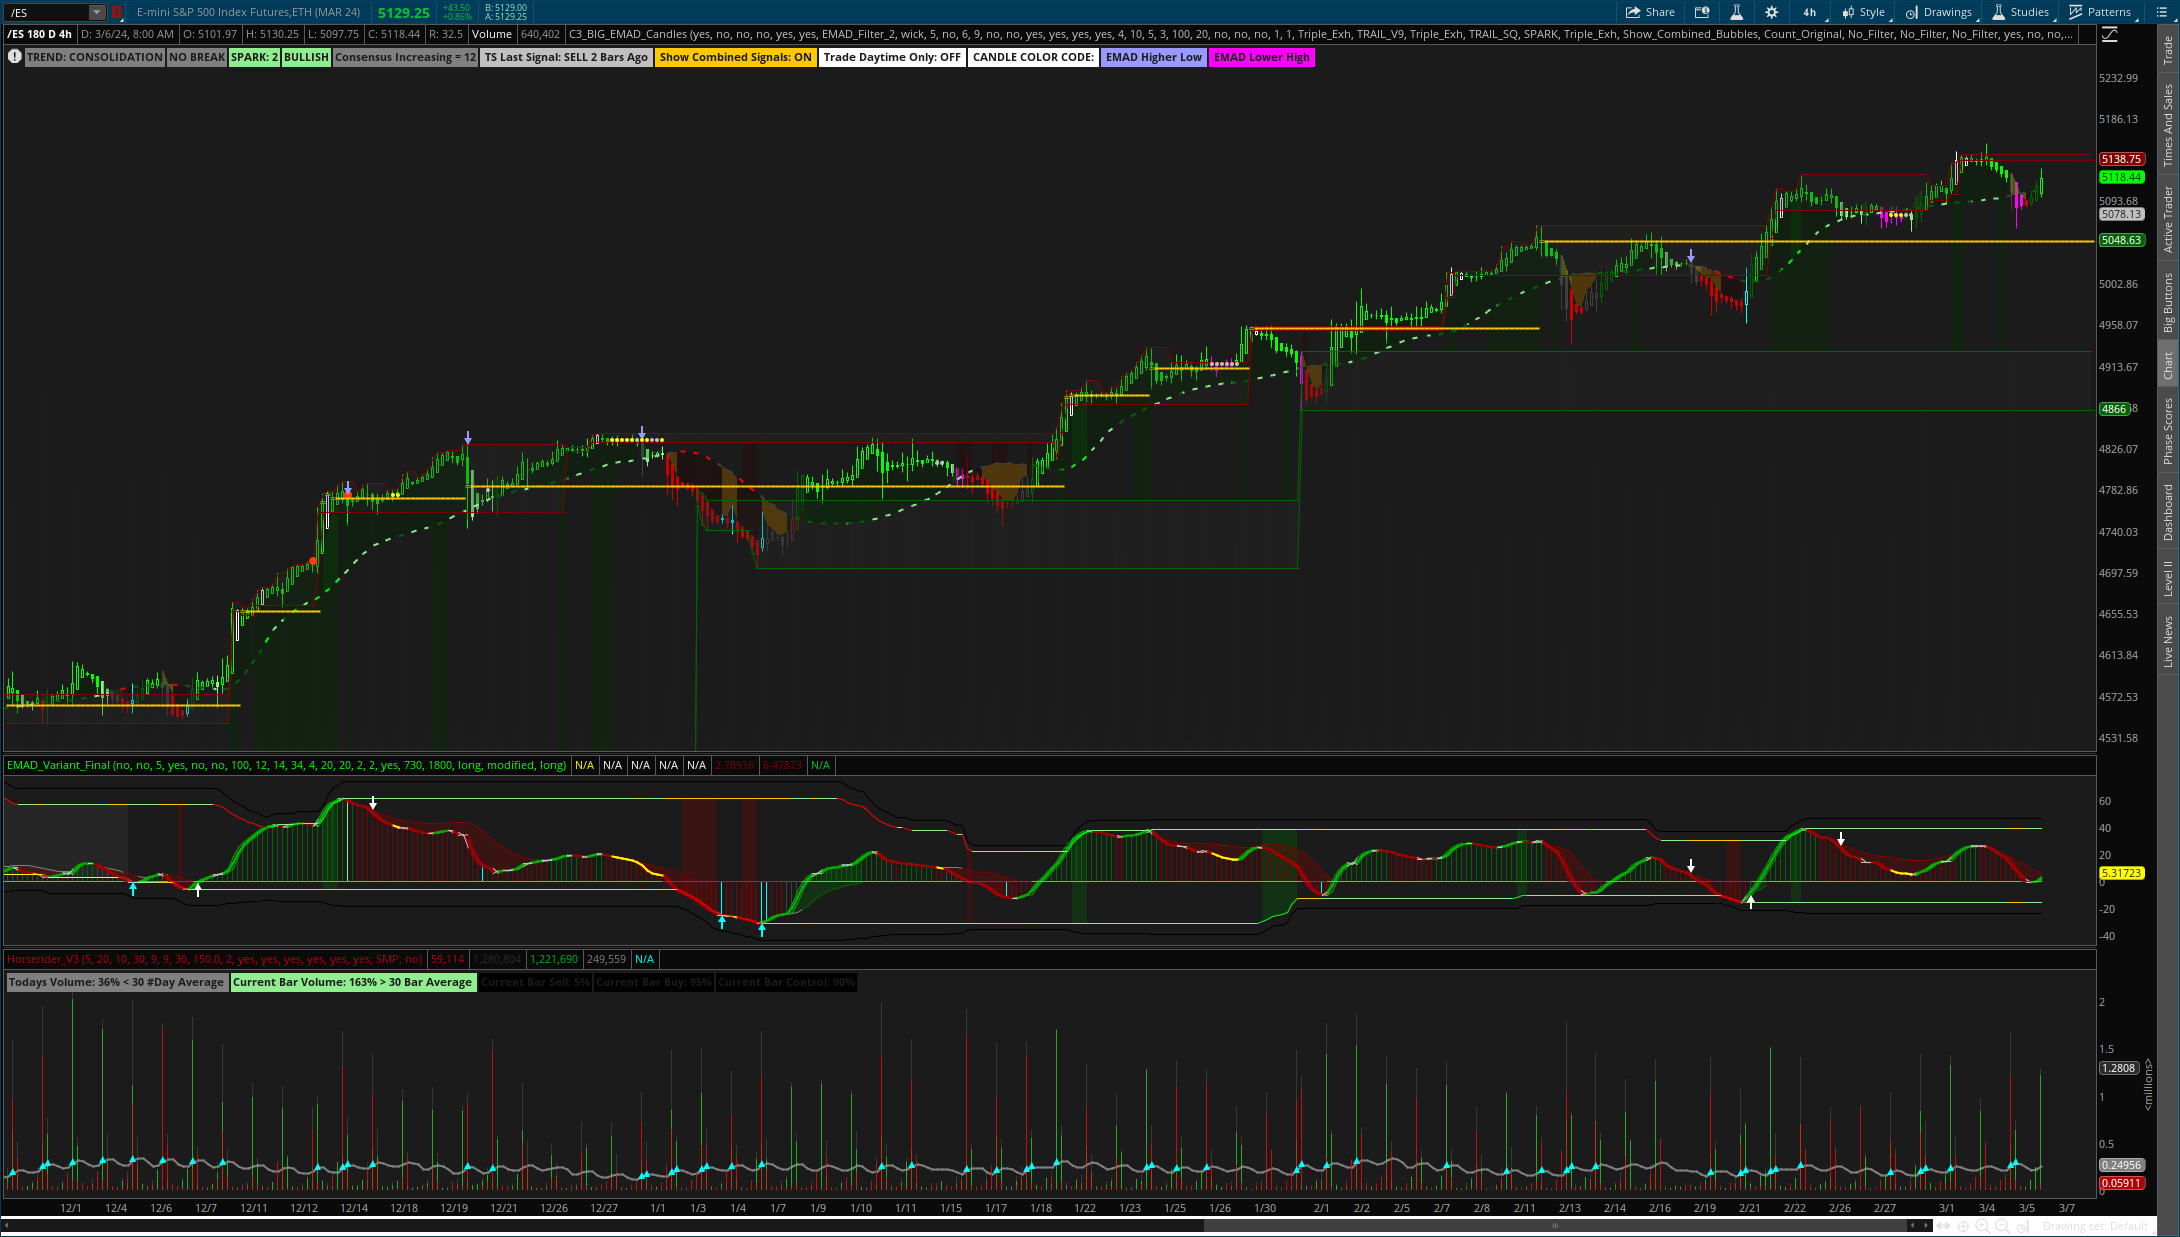
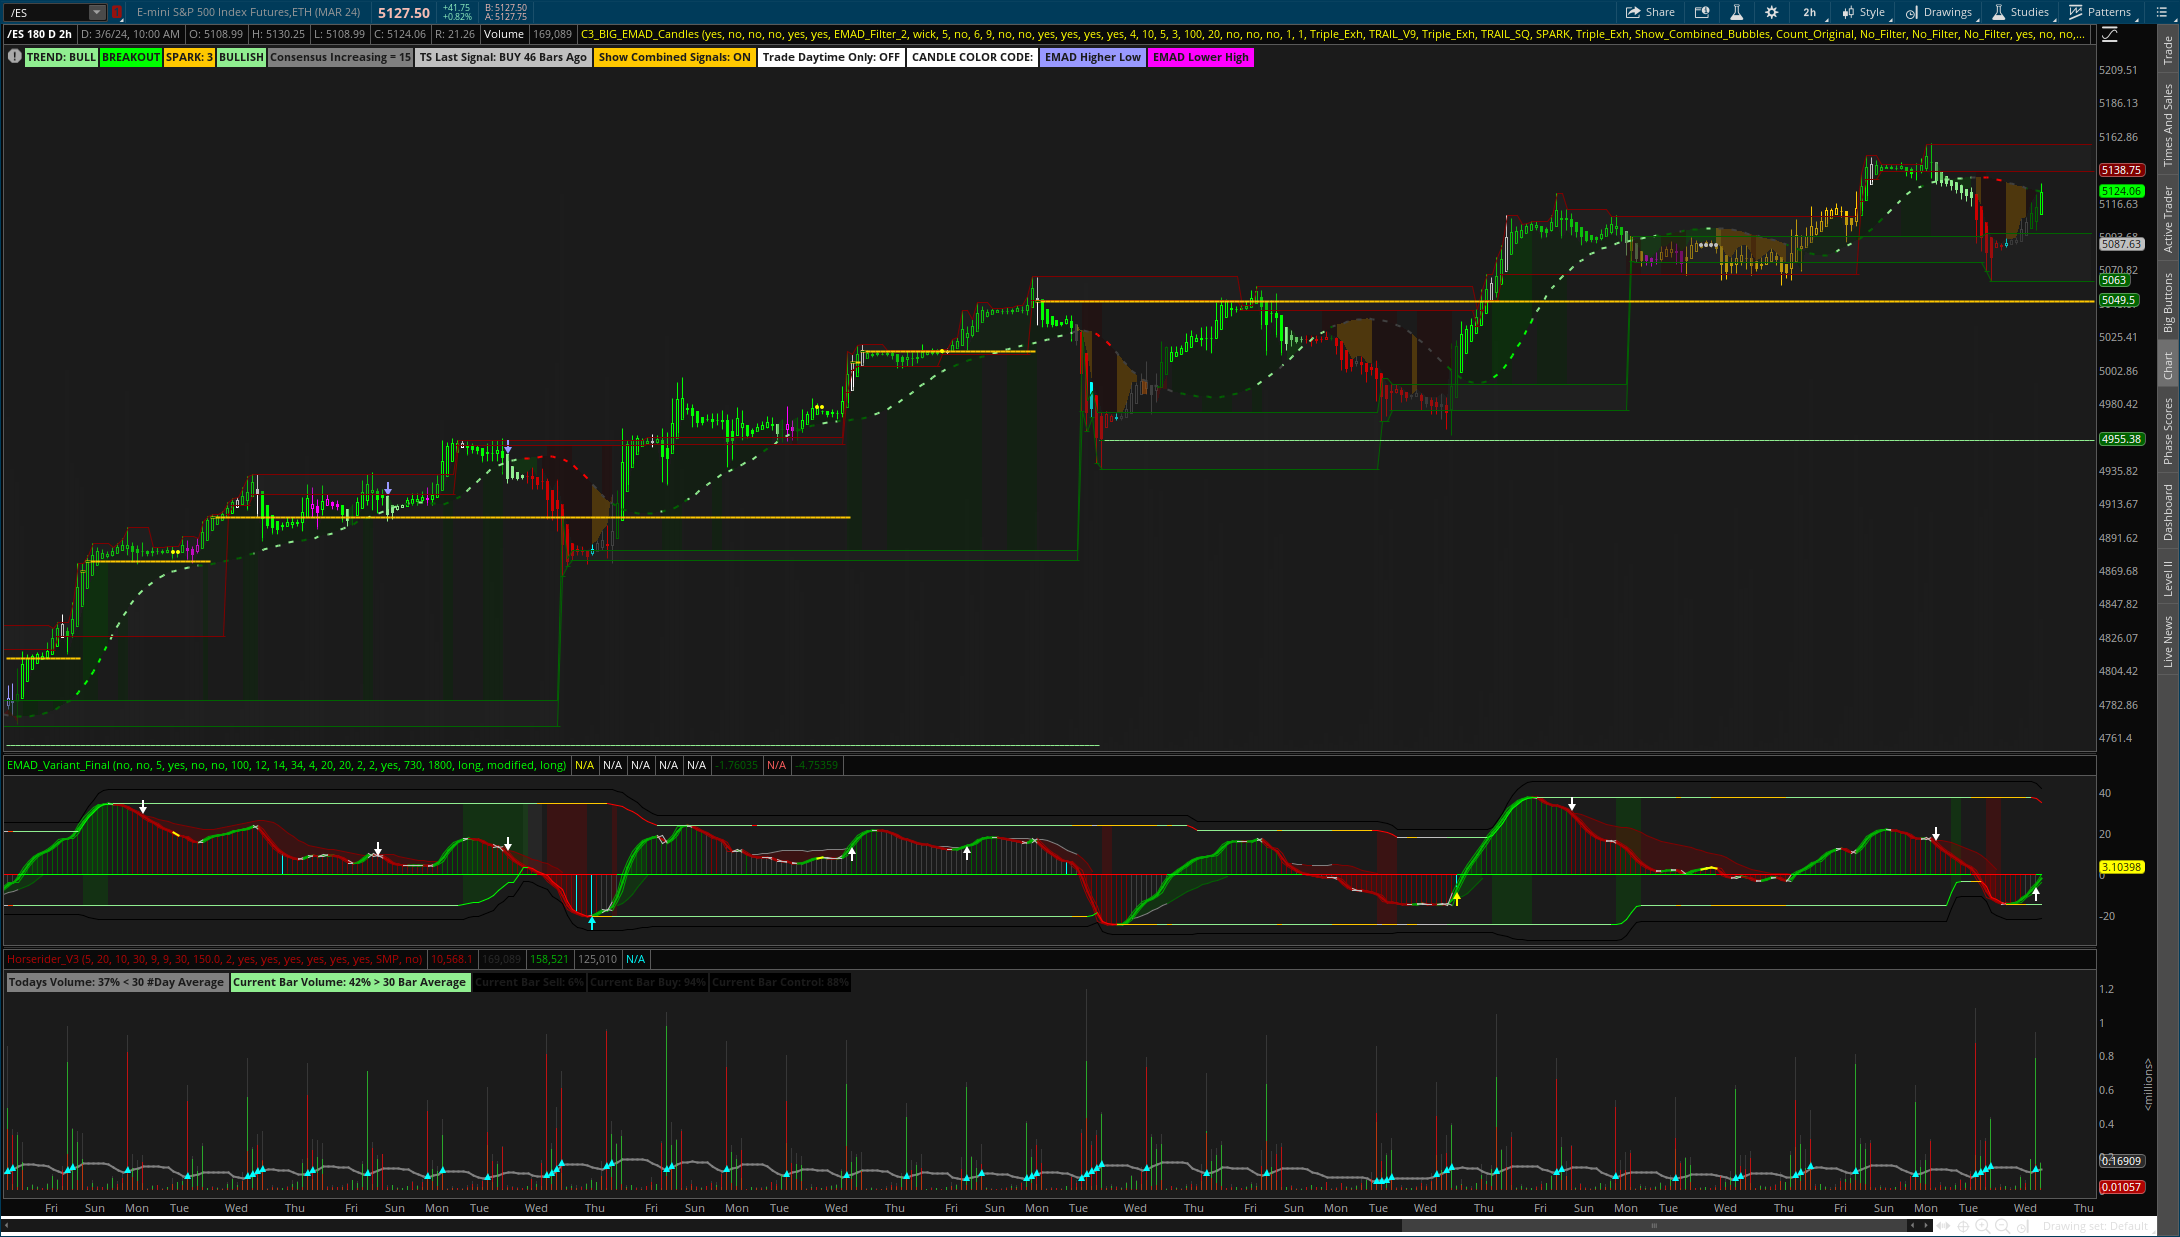
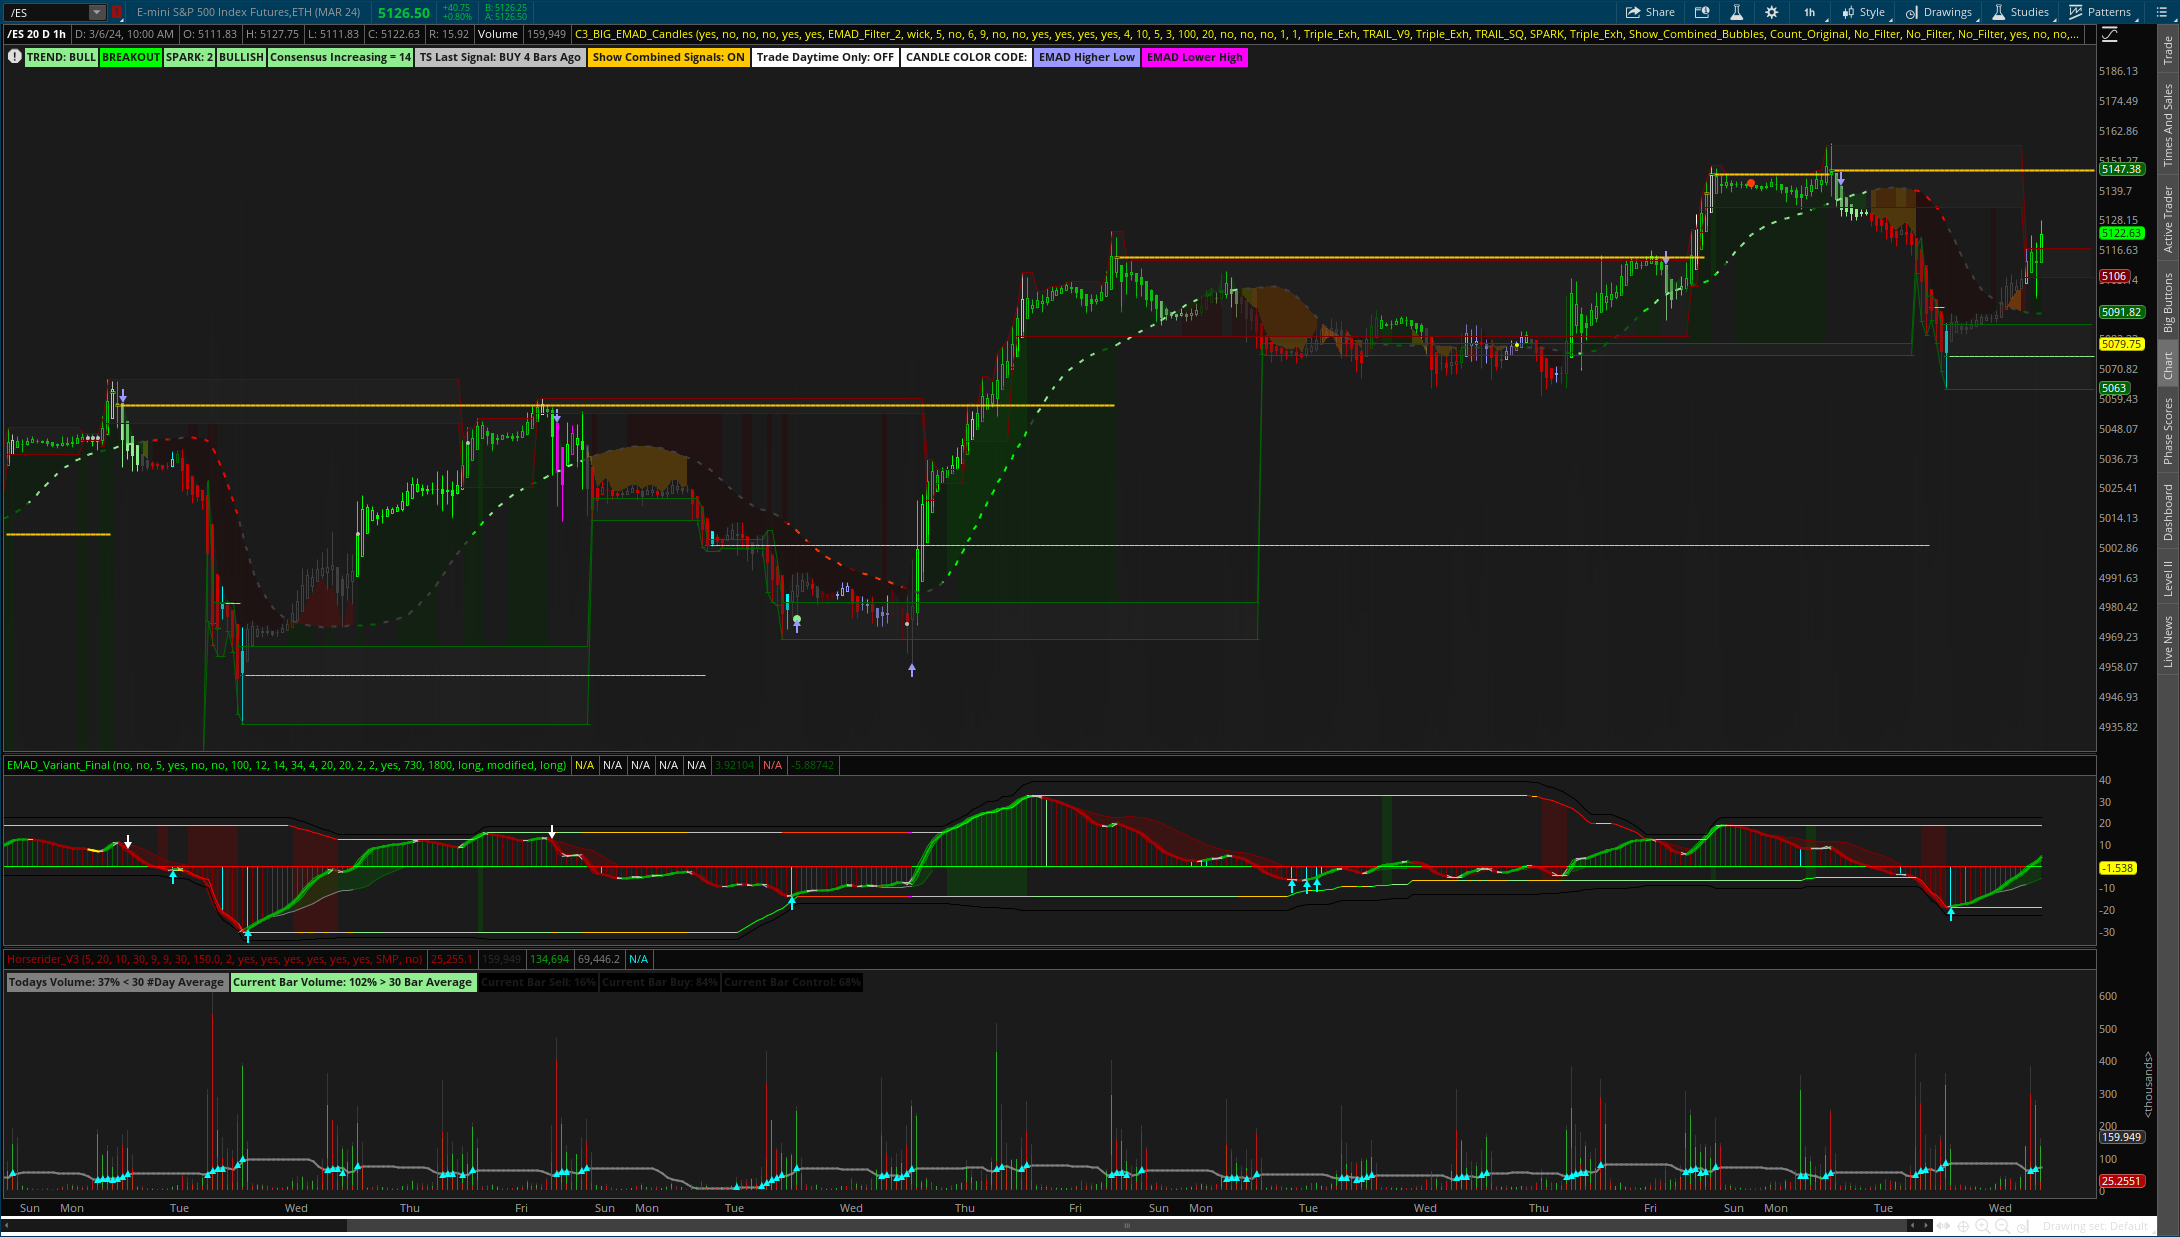
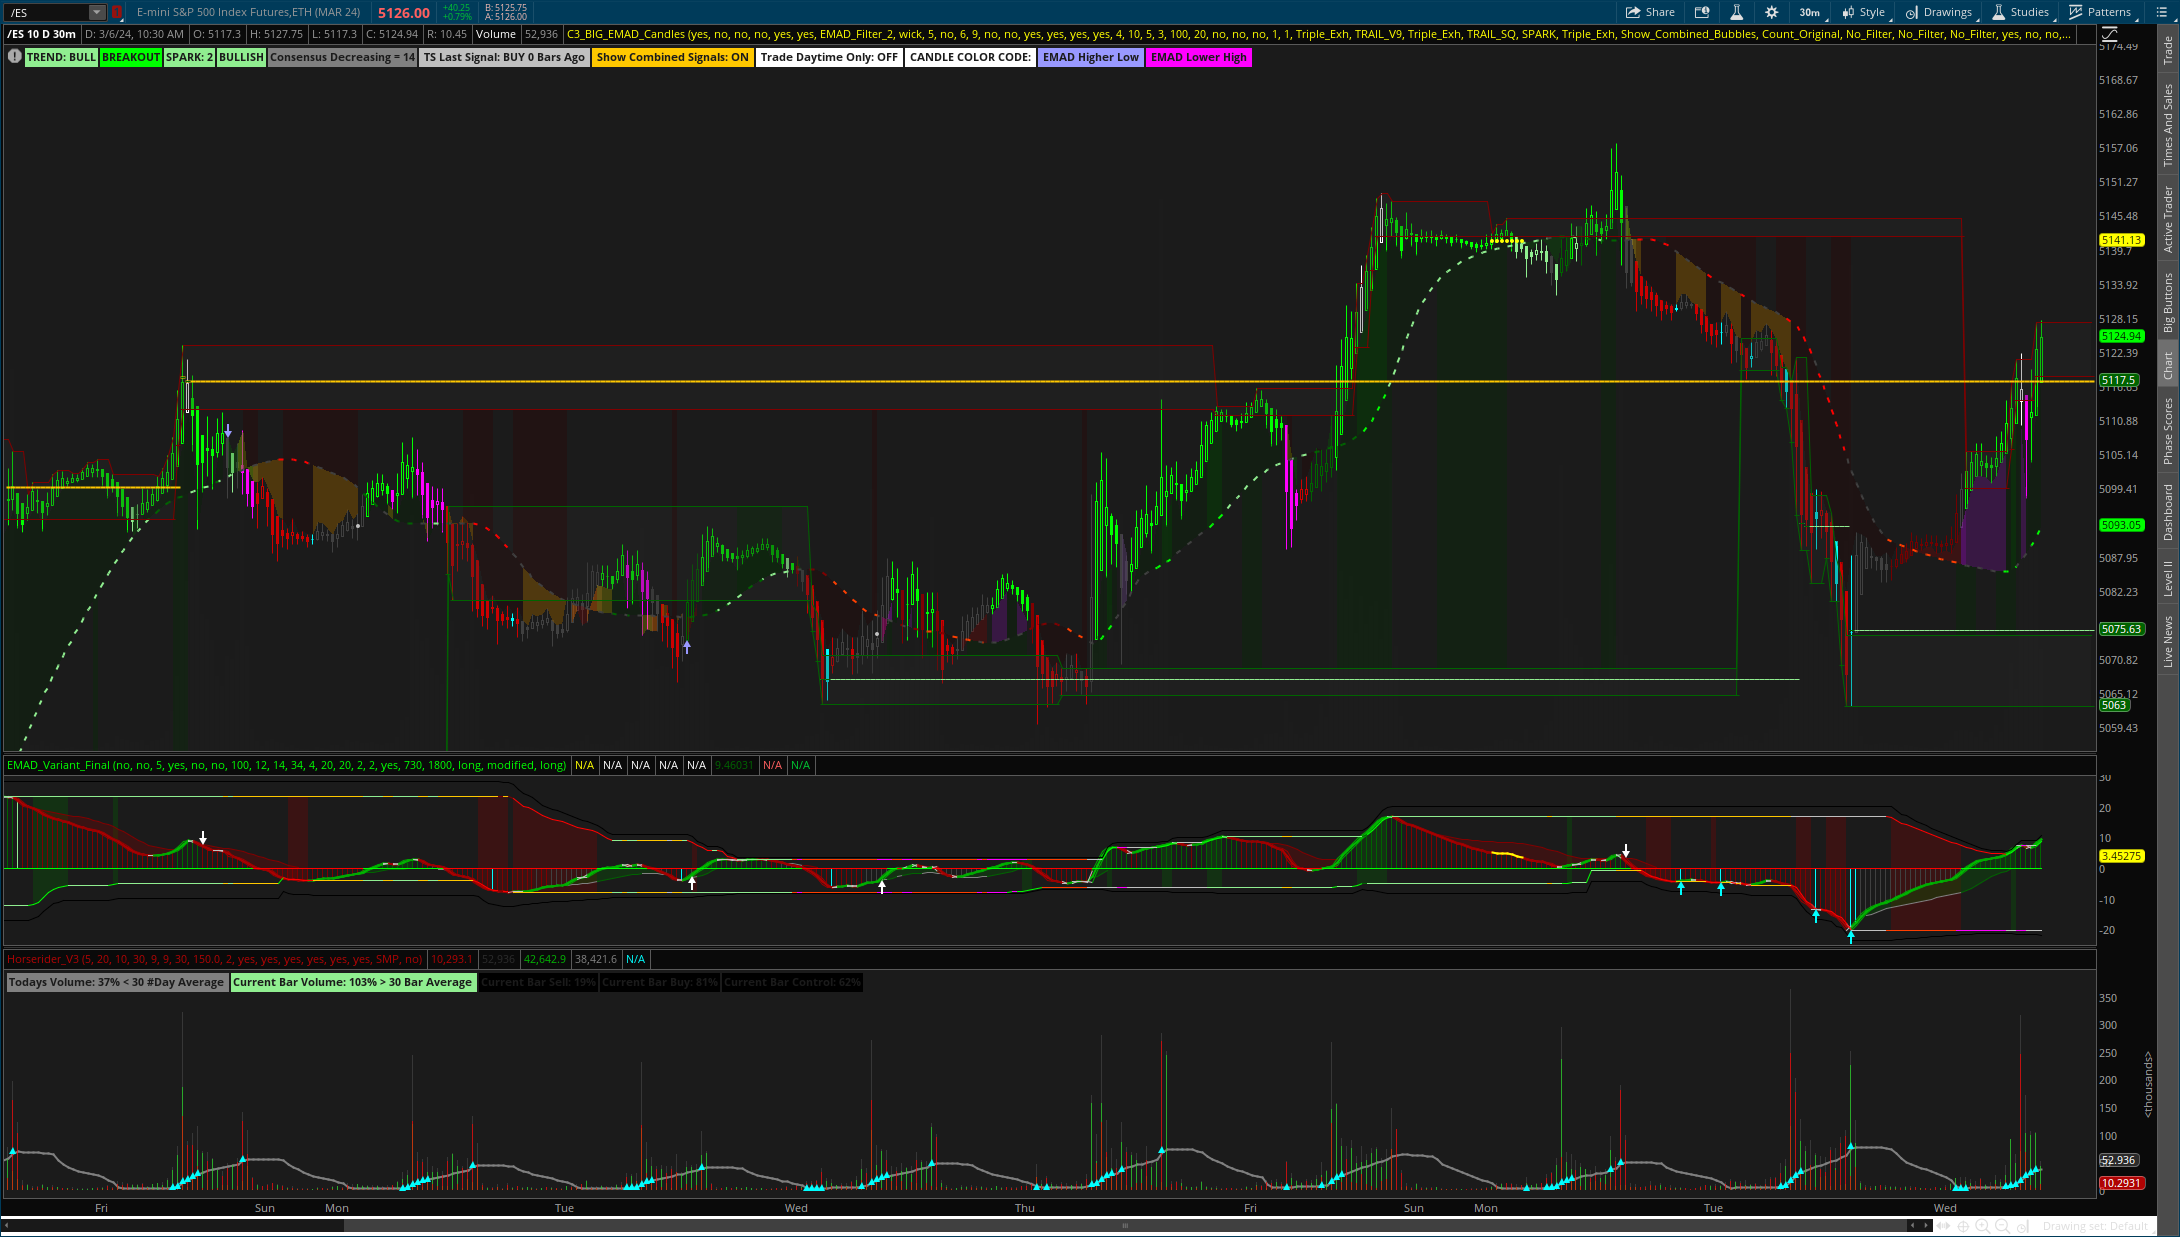
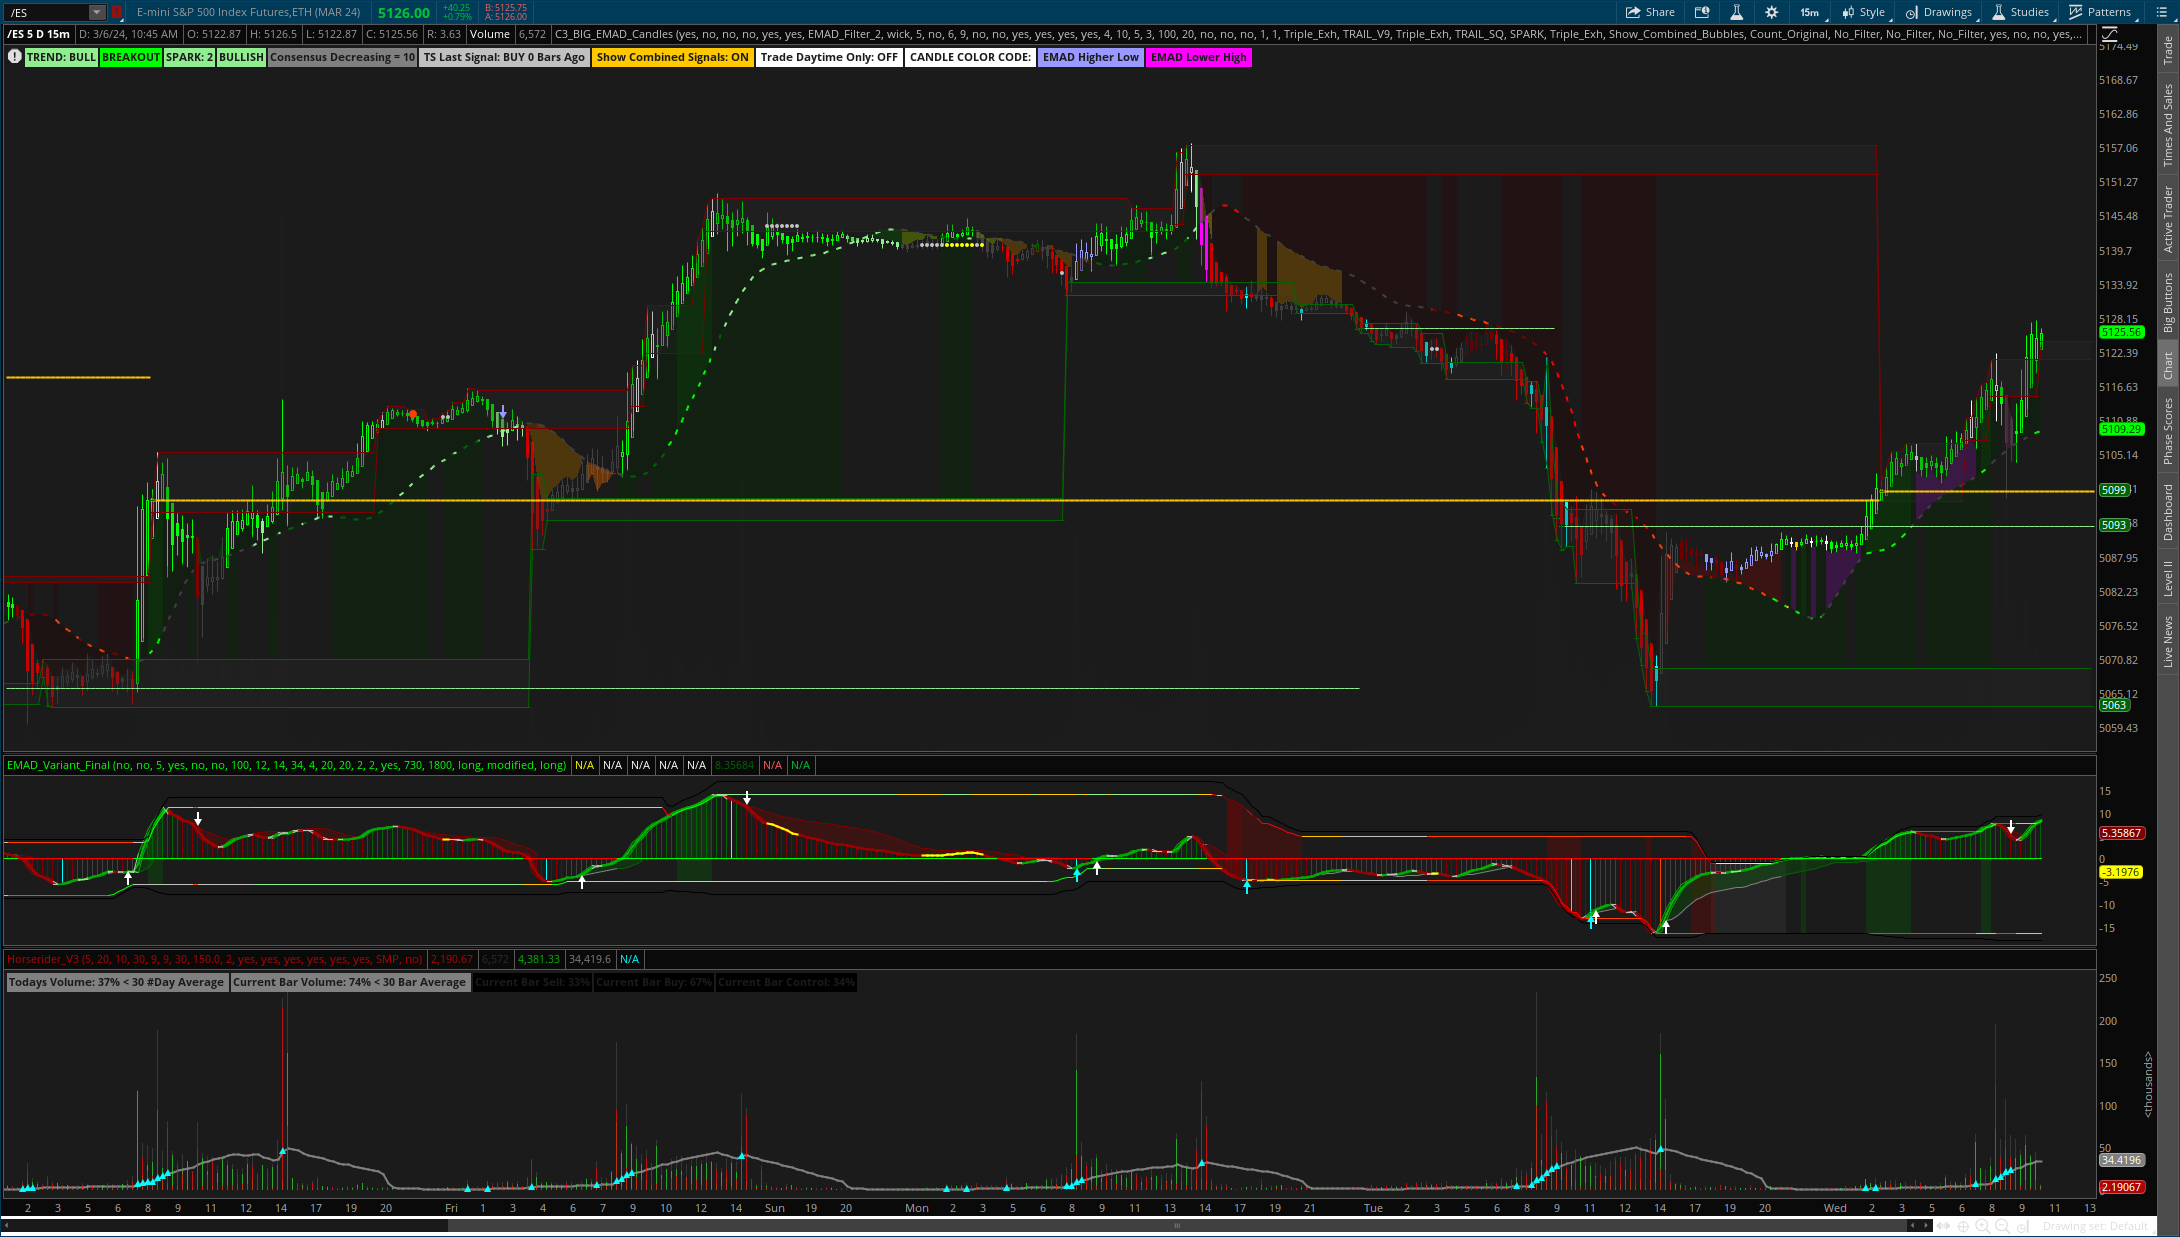
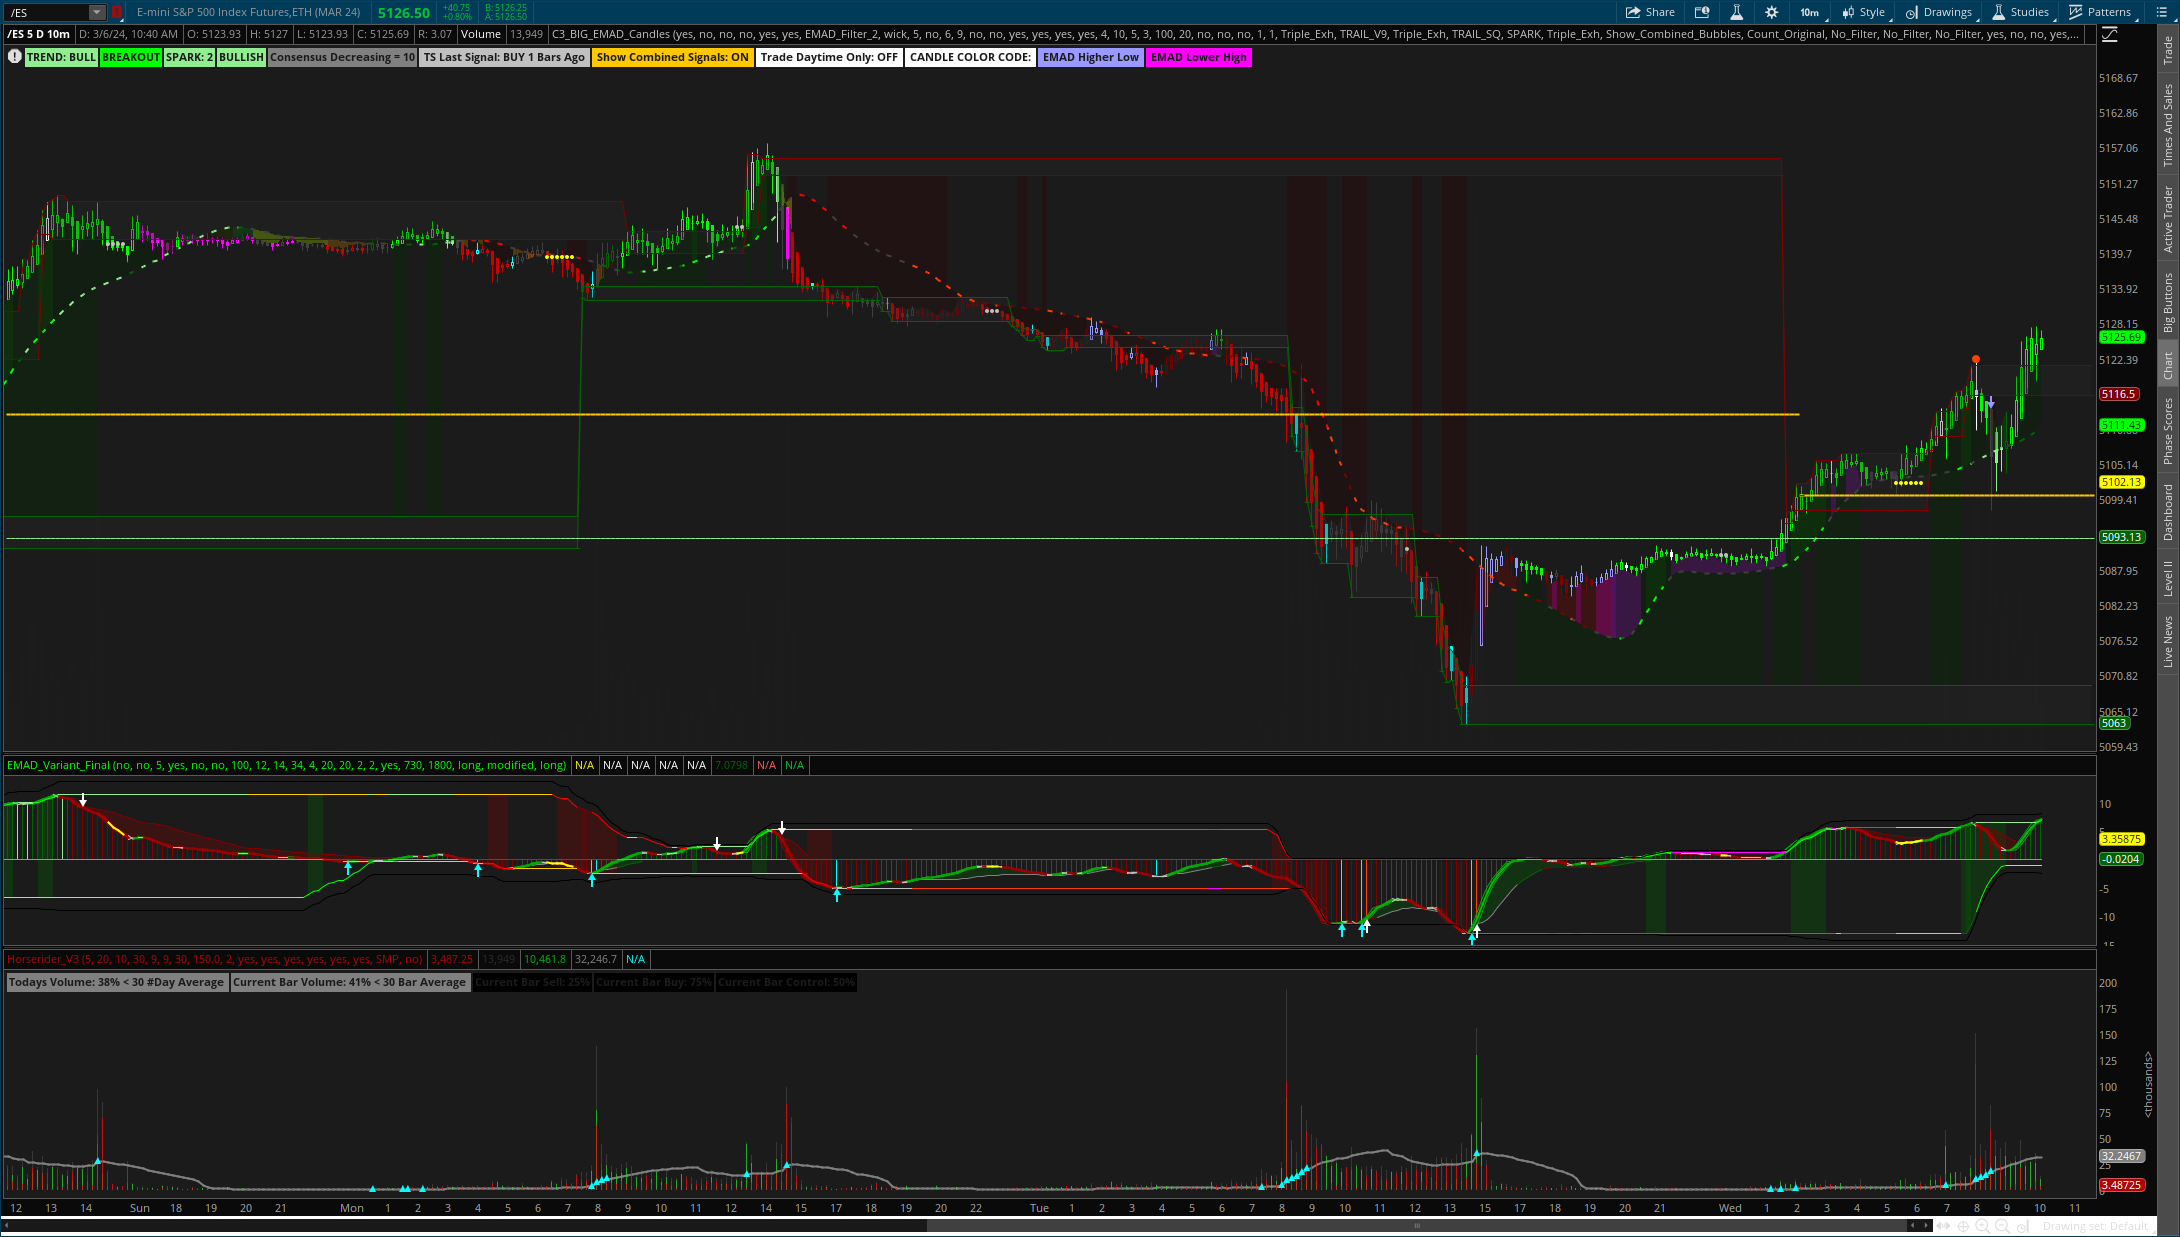
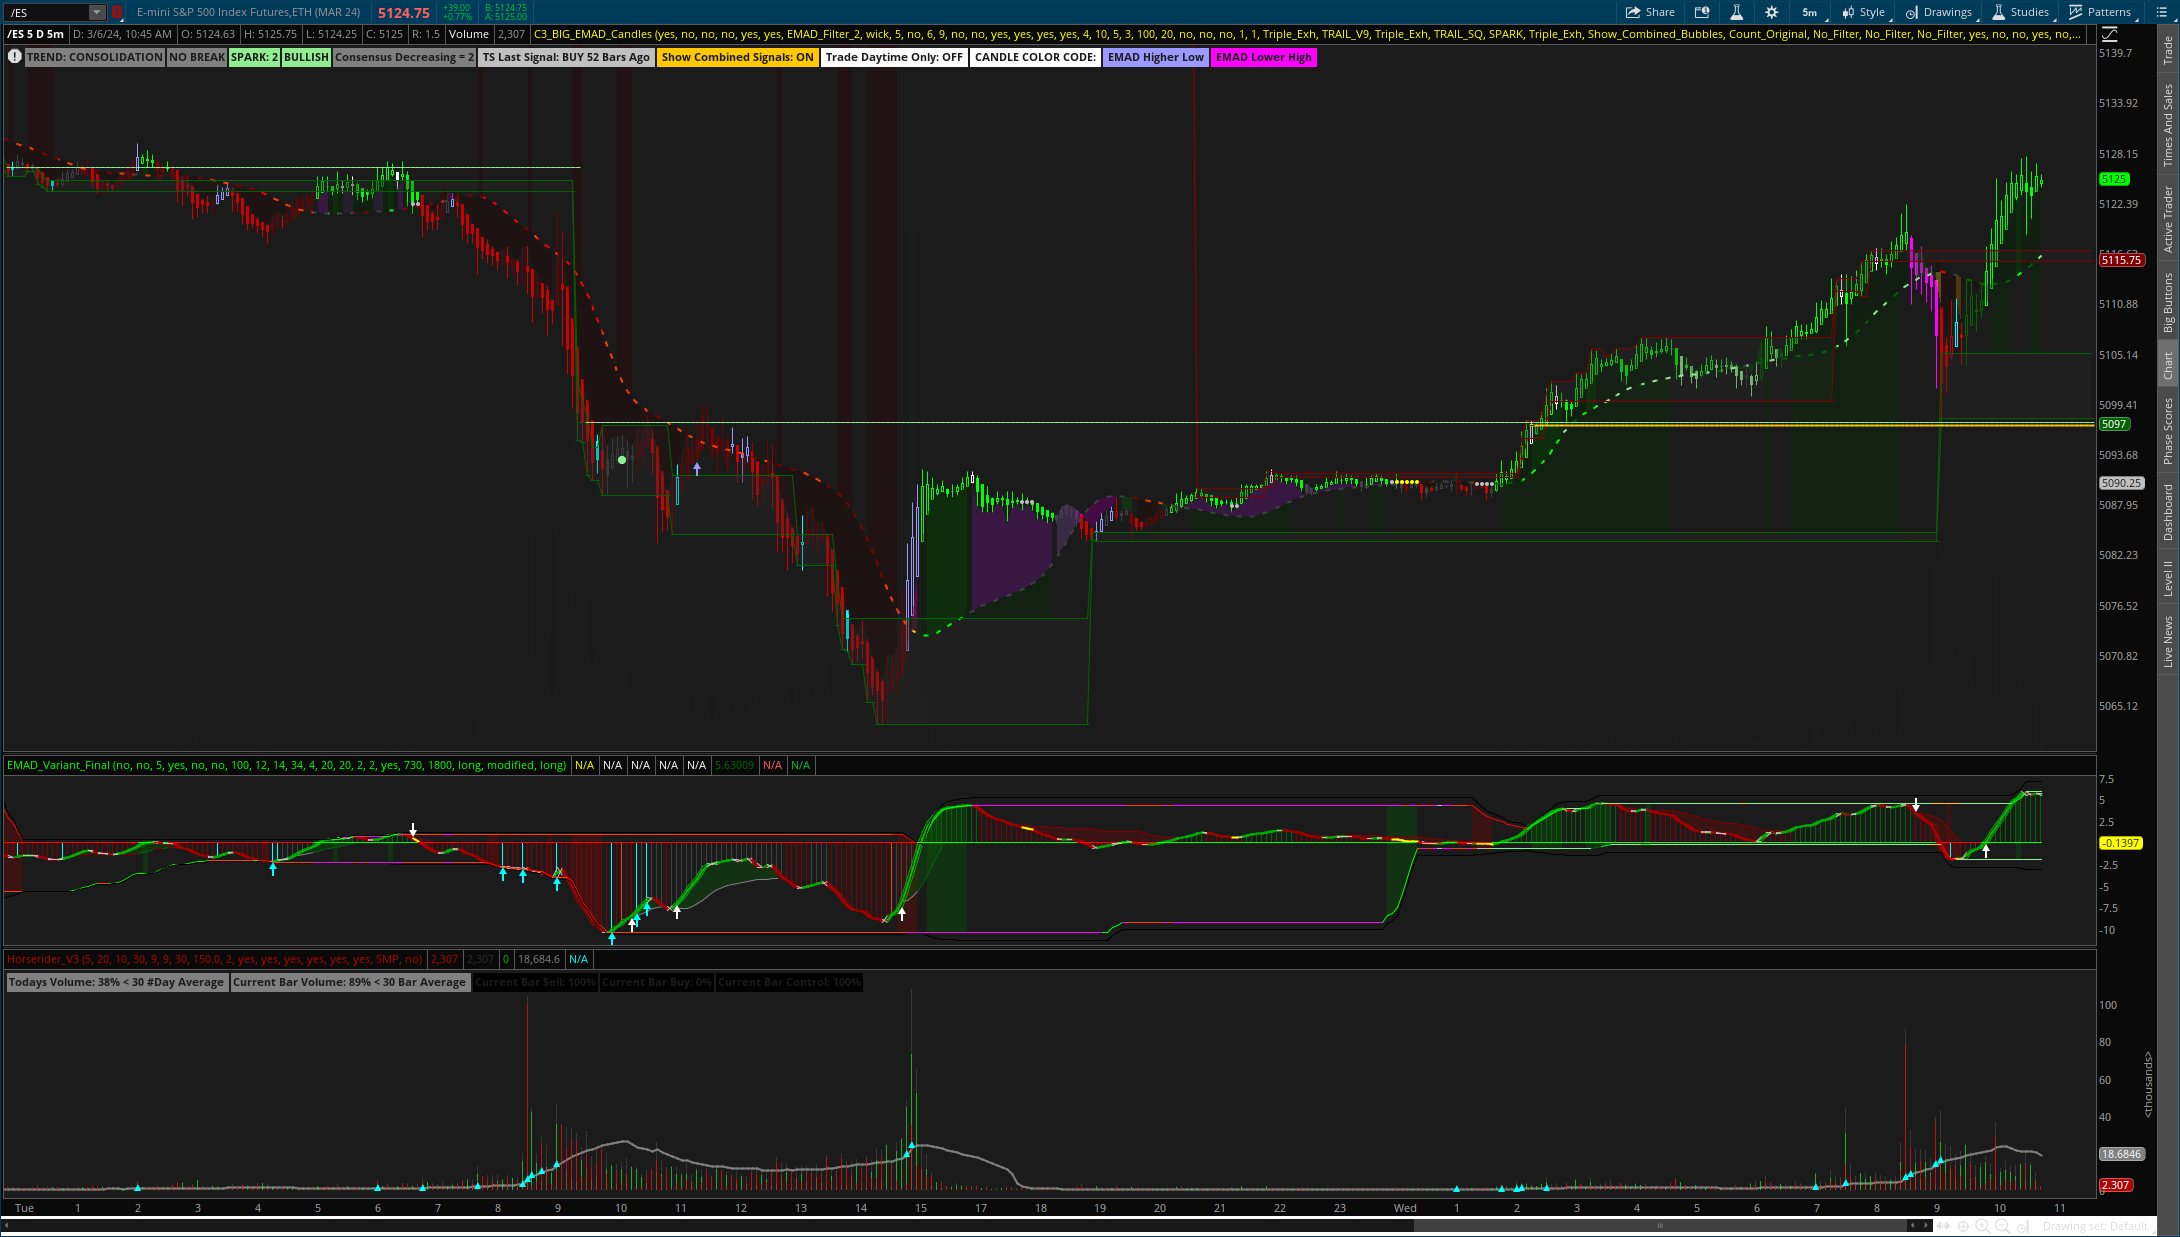
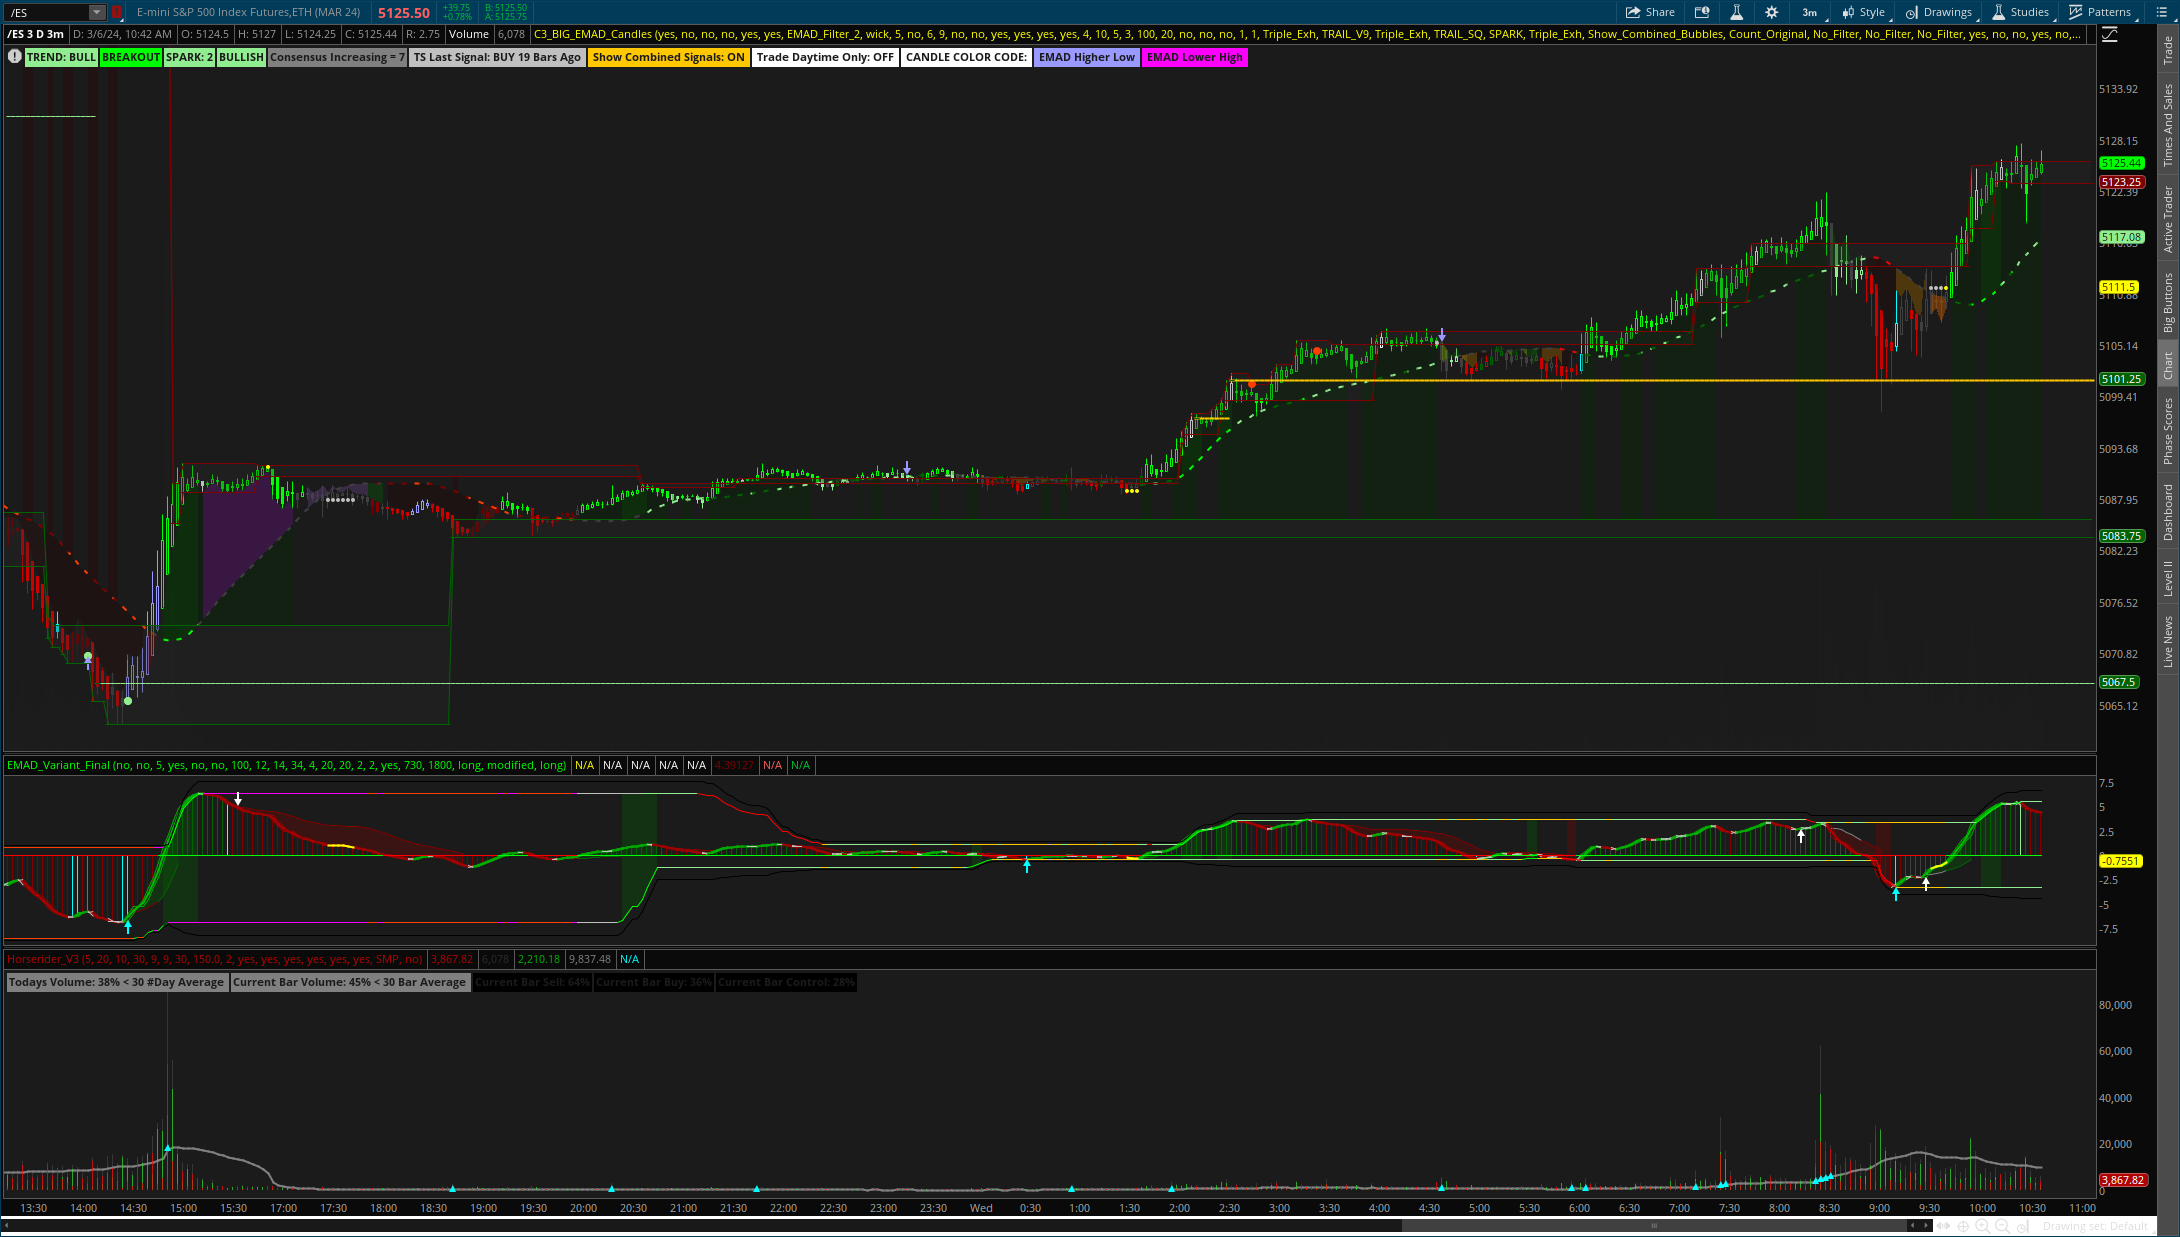
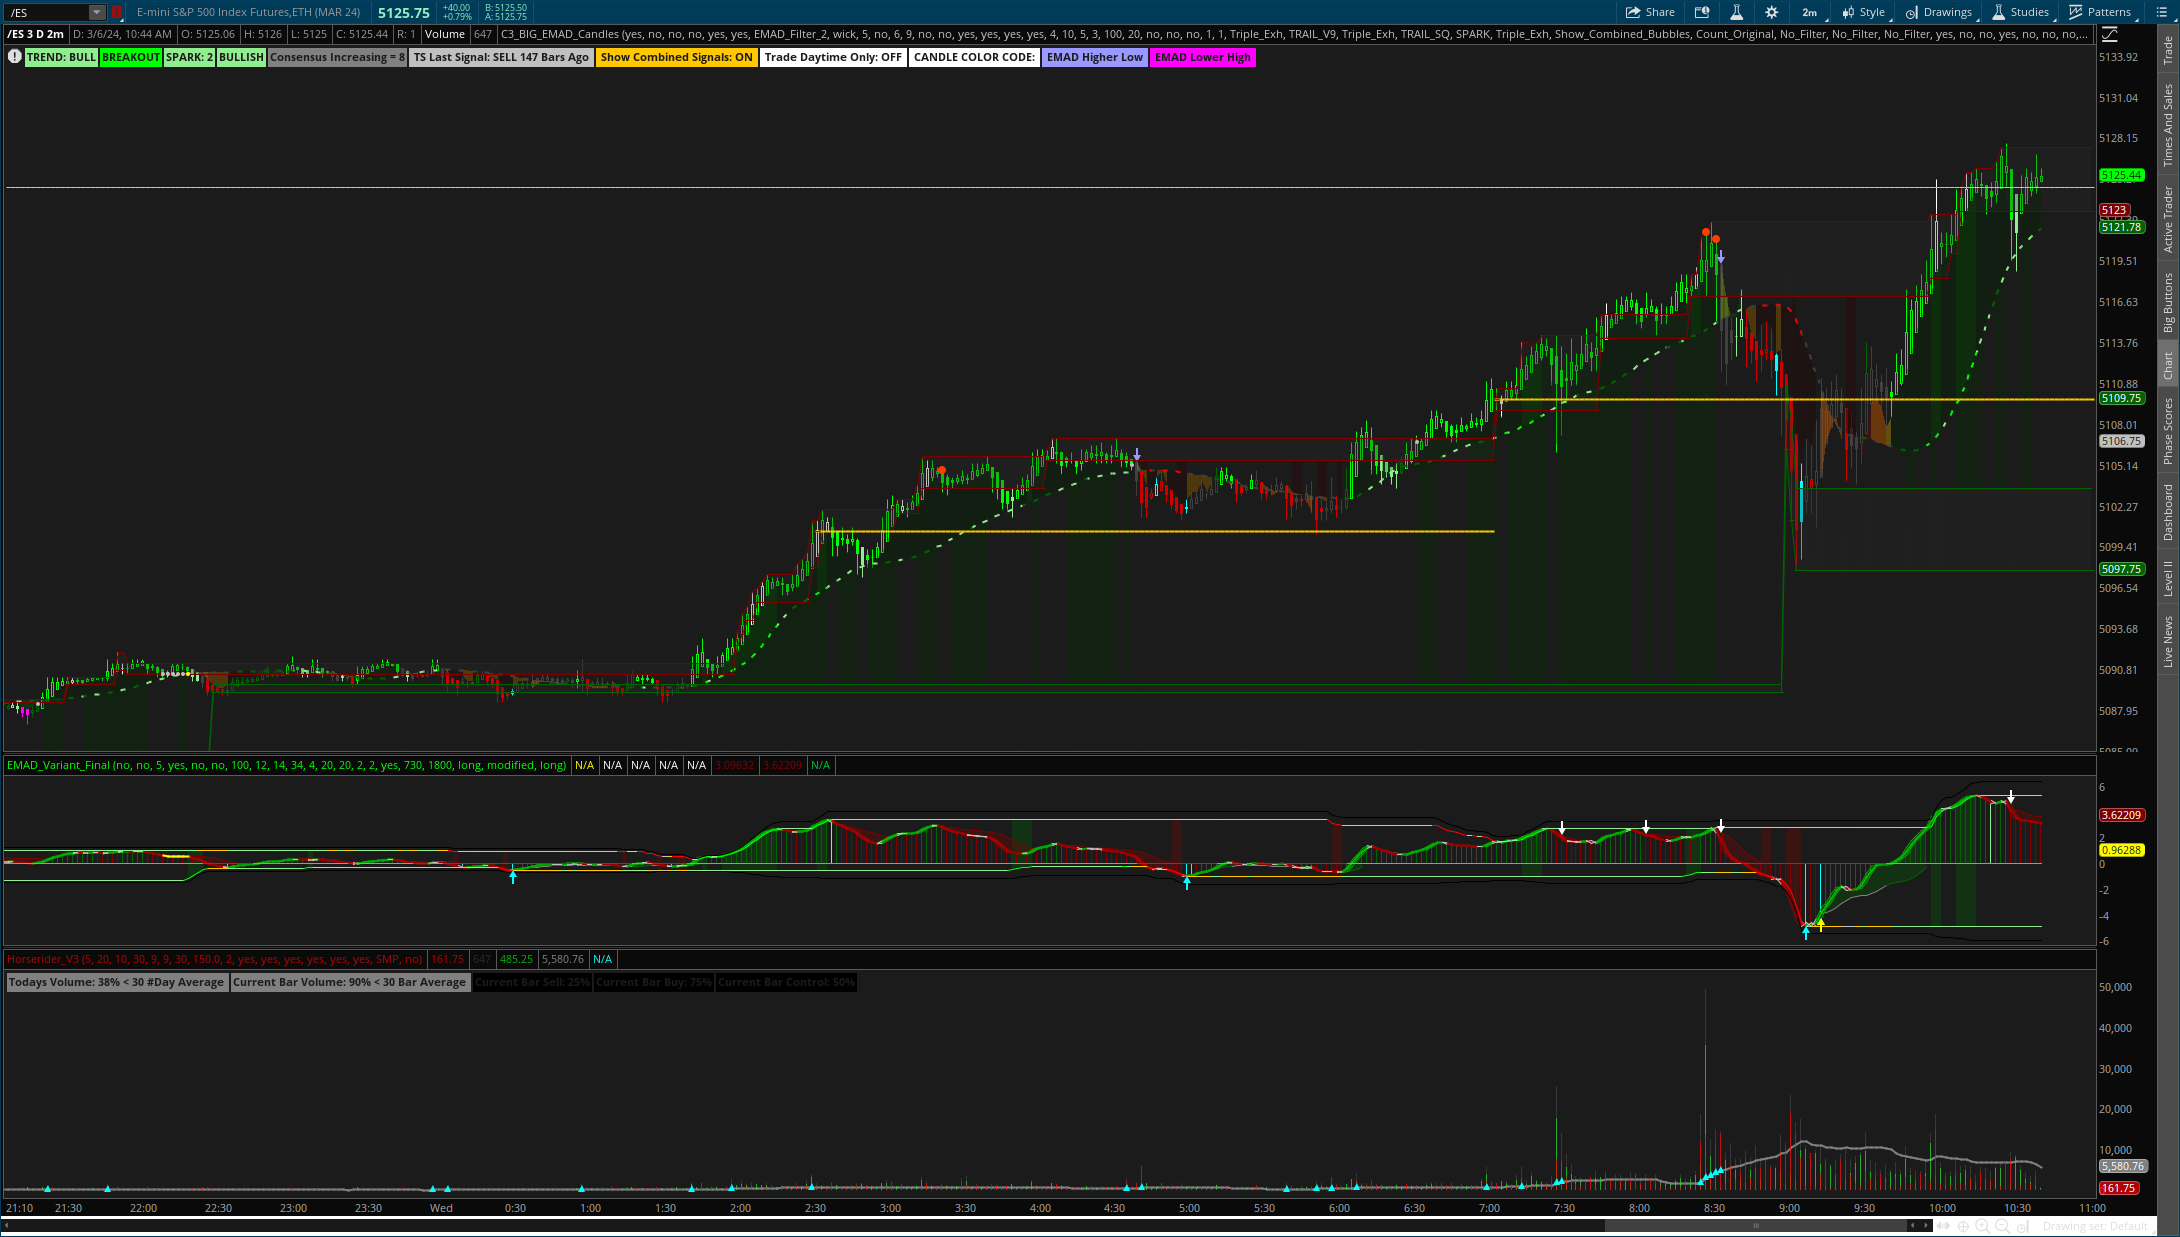
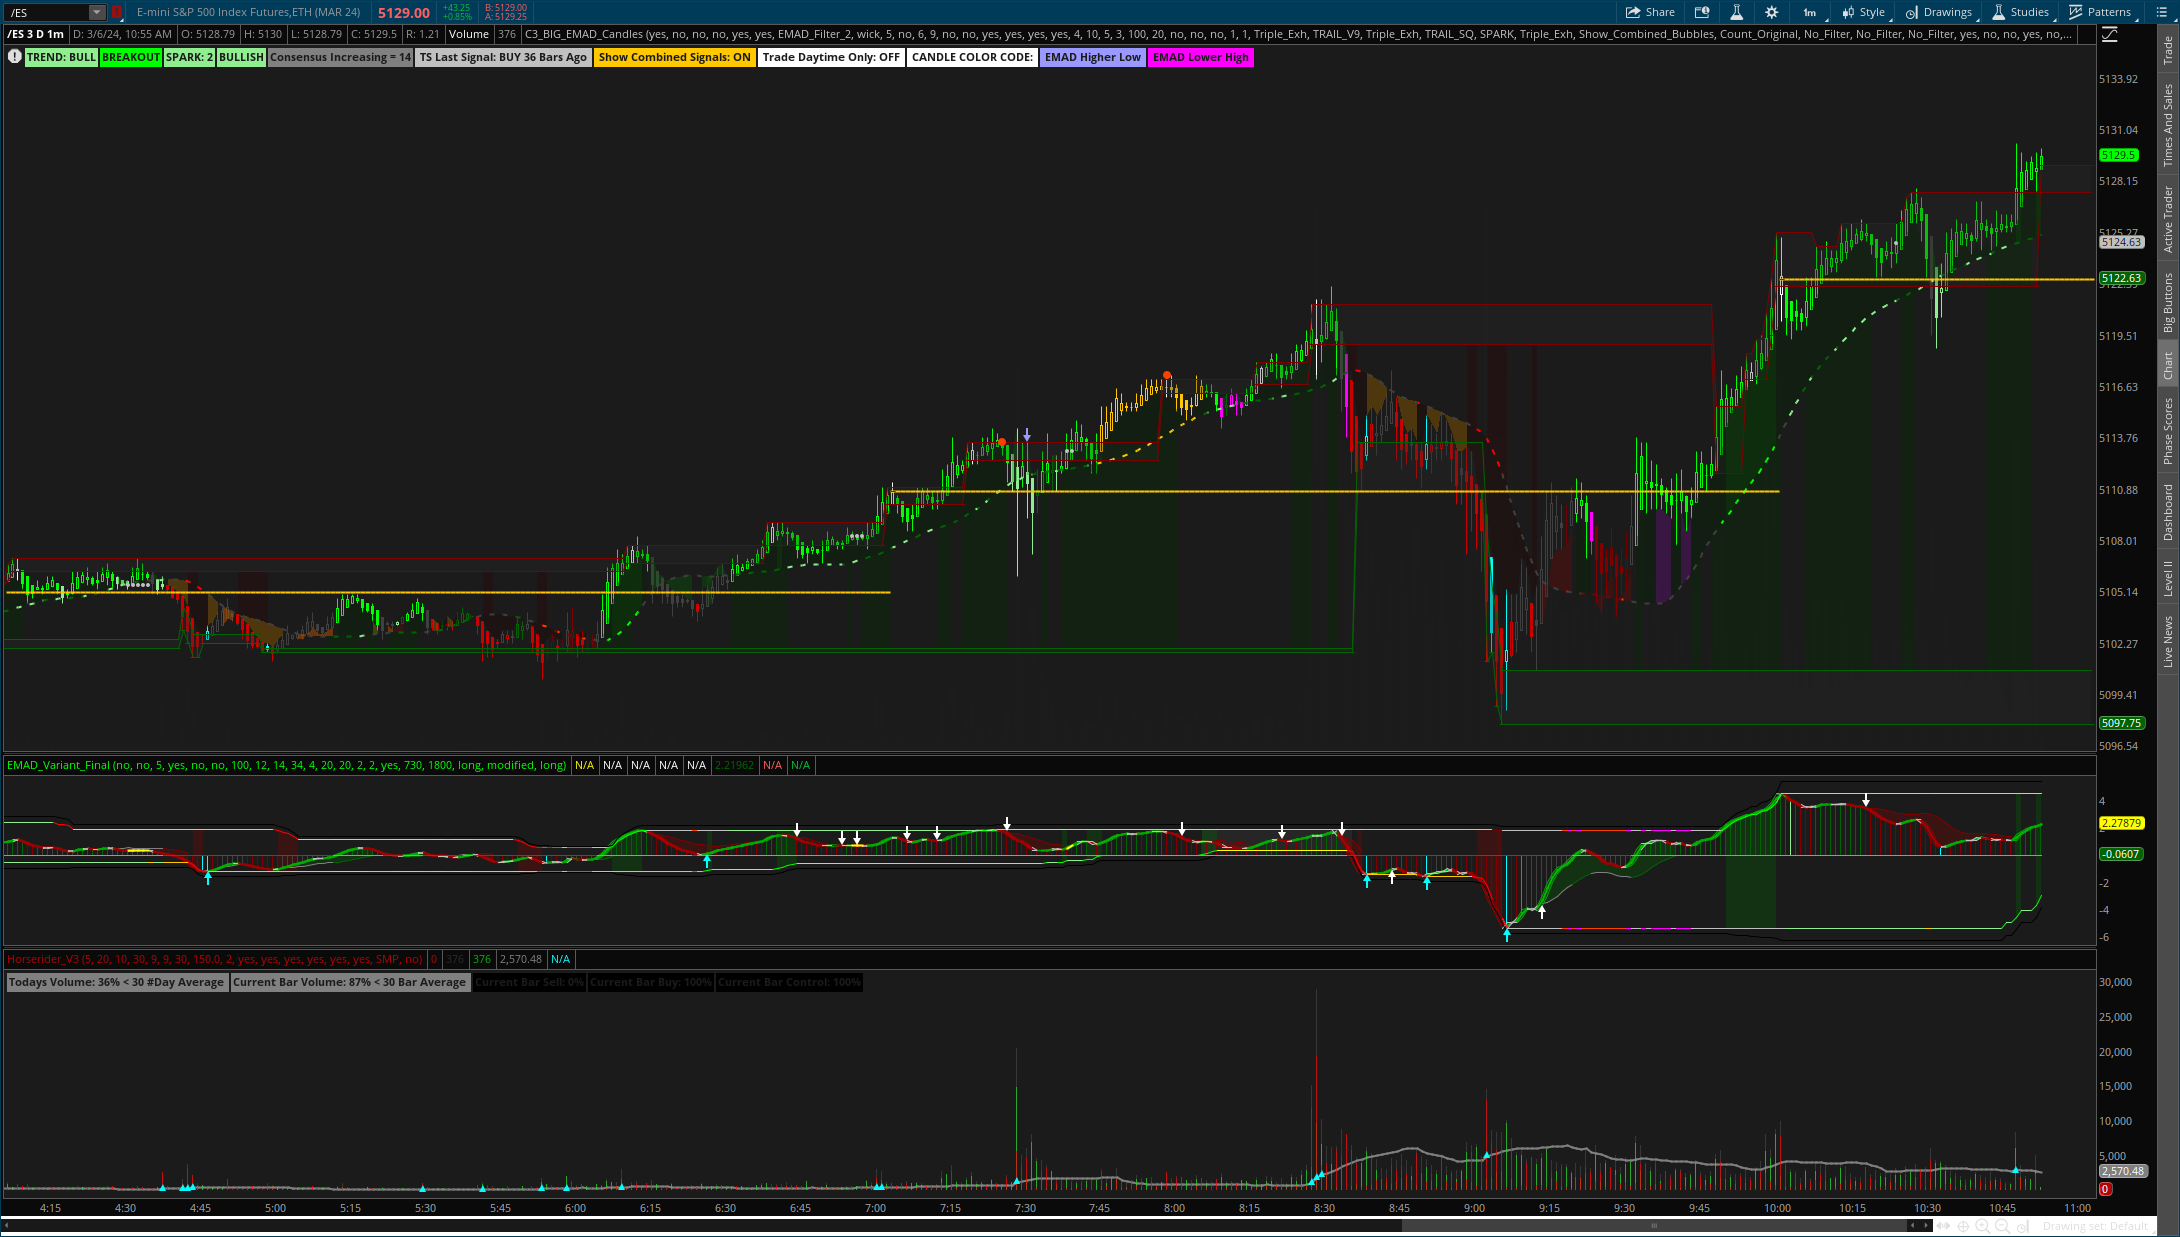
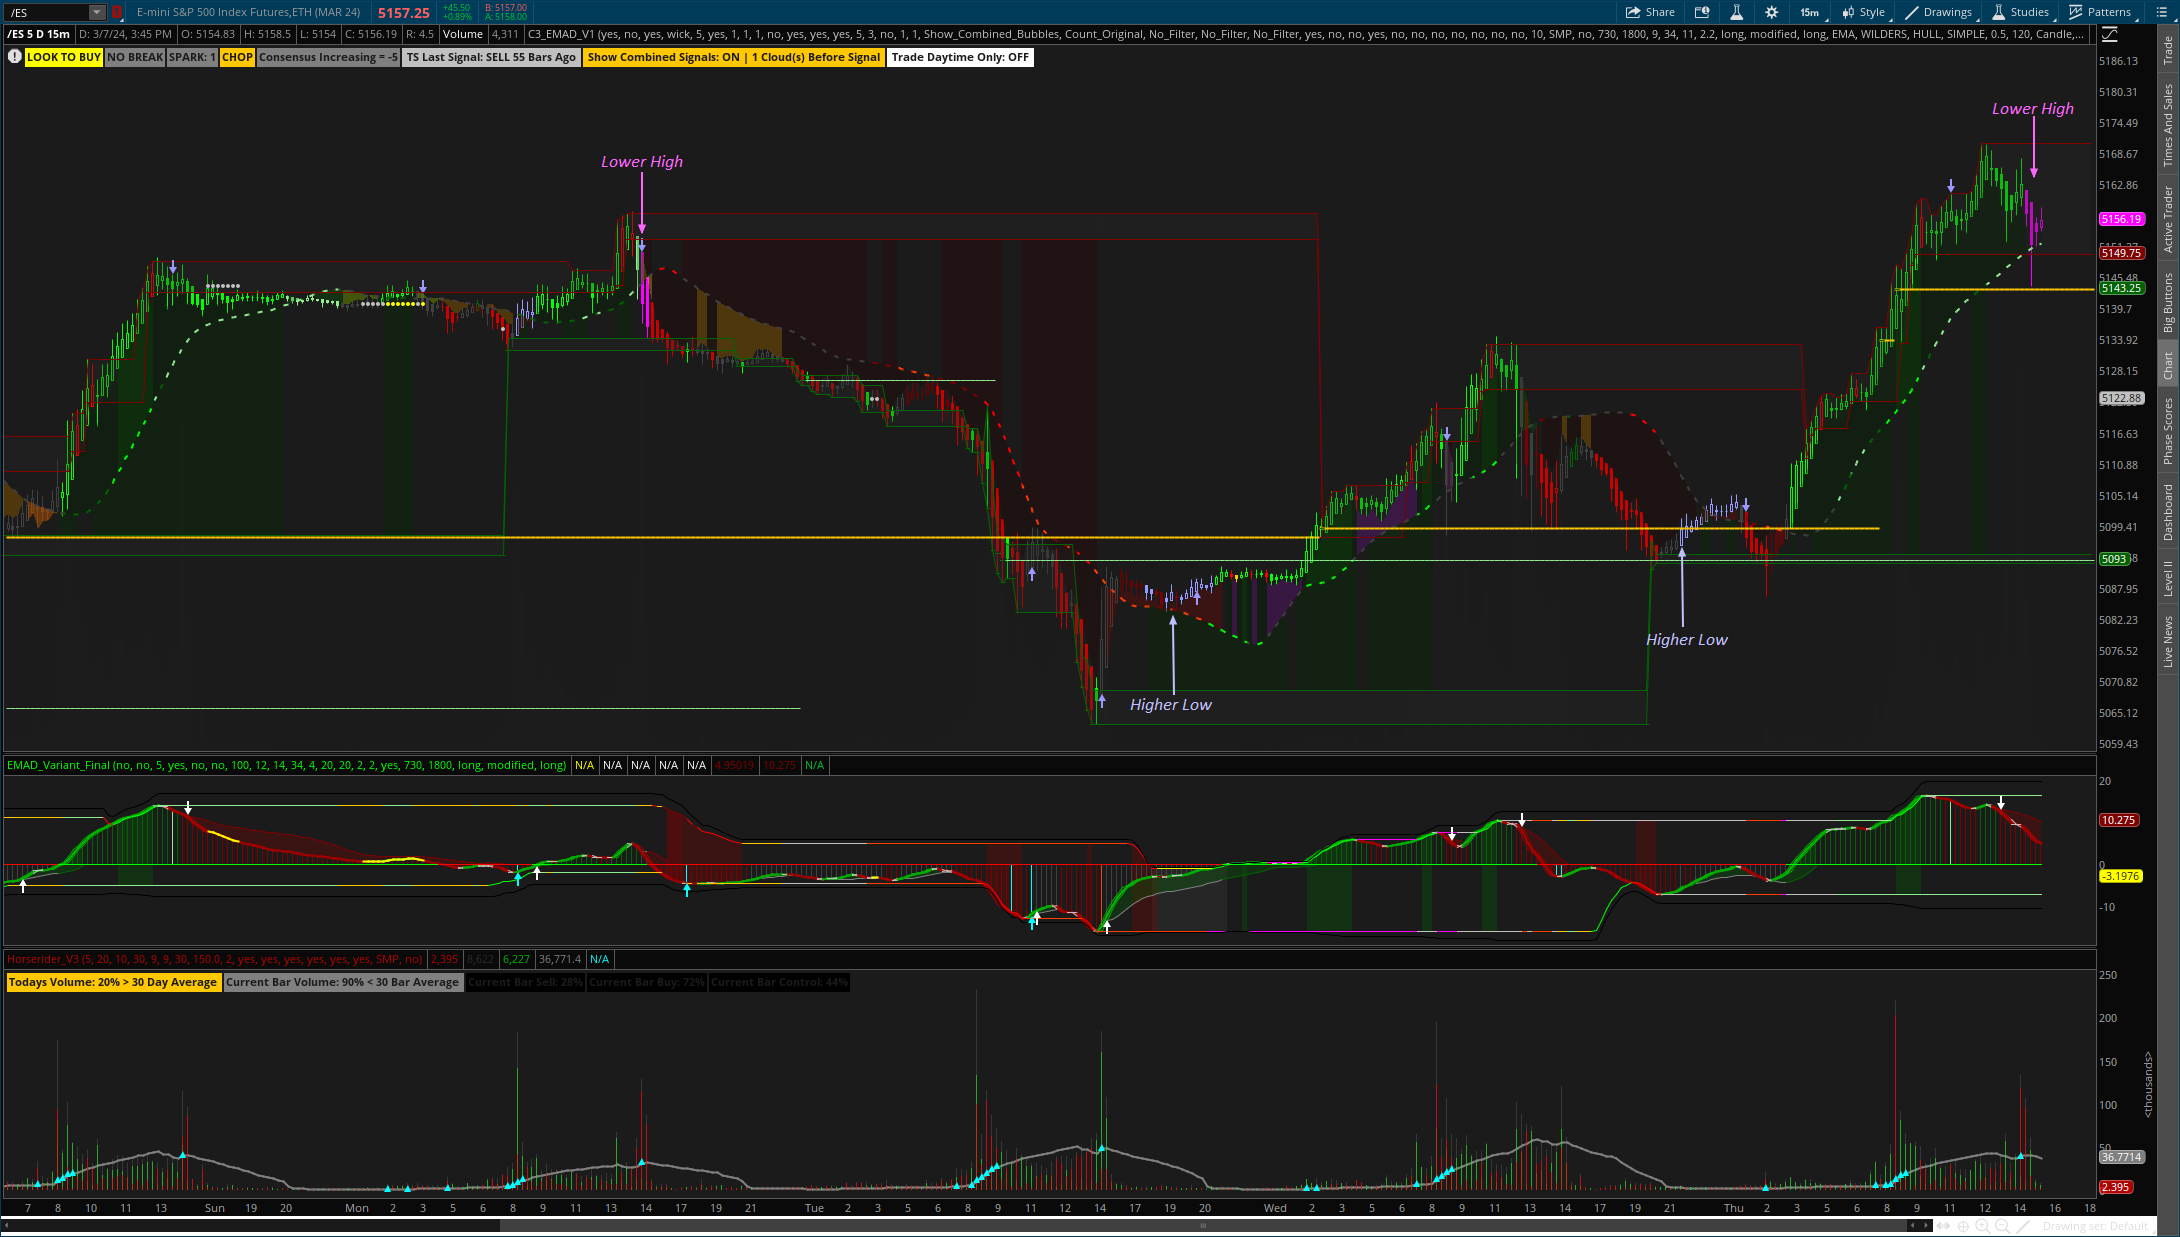
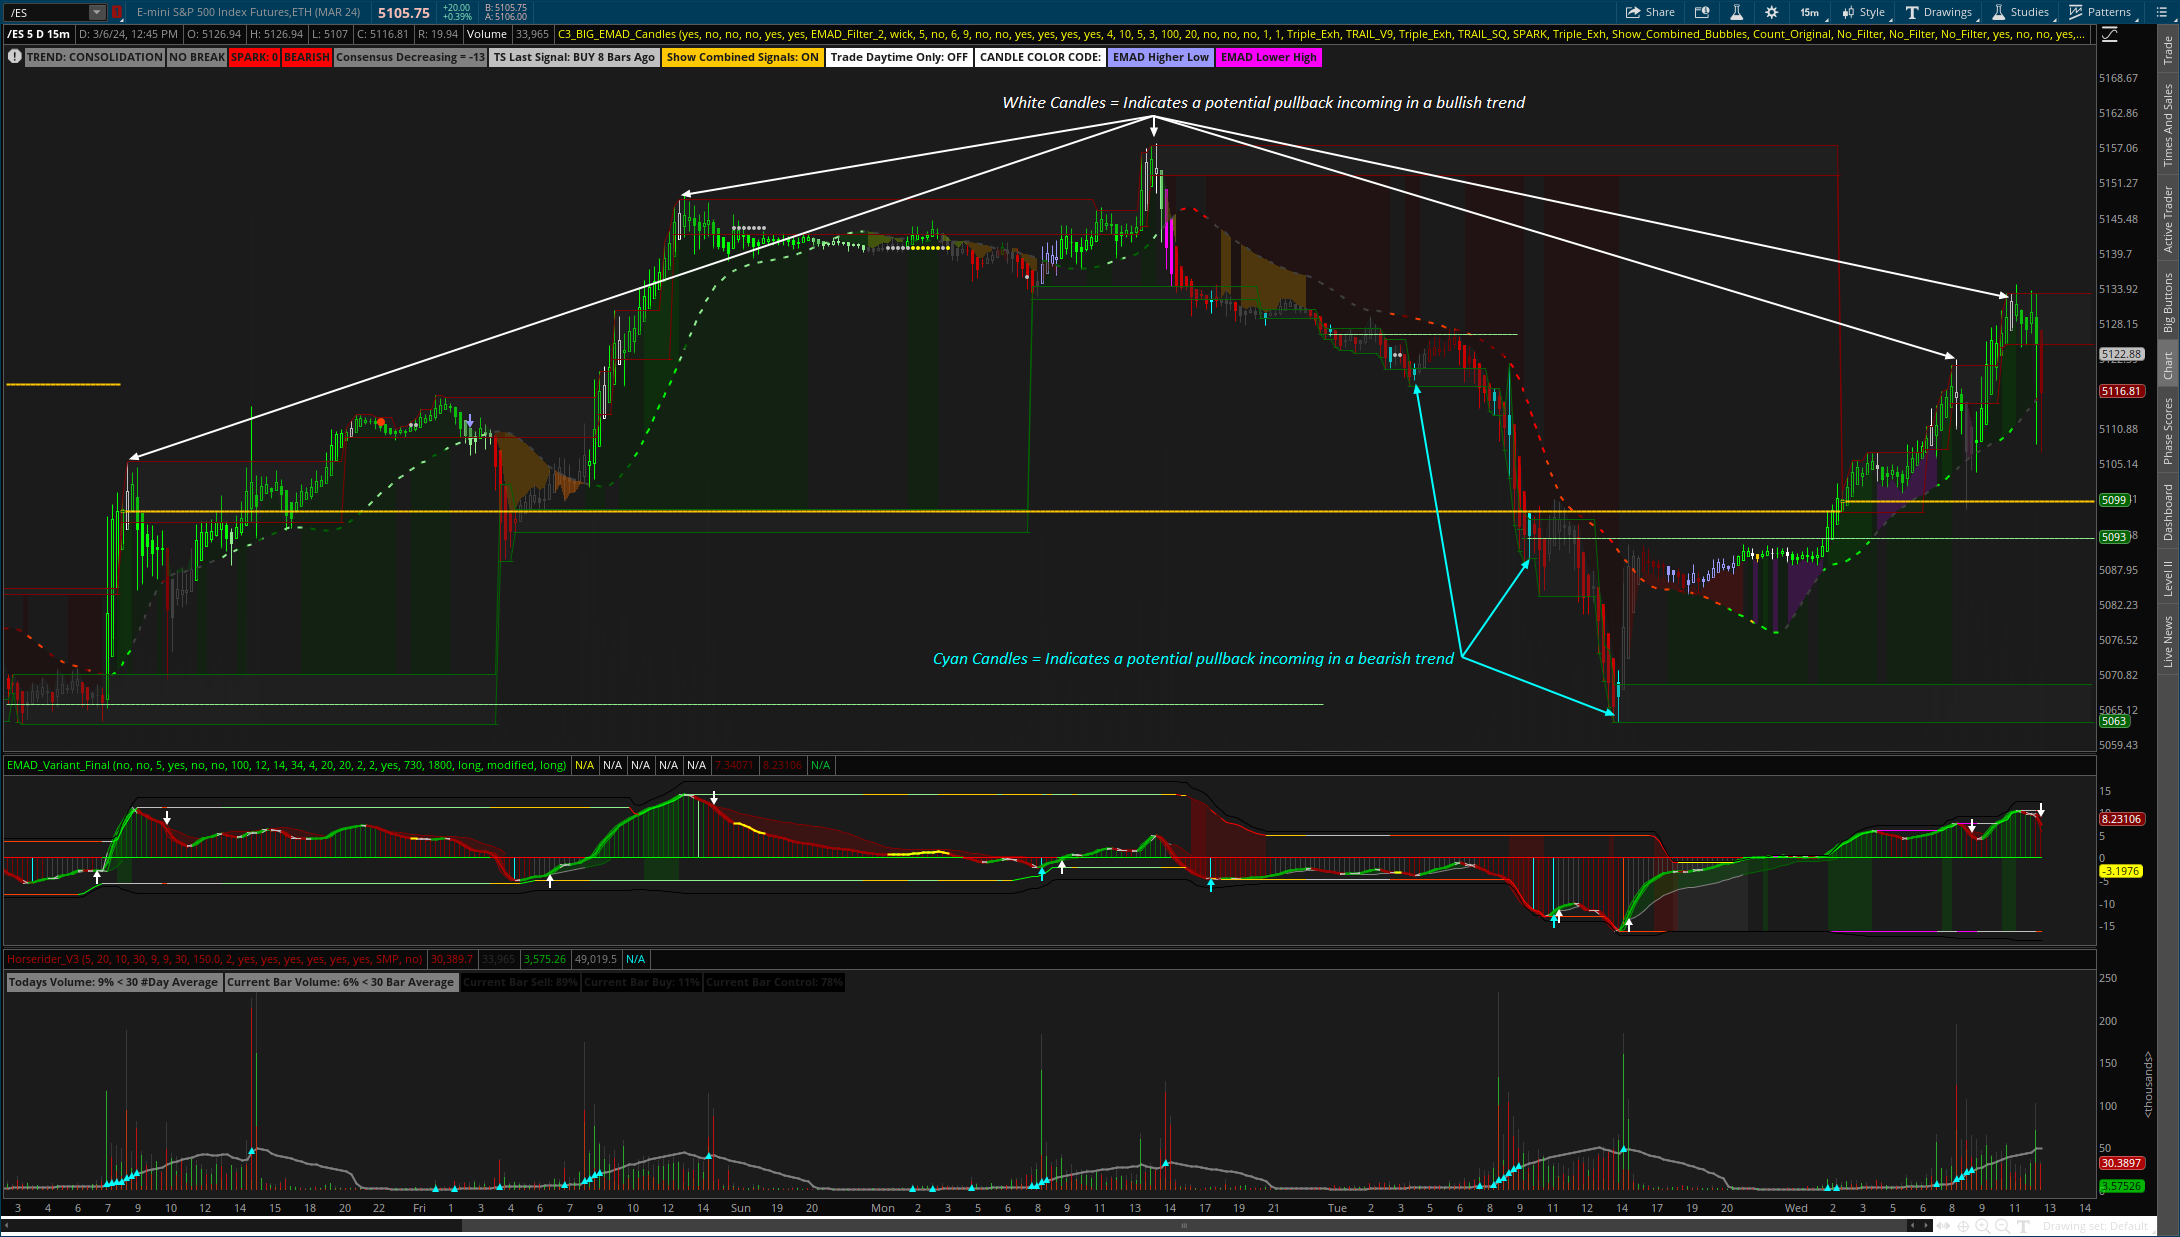
@HODL-Lay-HE-hoo! Also, just studying the indicator. Is there anyway you can add a vertical line when the EMAD arrow and the upper study confirmation arrows line up?

Volume is certainly apart of the code but I may mess around with some volume stuff when I am done melting my brain on my current project. I will add the vertical line... Also the filter gives you the option to use only emad arrows + spark or other combinations of signals (it is for arrows though)
 
Volume is certainly apart of the code but I may mess around with some volume stuff when I am done melting my brain on my current project. I will add the vertical line... Also the filter gives you the option to use only emad arrows + spark or other combinations of signals (it is for arrows though)
Curious if you are actually profiting yet using the latest system.
 
Can a watchlist scanner be created to analyze the market for "agreement signals" on daily charts? Alternatively, do you have any recommendations for a scanner, or what scanner do you personally use?
 
Curious if you are actually profiting yet using the latest system.
I dont use the current system if you are referring to the filters and whatnot... just testing them out at the moment which will hopefully result in a strategy at some point.
 
I LOVE that emad lower V2...

After much experimenting (im a newbie and no expert) and changing the script i was able to use it as a condition for a conditional order to buy or sell an order based on if the emadsmooth is green or red... I added it to my watchlists so that a cell turns green or red based on if the emadsmooth is green or red... And I made a label for also if the emadsmooth turns green or red which im using for another side project im working on with python...

and thanks for that recent mobile version... works great...

Im not expecting anyone to ask me a question or reply to this since im a newbie and no expert, just trying to say thanks... but just in case i do not have a paid account so my posts are delayed for quite a while...
 
Last edited:
C3 BIG MAD update:

Chart Style: http://tos.mx/c7yVRrD (new link)

Forgot to add on the chart explanation the "Hide Consecutive" setting which filters out multiple arrows in the same direction.
1ZWbJP2.png


puKuL6d.png


ZehWswb.png
Love this setup. Is there anyway you can add a mechanism to alert when the arrows or signals are displayed?
 
I LOVE that emad lower V2...

After much experimenting (im a newbie and no expert) and changing the script i was able to use it as a condition for a conditional order to buy or sell an order based on if the emadsmooth is green or red... I added it to my watchlists so that a cell turns green or red based on if the emadsmooth is green or red... And I made a label for also if the emadsmooth turns green or red which im using for another side project im working on with python...

and thanks for that recent mobile version... works great...

Im not expecting anyone to ask me a question or reply to this since im a newbie and no expert, just trying to say thanks... but just in case i do not have a paid account so my posts are delayed for quite a while...
Glad you like it. I will be posting a new version of C3 Big Max soon that uses the EMAD code to color lower highs and higher lows among other things.
 
Glad you like it. I will be posting a new version of C3 Big Max soon that uses the EMAD code to color lower highs and higher lows among other things.
@HODL-Lay-HE-hoo! Any thoughts on when the new C3 Big Max will be available? I remember you posting screen shots of it in an earlier post and the clarity of charts was remarkable! :)

@HODL-Lay-HE-hoo! Any thoughts on when the new C3 Big Max will be available? I remember you posting screen shots of it in an earlier post and the clarity of charts was remarkable! :)
I have been using it successfully since last year when @Christopher84 first posted it. You have added more clarity and simplified it for new users. Thank you!
 
Last edited:
Confirmation Trend Chart 2024

(nothing re-paints / Good for all timeframes)

Chart Style: http://tos.mx/UkusWSy (updated 3/8/2024) (2:20pm)

********* Forgot to mention the settings for orange candles that indicate "Zone Compression" are currently set for use with /ES so if you use it on others you may need to adjust the setting*********

Disclaimer!

  • There is some unnecessary code that I will remove in time.
  • The white and cyan candles in the screenshots below have been changed to Red and Green.
  • All Arrows are effected by the "Use Clouds Before Filter" status (which I have updated the default settings to show only the "Combined Signals" (violet arrows) when 1 CVD cloud(s) precede the signal ((which is not the same settings pictured below)).
  • I will update the screenshots and whatnot soon.
********* Added another condition (2:20pm)*********

S8BjuBZ.png


White Candles Changed to Red / Cyan Candles changed to Green + Observation(s)

dB9RpXb.png


FDfgJQo.png


IPR7fOR.png


Candle Color Code

zzAkrS0.png


Vertical Clouds Between Zones (etc.)

V3xbzrX.png


Lower High Higher Low Candles

ZGW90fV.png


ELhmk6R.png


OB OS Zones Overlap

AhqtjLq.png


Pullbacks / Exhaustion (not triple exhaustion)

JhkCiIC.png
 
Last edited:
How you read the vertical and horizontal clouds on EMAD Variant 1000
Thank you.
You will notice the Green and Red Clouds align with the Top/Bottom Band when increasing or decreasing. The Gray cloud appears when the Top Band is < Zero line / Bottom Band > Zero line.
 
To whom it may concern, I added a condition to the "Squeeze Alert" (yellow and gray dots) indication: The Squeeze dots will only turn yellow if the price is > the ehlers moving average. updated style link on page one... will update the other info soon.
 
To whom it may concern, I added a condition to the "Squeeze Alert" (yellow and gray dots) indication: The Squeeze dots will only turn yellow if the price is > the ehlers moving average. updated style link on page one... will update the other info soon.
I highly appreciate taking the time to make this! I was wondering what the arrows and their corresponding colors mean in the EMAD lower study?

Awesome stuff!
 

Join useThinkScript to post your question to a community of 21,000+ developers and traders.

Not the exact question you're looking for?

Start a new thread and receive assistance from our community.

87k+ Posts
409 Online
Create Post

The Market Trading Game Changer

Join 2,500+ subscribers inside the useThinkScript VIP Membership Club
  • Exclusive indicators
  • Proven strategies & setups
  • Private Discord community
  • ‘Buy The Dip’ signal alerts
  • Exclusive members-only content
  • Add-ons and resources
  • 1 full year of unlimited support

Frequently Asked Questions

What is useThinkScript?

useThinkScript is the #1 community of stock market investors using indicators and other tools to power their trading strategies. Traders of all skill levels use our forums to learn about scripting and indicators, help each other, and discover new ways to gain an edge in the markets.

How do I get started?

We get it. Our forum can be intimidating, if not overwhelming. With thousands of topics, tens of thousands of posts, our community has created an incredibly deep knowledge base for stock traders. No one can ever exhaust every resource provided on our site.

If you are new, or just looking for guidance, here are some helpful links to get you started.

What are the benefits of VIP Membership?
VIP members get exclusive access to these proven and tested premium indicators: Buy the Dip, Advanced Market Moves 2.0, Take Profit, and Volatility Trading Range. In addition, VIP members get access to over 50 VIP-only custom indicators, add-ons, and strategies, private VIP-only forums, private Discord channel to discuss trades and strategies in real-time, customer support, trade alerts, and much more. Learn all about VIP membership here.
How can I access the premium indicators?
To access the premium indicators, which are plug and play ready, sign up for VIP membership here.
Back
Top