# https://www.tradingview.com/v/sfV6H5h5/
#//@KivancOzbilgic
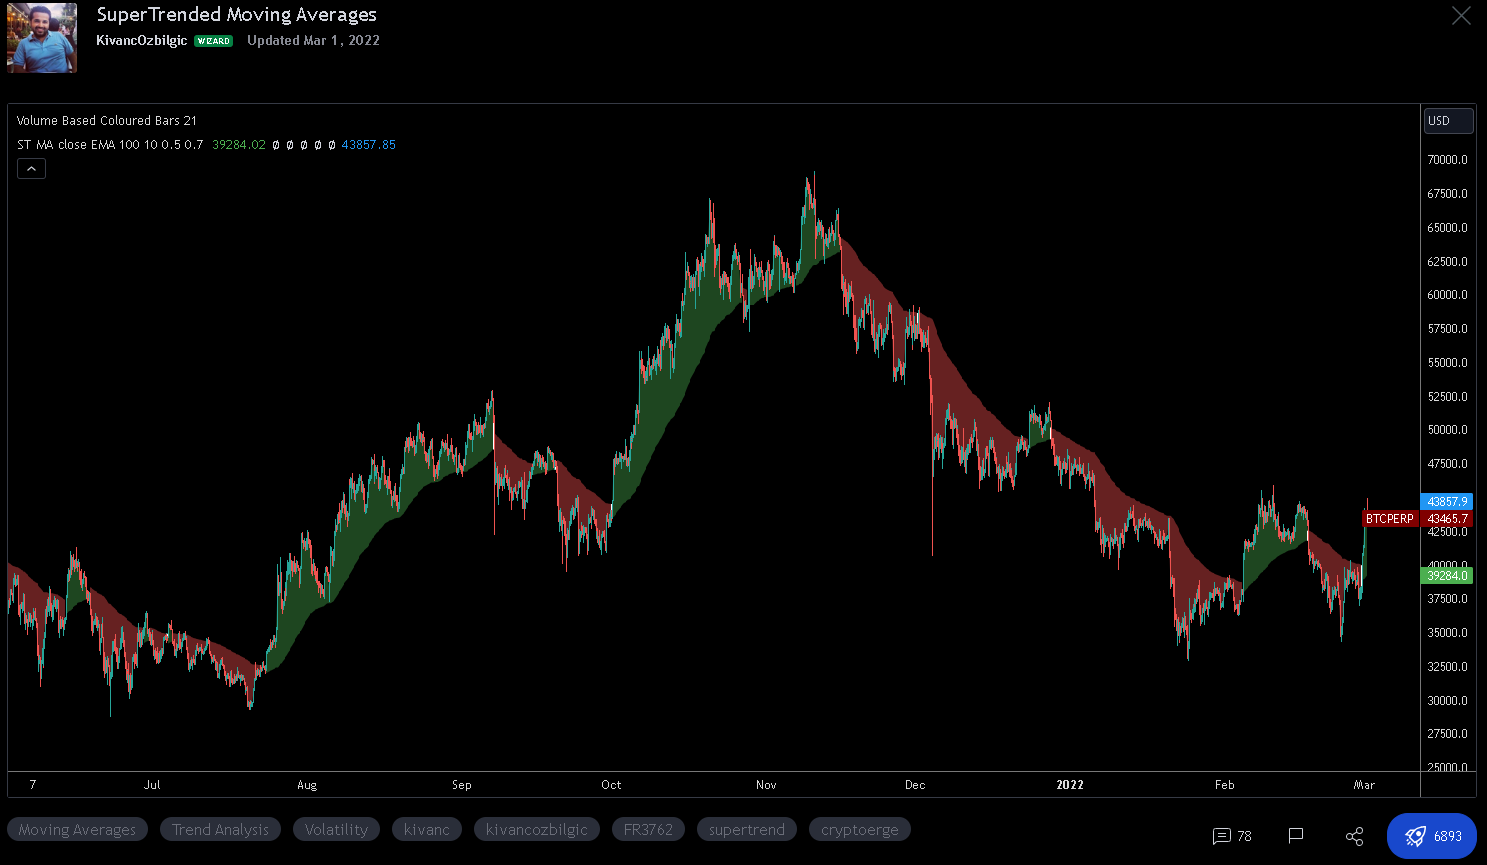
#indicator('SuperTrended Moving Averages', 'ST MA', overlay=true,
#Converted by Sam4Cok@Samer800 - 11/2023
input maType = {SMA,default EMA, SMMA, WMA, VWMA,DEMA, TEMA, ZLSMA, ZLDEMA, ZLTEMA, McGinley, HMA};
input sourceType = {"High/Low",Default "Custom"};
input customSource = FundamentalType.HL2;
input maLength = 100; # " Length MA"
input changeATR = yes;
input atrLength = 10; # " Length Atr"
input atrMultiplier = 0.5; # "Band Mult"
input ShowCloud = yes;
input showsignals = yes;
def na = Double.NaN;
def avPlot = ohlc4;
def custom = sourceType==sourceType."Custom";
def src = Fundamental(FundamentalType = customSource);
#// ] -------------- FUNCTIONS : Moving Avg ------------------ [
#export zlSma(float src, simple int len) =>
script zlSma {
input src = close;
input len = 14;
def lsma = Inertia(src, len);
def lsma2 = Inertia(lsma, len);
def eq = lsma - lsma2;
def zlsma = lsma + eq;
plot return = zlsma;
}
#export zlDema(float src, simple int len) =>
script zlDema {
input src = close;
input len = 14;
def zdema1 = ExpAverage(src, len);
def zdema2 = ExpAverage(zdema1, len);
def dema1 = 2 * zdema1 - zdema2;
def zdema12 = ExpAverage(dema1, len);
def zdema22 = ExpAverage(zdema12, len);
def zldema = 2 * zdema12 - zdema22;
plot return = zldema;
}
#export zlTema(float src, simple int len) =>
script zlTema {
input src = close;
input len = 14;
def ema1 = ExpAverage(src, len);
def ema2 = ExpAverage(ema1, len);
def ema3 = ExpAverage(ema2, len);
def tema1 = 3 * (ema1 - ema2) + ema3;
def ema1a = ExpAverage(tema1, len);
def ema2a = ExpAverage(ema1a, len);
def ema3a = ExpAverage(ema2a, len);
def zltema = 3 * (ema1a - ema2a) + ema3a;
plot return = zltema;
}
#export mcginley(float src, simple int len)=>
script mcginley {
input src = close;
input len = 14;
def mg;
def t = ExpAverage(src, len);
mg = if IsNaN(mg[1]) then t else
CompoundValue(1 ,mg[1] + (src - mg[1]) / (len * Power(src / mg[1], 4)),src);
plot return = mg;
}
#vwma(source, length)
script VWMA {
input src = close;
input len = 15;
def v = volume;
def VWMA = SimpleMovingAvg(src * v, len) / SimpleMovingAvg(v, len);
plot result = VWMA;
}
#export multiMa(float source, simple int length, string type) =>
script multiMa {
input source = close;
input length = 14;
input type = "SMA";
def multiMa =
if type == "SMA" then SimpleMovingAvg(source, length) else
if type == "EMA" then ExpAverage(source, length) else
if type == "SMMA" then WildersAverage(source, length) else
if type == "WMA" then WMA(source, length) else
if type == "VWMA" then vwma(source, length) else
if type == "DEMA" then DEMA(source, length) else
if type == "TEMA" then TEMA(source, length) else
if type == "ZLSMA" then zlSma(source, length) else
if type == "ZLDEMA" then zlDema(source, length) else
if type == "ZLTEMA" then zlTema(source, length) else
if type == "McGinley" then mcginley(source, length) else
if type == "HMA" then HullMovingAvg(source, length ) else ExpAverage(source, length);
plot return = multiMa;
}
#Supertrend(lenAtr, lenMas, mult, highP, lowP, closeP) =>
Script Supertrend {
input maUp = high;
input maDn = low;
input atrLength = 14;
input mult = 2;
input changeATR = yes;
def tr = TrueRange(high, close, low);
def nATR = if changeATR then ATR(Length = atrLength) else SimpleMovingAvg(tr, atrLength);
def up = maDn - mult * nATR;
def dn = maUp + mult * nATR;
def lower;
def upper;
def up1 = if upper[1] then upper[1] else up;
def dn1 = if lower[1] then lower[1] else dn;
upper = if (close[1] > up1) then max(up, up1) else up;# else up1;
lower = if (close[1] < dn1) then min(dn, dn1) else dn;# else dn1;
def trend;# = na
if (!upper or !lower) {
trend = 1;
} else
if trend[1] == -1 and close > dn1 {
trend = 1;
} else if trend[1] == 1 and close < up1 {
trend = -1;
} else {
trend = if trend[1] then trend[1] else 1;
}
def superTrend = if trend == -1 then lower else upper;
plot ST = superTrend;
plot dir = trend;
}
def maUp = multiMa(if custom then src else high, maLength, maType);
def maDn = multiMa(if custom then src else low, maLength, maType);
def ST = Supertrend(maUp, maDn, atrLength, atrMultiplier,changeATR).ST;
def Trend = Supertrend(maUp, maDn, atrLength, atrMultiplier,changeATR).DIR;
def buySignal = trend == 1 and trend[1] == -1;
def sellSignal = trend == -1 and trend[1] == 1;
#-- plts
plot upPlot = if Trend > 0 then ST else na; # 'Up Band'
upPlot.SetDefaultColor(CreateColor(76,175,80));
plot loPlot = if Trend > 0 then na else ST; # 'Low Band'
loPlot.SetDefaultColor(CreateColor(255,82,82));
#-- Signals and Cloud
AddChartBubble(showsignals and buySignal, ST, "B", Color.GREEN, no);
AddChartBubble(showsignals and sellSignal, ST, "S", Color.RED);
AddCloud(if ShowCloud then avPlot else na, upPlot, CreateColor(0,35,0)); # 'Upper Area'
AddCloud(if ShowCloud then loPlot else na, avPlot, CreateColor(55,0,0)); # 'Lower Area'
#--- END CODE