
The author states:
The Adaptive Moving Average (AMA) Signals indicator, enhances the classic concept of moving averages by making them adaptive to the market's volatility. This adaptability makes the AMA particularly useful in identifying market trends with varying degrees of volatility.
The core of the AMA's adaptability lies in its Efficiency Ratio (ER), which measures the directionality of the market over a given period. The ER is calculated by dividing the absolute change in price over a period by the sum of the absolute differences in daily prices over the same period.
 Why It's Useful
The AMA Signals indicator is particularly useful because of its adaptability to changing market conditions. Unlike static moving averages, it dynamically adjusts, providing more relevant signals that can help traders capture trends earlier or identify reversals with greater accuracy. Its configurability makes it suitable for various trading strategies and timeframes, from day trading to swing trading.
█ How It Works
The AMA Signals indicator operates on the principle of adapting to market efficiency through the calculation of the Efficiency Ratio (ER), which measures the directionality of the market over a specified period. By comparing the net price change to total price movements, the AMA adjusts its sensitivity, becoming faster during trending markets and slower during sideways markets. This adaptability is enhanced by a gamma parameter that filters signals for either trend continuation or reversal, making it versatile across different market conditions.
change = math.abs(close - close[n])
volatility = math.sum(math.abs(close - close[1]), n)
ER = change / volatility
█ How to Use
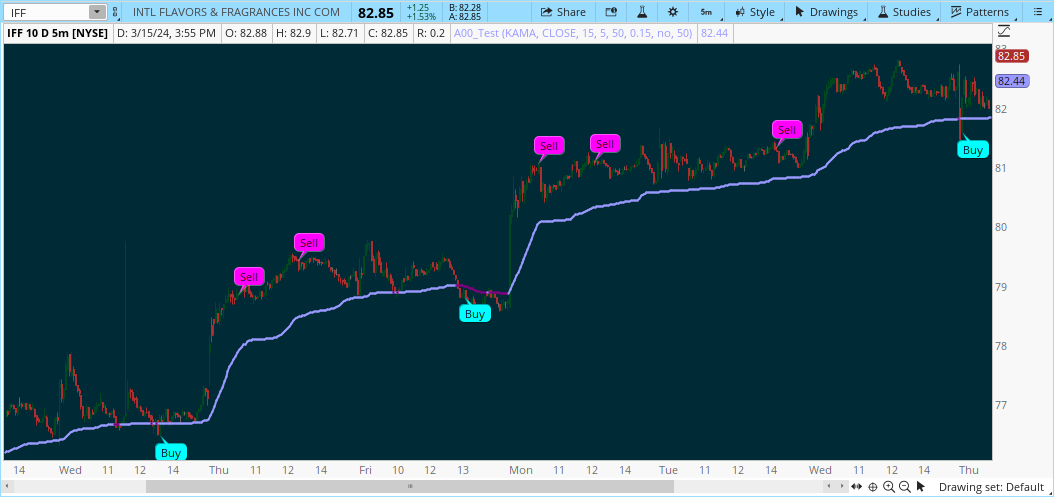
Trend Identification: Use the AMA to identify the direction of the trend. An upward moving AMA indicates a bullish trend, while a downward moving AMA suggests a bearish trend.
Reversal Trading: Set the gamma to a positive value to focus on reversal signals, identifying potential market turnarounds.
█ Settings
https://www.tradingview.com/script/ZSyG0zv6-Adaptive-Moving-Average-AMA-Signals-Zeiierman/
please
The Adaptive Moving Average (AMA) Signals indicator, enhances the classic concept of moving averages by making them adaptive to the market's volatility. This adaptability makes the AMA particularly useful in identifying market trends with varying degrees of volatility.
The core of the AMA's adaptability lies in its Efficiency Ratio (ER), which measures the directionality of the market over a given period. The ER is calculated by dividing the absolute change in price over a period by the sum of the absolute differences in daily prices over the same period.
Why It's UsefulThe AMA Signals indicator is particularly useful because of its adaptability to changing market conditions. Unlike static moving averages, it dynamically adjusts, providing more relevant signals that can help traders capture trends earlier or identify reversals with greater accuracy. Its configurability makes it suitable for various trading strategies and timeframes, from day trading to swing trading.
█ How It Works
The AMA Signals indicator operates on the principle of adapting to market efficiency through the calculation of the Efficiency Ratio (ER), which measures the directionality of the market over a specified period. By comparing the net price change to total price movements, the AMA adjusts its sensitivity, becoming faster during trending markets and slower during sideways markets. This adaptability is enhanced by a gamma parameter that filters signals for either trend continuation or reversal, making it versatile across different market conditions.
change = math.abs(close - close[n])
volatility = math.sum(math.abs(close - close[1]), n)
ER = change / volatility
- Efficiency Ratio (ER) Calculation: The AMA begins with the computation of the Efficiency Ratio (ER), which measures the market's directionality over a specified period. The ER is a ratio of the net price change to the total price movements, serving as a measure of the efficiency of price movements.
- Adaptive Smoothing: Based on the ER, the indicator calculates the smoothing constants for the fastest and slowest Exponential Moving Averages (EMAs). These constants are then used to compute a Scaled Smoothing Coefficient (SC) that adapts the moving average to the market's efficiency, making it faster during trending periods and slower in sideways markets.
- Signal Generation: The AMA applies a filter, adjusted by a "gamma" parameter, to identify trading signals. This gamma influences the sensitivity towards trend or reversal signals, with options to adjust for focusing on either trend-following or counter-trend signals.
█ How to Use
Trend Identification: Use the AMA to identify the direction of the trend. An upward moving AMA indicates a bullish trend, while a downward moving AMA suggests a bearish trend.
Reversal Trading: Set the gamma to a positive value to focus on reversal signals, identifying potential market turnarounds.
█ Settings
- Period for ER calculation: Defines the lookback period for calculating the Efficiency Ratio, affecting how quickly the AMA responds to changes in market efficiency.
- Fast EMA Length and Slow EMA Length: Determine the responsiveness of the AMA to recent price changes, allowing traders to fine-tune the indicator to their trading style.
- Signal Gamma: Adjusts the sensitivity of the filter applied to the AMA, with the ability to focus on trend signals or reversal signals based on its value.
- AMA Candles: An innovative feature that plots candles based on the AMA calculation, providing visual cues about the market trend and potential reversals.
https://www.tradingview.com/script/ZSyG0zv6-Adaptive-Moving-Average-AMA-Signals-Zeiierman/
please
Last edited by a moderator:
")
