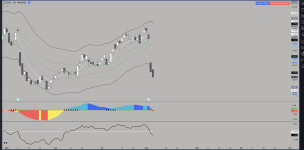
Stacked Moving Averages For ThinkOrSwim

5% of what?

do you want to search for ,
if sma50 is in between 2 prices?

to find a price 5% lower than a number, multiply it by 0.95.

is this what you want to search for?
sma50 is < sma 200 and
sma50 > (sma200 * 0.95)


Code:
input avg1_type = AverageType.SIMPLE;
input avg1_price = close;
input avg1_len = 50;
def ma1 = MovingAverage(avg1_type, avg1_price, avg1_len);

input avg2_type = AverageType.SIMPLE;
input avg2_price = close;
input avg2_len = 200;
def ma2 = MovingAverage(avg2_type, avg2_price, avg2_len);

input percent_gap = 5;

plot z = ma1 < ma2 and ma1 >
 (ma2 * (1 - (percent_gap/100)));
Thank you much for your replay. Maybe I am trying to be more clear by words. I am trying to do a scanner where sma 50 is below sma 200. I want the close to be above SMA 50 . Then I want to find the stocks that approaching sma 200 within about lets say 5 %. Basically looking for that golden crosss before happaning where between sma50 and sma 200 is less then 5%. I created this scanner that it give me some of my wants https://tos.mx/56sFW30 but doesnt give me the 5% or less bet sma 50 & sma 200. May you be able to take a look at and do the corrections?
Thank you much
 
Last edited:
Hi, I was trying to build out a script that would produce one arrow when the price was below/above the 9 and 21 SMA. When I built out the script previously it would show multiple arrows instead of just one and junk up my chart. Can someone take a look and see what I need to do to fix it?

def a = close is greater than simplemovingAvg(9);
def b = close is greater than simplemovingAvg(21);

def c = close is less than simplemovingAvg(9);
def d = close is less than simplemovingAvg(21);

plot up = if (a and b) then low else double.nan;
up.SetPaintingStrategy(PaintingStrategy.Arrow_UP);

plot down = if (c and d) then high else double.nan;
down.SetPaintingStrategy(PaintingStrategy.Arrow_down);
#
 
you'll want to use the crosses() function:
Code:
def ma1 = simplemovingAvg(9);
def ma2 = simplemovingAvg(21);
plot up = if close crosses above max(ma1, ma2) then low else double.nan;
plot down = if close crosses below min(ma1, ma2) then high else double.nan;
up.SetPaintingStrategy(PaintingStrategy.Arrow_UP);
down.SetPaintingStrategy(PaintingStrategy.Arrow_down);
This only plots on the bar immediately after the cross happens.

-mashume
I'm not looking for crosses I just want to know when the close is above both 9 and the 21 sma and just plot it with 1 arrow. The one I sent before was perfect it just had multiple arrows. The cross is too late for me to jump in.
 
I'm not looking for crosses I just want to know when the close is above both 9 and the 21 sma and just plot it with 1 arrow. The one I sent before was perfect it just had multiple arrows. The cross is too late for me to jump in.
The syntax to plot the 1st signal and not the subsequent is:
x and !x[1]
Here is the syntax incorporated into your script
o0riozh.png

Ruby:
# ##################################
# Stacked Moving Averages
# drphilgood1358 1/2023
# ##################################
def a = close is greater than SimpleMovingAvg("length" = 9);
def b = close is greater than SimpleMovingAvg("length" = 21);

def c = close is less than SimpleMovingAvg("length" = 9);
def d = close is less than SimpleMovingAvg("length" = 21);

def uptrend = a and b ;
def dntrend = c and d ;
# ##################################
# Charting & Formatting

#plot sma9 = SimpleMovingAvg("length" = 9);
plot sma12 = SimpleMovingAvg("length" = 21);

plot up = if uptrend and !uptrend[1] then low else double.nan;
     up.SetPaintingStrategy(PaintingStrategy.Arrow_UP);
     up.SetDefaultColor(color.blue);
     up.SetLineWeight(1);

plot down = if dntrend and !dntrend[1] then high else double.nan;
     down.SetPaintingStrategy(PaintingStrategy.Arrow_down);
     down.SetDefaultColor(color.magenta);
     down.SetLineWeight(3);

addcloud(close, SimpleMovingAvg("length" = 21),color.light_green, color.pink);
addcloud(close, SimpleMovingAvg("length" = 9),color.green, color.red);
Thank you so much, I was going crazy trying to figure out how to get it set up correctly and thanks for the cloud too!
 
I have created some code to post a label when the average are all stacked. The colors are not correct and I am missing something but can not see it. Some help would be appreciated.
### define emas ###
def ema8 = ExpAverage(close, 8);
def ema21 = ExpAverage(close, 21);
def sma50 = SimpleMovingAvg(close, 50);

### DefineColor conditions for bullish trade
### Staked EMAS label ###

def Bull_Stacked = (ema8 > ema21 and ema21 > sma50);
def Bear_Stacked = (ema8 < ema21 and ema21 < sma50);

addlabel(yes, "Avgs Stacked", if Bull_Stacked then color.green else
if Bear_Stacked then color.red
else
color.yellow);

The values on the chart are ema8=141.89, ema21=145.02 and sma50=140.45. The label Avg Stacked displays Green. Since the ema8 is clearly less than the ema21 the color should be Yellow. What an I doing wrong?

i don't have an answer... it seems to work for me

i added lines and colored bubbles with values, to help you verify your data


Code:
# stacked_avgs_3

#https://usethinkscript.com/threads/stacked-ema-label-not-working.14464/
#Stacked EMA Label Not Working

### define emas ###
def ema8 = ExpAverage(close, 8);
def ema21 = ExpAverage(close, 21);
def sma50 = SimpleMovingAvg(close, 50);

### DefineColor conditions for bullish trade
### Staked EMAS label ###

def Bull_Stacked = (ema8 > ema21 and ema21 > sma50);
def Bear_Stacked = (ema8 < ema21 and ema21 < sma50);

addlabel(yes, "Avgs Stacked", if Bull_Stacked then color.green else
if Bear_Stacked then color.red
else
color.yellow);

#The values on the chart are ema8=141.89, ema21=145.02 and sma50=140.45. The label Avg Stacked displays Green. Since the ema8 is clearly less than the ema21 the color should be Yellow. What an I doing wrong?


def na = double.nan;

input show_lines = yes;
plot z1 = if show_lines then ema8 else na;
z1.setdefaultcolor(getcolor(1));
z1.hidebubble();

plot z2 = if show_lines then ema21 else na;
z2.setdefaultcolor(getcolor(2));
#z2.setlineweight(1);
z2.hidebubble();

plot z3 = if show_lines then sma50 else na;
z3.setdefaultcolor(getcolor(3));
#z3.setlineweight(1);
z3.hidebubble();


input show_values = yes;
def y = min(low, min(ema8, min(ema21, sma50)));

addchartbubble(show_values, y,
ema8 + " 8\n" +
ema21 + " 21\n" +
sma50 + " 50"
, (if Bull_Stacked then color.green else if Bear_Stacked then color.red else color.gray), no);

#

rbTKKiZ.jpg
How can I post an image so you can see the colors I am getting?
 
How can I post an image so you can see the colors I am getting?
Provide an annotated screenshot of what you are attempting to accomplish w/ your question or to illustrate the issue you are having. Provide at least one screenshot of the whole chart (or scan, watchlist, etc.) and then any close-up screenshots. Don't know how to upload screenshots to the forum? Here are directions.
 
hi all ....I definitely am not a programmer or coder. All I am attempting to do is set a conditional label if the condition of EMAs are met. Hoping someone can steer me straight easily. If the condition are met to go long just looking for it show Green with a label of long; and vice versa for Shorts. What it showing now is both colors green and red regardless of conditions.
Thank you in advance.

plot Data = close;

def long = MovAvgExponential("length" = 8)."AvgExp" is greater than MovAvgWeighted("length" = 30)
and MovAvgExponential("length" = 21)."AvgExp" is greater than MovAvgExponential("length" = 34)."AvgExp"
and MovAvgExponential("length" = 34)."AvgExp" is greater than MovAvgExponential("length" = 55)."AvgExp"
and MovAvgExponential("length" = 55)."AvgExp" is greater than MovAvgExponential("length" = 89)."AvgExp";


def short = MovAvgExponential("length" = 8)."AvgExp" is less than MovAvgWeighted("length" = 30)
and MovAvgExponential("length" = 21)."AvgExp" is less than MovAvgExponential("length" = 34)."AvgExp"
and MovAvgExponential("length" = 34)."AvgExp" is less than MovAvgExponential("length" = 55)."AvgExp"
and MovAvgExponential("length" = 55)."AvgExp" is less than MovAvgExponential("length" = 89)."AvgExp";


AddLabel(yes, "Golong" + long, Color.GREEN);
AddLabel(yes, "Goshort" + short, Color.RED);
else color.gray

The first parameter in AddLabel() determines whether the label is visible or not. You currently have them both set to Yes.

Lucky, your long and short variables are already Boolean conditions, so they're Yes/No answers already.

You can just feed them in directly.

AddLabel(long, " Golong ", Color.GREEN);
AddLabel(short, " Goshort ", Color.RED);

-

An exclamation point before a variable is like saying "Not"

Adding this line will cover the third possibility:

AddLabel(!short and !long, " Nope ", Color.GRAY);

-

Or you could handle the whole thing with one label:

Code:
AddLabel(

    Yes,

    if long then " go long " else if short then " go short " else " nope ",

    if long then color.green else if short then color.red else color.gray

);
 
here is my EMA_x5_Stack script...

Ruby:
#EMA_x5_Stack
#Created by rad14733 for usethinkscript.com
#v1.0 2021-01-02
#NOTE: EMA crossovers can be set to only paint based on long term trends.
#      When configured, EMA crossovers will only paint when filtered by longer term trends (ema1 <> ema5).
# EMA Length's
input ema1Length = 8;
input ema2Length = 21;
input ema3Length = 34;
input ema4Length = 55;
input ema5Length = 89;
input showXovers = yes;

# Display EMA's Stacked Label
input show_stacked_label = yes;
input show_ema_label = yes;

# Conditionally Plot EMA's
plot ema1 = ExpAverage(close, ema1Length);
ema1.SetPaintingStrategy(PaintingStrategy.LINE);
ema1.SetStyle(Curve.FIRM);
ema1.SetLineWeight(1);
ema1.SetDefaultColor(Color.GREEN);
plot ema2 = ExpAverage(close, ema2Length);
ema2.SetPaintingStrategy(PaintingStrategy.LINE);
ema2.SetStyle(Curve.FIRM);
ema2.SetLineWeight(1);
ema2.SetDefaultColor(Color.YELLOW);
plot ema3 = ExpAverage(close, ema3Length);
ema3.SetPaintingStrategy(PaintingStrategy.LINE);
ema3.SetStyle(Curve.FIRM);
ema3.SetLineWeight(1);
ema3.SetDefaultColor(Color.RED);
plot ema4 = ExpAverage(close, ema4Length);
ema4.SetPaintingStrategy(PaintingStrategy.LINE);
ema4.SetStyle(Curve.FIRM);
ema4.SetLineWeight(1);
ema4.SetDefaultColor(Color.MAGENTA);
plot ema5 = ExpAverage(close, ema5Length);
ema5.SetPaintingStrategy(PaintingStrategy.LINE);
ema5.SetStyle(Curve.FIRM);
ema5.SetLineWeight(1);
ema5.SetDefaultColor(Color.BLUE);

# Calculate EMA Crossovers
plot x1a2 = showXovers and ema1 crosses above ema2;
x1a2.SetPaintingStrategy(PaintingStrategy.BOOLEAN_ARROW_UP);
x1a2.SetStyle(Curve.FIRM);
x1a2.SetLineWeight(3);
x1a2.SetDefaultColor(Color.YELLOW);
plot x1b2 = showXovers and ema1 crosses below ema2;
x1b2.SetPaintingStrategy(PaintingStrategy.BOOLEAN_ARROW_DOWN);
x1b2.SetStyle(Curve.FIRM);
x1b2.SetLineWeight(3);
x1b2.SetDefaultColor(Color.DARK_ORANGE);
# Define Global Colors For Clouds
# Crosses Above
DefineGlobalCOlor("x1a2", Color.GREEN);
DefineGlobalCOlor("x2a3", Color.DARK_GREEN);
DefineGlobalCOlor("x3a4", Color.YELLOW);
DefineGlobalCOlor("x4a5", Color.WHITE);
# Crosses Below
DefineGlobalCOlor("x1b2", Color.RED);
DefineGlobalCOlor("x2b3", Color.DARK_RED);
DefineGlobalCOlor("x3b4", Color.MAGENTA);
DefineGlobalCOlor("x4b5", Color.BLUE);

# Paint Clouds
input showClouds = yes;
AddCloud(if showClouds then ema1 else Double.NaN, if showClouds then ema2 else Double.NaN, GlobalColor("x1a2"), GlobalColor("x1b2"));
AddCloud(ema2, ema3, GlobalColor("x2a3"), GlobalColor("x2b3"));
AddCloud(ema3, ema4, GlobalColor("x3a4"), GlobalColor("x3b4"));
AddCloud(ema4, ema5, GlobalColor("x4a5"), GlobalColor("x4b5"));

# Create Chart Label to signify that EMA's are Stacked
def stackedUp = ema1 > ema2 and ema2 > ema3 and ema3 > ema4 and ema4 > ema5;
def stackedDn = ema1 < ema2 and ema2 < ema3 and ema3 < ema4 and ema4 < ema5;
AddLabel(show_ema_label, "" + ema1Length + "|" + ema2Length + "|" + ema3Length + "|" + ema4Length + "|" + ema5Length + "|" + "EMAs", if stackedUp then Color.GREEN else if stackedDn then Color.RED else Color.GRAY);
AddLabel(show_stacked_label, "EMAs Stacked", if stackedUp then Color.GREEN else if stackedDn then Color.RED else Color.GRAY);
# END EMA_5_Stack
1) Hi @rad14733 I modified your above script to a "EMA 8 Stack Script based on Fibonacci numbers" (below script) and removed the clouds because there was a lot going on with 8 EMA's. (I have no experience coding and just wanted to double check to make sure I did it correctly and I did my best with #header info.)

Here is a picture:
Here is the code:

Code:
#EMA_x5_Stack
#Created by rad14733 for usethinkscript.com
#v1.0 2021-01-02
#Modified by LPFibonacci317811 increased to EMA_x8_stack based on Fibonacci numbers
#v1.0 2023-05-15
#NOTE: EMA crossovers can be set to only paint based on long term trends.
#      When configured, EMA crossovers will only paint when filtered by longer term trends (ema1 <> ema8).
# EMA Length's
input ema1Length = 8;
input ema2Length = 13;
input ema3Length = 21;
input ema4Length = 34;
input ema5Length = 55;
input ema6Length = 89;
input ema7length = 144;
input ema8length = 233;
input showXovers = yes;

# Display EMA's Stacked Label
input show_stacked_label = yes;
input show_ema_label = yes;

# Conditionally Plot EMA's
plot ema1 = ExpAverage(close, ema1Length);
ema1.SetPaintingStrategy(PaintingStrategy.LINE);
ema1.SetStyle(Curve.FIRM);
ema1.SetLineWeight(1);
ema1.SetDefaultColor(Color.CYAN);
plot ema2 = ExpAverage(close, ema2Length);
ema2.SetPaintingStrategy(PaintingStrategy.LINE);
ema2.SetStyle(Curve.FIRM);
ema2.SetLineWeight(1);
ema2.SetDefaultColor(Color.lIGHT_GREEN);
plot ema3 = ExpAverage(close, ema3Length);
ema3.SetPaintingStrategy(PaintingStrategy.LINE);
ema3.SetStyle(Curve.FIRM);
ema3.SetLineWeight(1);
ema3.SetDefaultColor(Color.DARK_GREEN);
plot ema4 = ExpAverage(close, ema4Length);
ema4.SetPaintingStrategy(PaintingStrategy.LINE);
ema4.SetStyle(Curve.FIRM);
ema4.SetLineWeight(1);
ema4.SetDefaultColor(Color.YELLOW);
plot ema5 = ExpAverage(close, ema5Length);
ema5.SetPaintingStrategy(PaintingStrategy.LINE);
ema5.SetStyle(Curve.FIRM);
ema5.SetLineWeight(1);
ema5.SetDefaultColor(Color.DARK_ORANGE);
plot ema6 = ExpAverage(close, ema6Length);
ema6.SetPaintingStrategy(PaintingStrategy.LINE);
ema6.SetStyle(Curve.FIRM);
ema6.SetLineWeight(1);
ema6.SetDefaultColor(Color.PINK);
plot ema7 = ExpAverage(close, ema7Length);
ema7.SetPaintingStrategy(PaintingStrategy.LINE);
ema7.SetStyle(Curve.FIRM);
ema7.SetLineWeight(1);
ema7.SetDefaultColor(Color.RED);
plot ema8 = ExpAverage(close, ema8Length);
ema8.SetPaintingStrategy(PaintingStrategy.LINE);
ema8.SetStyle(Curve.FIRM);
ema8.SetLineWeight(1);
ema8.SetDefaultColor(Color.MAGENTA);

# Calculate EMA Crossovers
plot x1a2 = showXovers and ema1 crosses above ema2;
x1a2.SetPaintingStrategy(PaintingStrategy.BOOLEAN_ARROW_UP);
x1a2.SetStyle(Curve.FIRM);
x1a2.SetLineWeight(3);
x1a2.SetDefaultColor(Color.YELLOW);
plot x1b2 = showXovers and ema1 crosses below ema2;
x1b2.SetPaintingStrategy(PaintingStrategy.BOOLEAN_ARROW_DOWN);
x1b2.SetStyle(Curve.FIRM);
x1b2.SetLineWeight(3);
x1b2.SetDefaultColor(Color.DARK_ORANGE);


# Create Chart Label to signify that EMA's are Stacked
def stackedUp = ema1 > ema2 and ema2 > ema3 and ema3 > ema4 and ema4 > ema5 and ema5 > ema6 and ema6 > ema7 and ema7 > ema8;
def stackedDn = ema1 < ema2 and ema2 < ema3 and ema3 < ema4 and ema4 < ema5 and ema5 < ema6 and ema6 < ema7 and ema7 < ema8;
AddLabel(show_ema_label, "" + ema1Length + "|" + ema2Length + "|" + ema3Length + "|" + ema4Length + "|" + ema5Length + "|" + ema6Length + "|" +ema7Length + "|" +ema8Length + "EMAs", if stackedUp then Color.GREEN else if stackedDn then Color.RED else Color.GRAY);
AddLabel(show_stacked_label, "EMAs Stacked", if stackedUp then Color.GREEN else if stackedDn then Color.RED else Color.GRAY);
# END EMA_5_Stack

2) I also wanted to know if it was at all possible to add something like this from TradingView (dvinales) which shades the area light red in a downtrend and light green in an uptrend? (the shading is familiar to @cos251 version that he did with RSM script)

Thanks

Here is the link: https://www.tradingview.com/script/M20Epp9n-Stacked-Moving-Averages/#:~:text=The Stacked Moving Averages indicator,is described as an uptrend.

Here is the picture:
Here is the code: that has to be converted

Code:
// This source code is subject to the terms of the Mozilla Public License 2.0 at https://mozilla.org/MPL/2.0/
// Stacked Moving Average
// © dvinales

//@version=5
indicator("Stacked Moving Averages", shorttitle="Stacked MA", overlay=true)
string timeFrame = input.timeframe(defval="")
int len1 = input.int(title="Length Moving Average 1", defval=8, minval=1)
int len2 = input.int(title="Length Moving Average 2", defval=21, minval=1)
int len3 = input.int(title="Length Moving Average 3", defval=34, minval=1)
int len4 = input.int(title="Length Moving Average 4", defval=55, minval=0)
int len5 = input.int(title="Length Moving Average 5", defval=89, minval=0)
float source = input.source(title="Source", defval=close)
string mafn = input.string(title="Moving Average", defval="EMA", options=["SMA", "EMA", "DEMA", "WMA", "HMA", "RMA"])
bool showSignals = input.bool(title="Show Signals?", defval=true)
color uptrendColor = input.color(color.new(color.green, 75), "Uptrend")
color downtrendColor = input.color(color.new(color.red, 75), "Downtrend")

fnMA(series, length) =>
    if (length > 0)
        switch mafn
            "SMA" => ta.sma(series, length)
            "EMA" => ta.ema(series, length)
            "WMA" => ta.wma(series, length)
            "HMA" => ta.hma(series, length)
            "RMA" => ta.rma(series, length)       
            "DEMA" =>
                emaValue = ta.ema(series, length)
                2 * emaValue - ta.ema(emaValue, length)
            => float(na)
    else
        float(na)

securityNoRepaint(sym, tf, src) =>
    request.security(sym, tf, src[barstate.isrealtime ? 1 : 0])[barstate.isrealtime ? 0 : 1]

ma1 = securityNoRepaint(syminfo.tickerid, timeFrame, fnMA(source, len1))
ma2 = securityNoRepaint(syminfo.tickerid, timeFrame, fnMA(source, len2))
ma3 = securityNoRepaint(syminfo.tickerid, timeFrame, fnMA(source, len3))
ma4 = len4 > 0 ? securityNoRepaint(syminfo.tickerid, timeFrame, fnMA(source, len4)) : float(na)
ma5 = len5 > 0 ? securityNoRepaint(syminfo.tickerid, timeFrame, fnMA(source, len5)) : float(na)

plot(showSignals ? ma1 : float(na), "MA 1", color=color.maroon, linewidth=2)
plot(showSignals ? ma2 : float(na), "MA 2", color=color.fuchsia, linewidth=2)
plot(showSignals ? ma3 : float(na), "MA 3", color=color.orange, linewidth=2)
plot(showSignals ? ma4 : float(na), "MA 4", color=color.aqua, linewidth=2)
plot(showSignals ? ma5 : float(na), "MA 5", color=color.navy, linewidth=2)

is_uptrend = ma1 > ma2 and ma2 > ma3 and (ma3 > ma4 or len4 == 0)  and (ma4 > ma5 or len4 == 0 or len5 == 0)
is_downtrend = (ma5 > ma4 or len4 == 0 or len5 == 0) and (ma4 > ma3 or len4 == 0) and ma3 > ma2 and ma2 > ma1

bgcolor(is_uptrend ? uptrendColor : (is_downtrend ? downtrendColor : na))
 
Last edited:
Hi I am new to writing scripts,Can someone help me add a BUY OR Selll on the chart if price
def EMA8 = expAverage(close,8);
def EMA13 = expAverage(close,13);
def EMA21 = expAverage(close,21);
def EMA34 = expAverage(close,34);

def Bullish = EMA8 > EMA13 and EMA13> EMA21 and EMA21 > EMA34;
def Bearish = EMA8 < EMA13 and EMA13< EMA21 and EMA21 < EMA34;

AddLabel(bullish, "BULLISH Stcked Black MAs",color.black);
AddLabel(bearish, "Bearsh Stcked Black MAs",color.black);
AddLabel(!Bullish and !Bearish, " ",color.black);

AssignBackgroundColor( if bullish then color.GREEN else if bearish then color.RED else color.black);

cross above

This buy/sell labels and optionally ema line and/or buy/sell bubbles. The buy/sell labels will disappear after the bar where these occur. The bubbles, if selected, will remain on the chart.

Screenshot 2023-08-28 091743.png
Code:
input show_ema_lines = yes;
plot EMA8 = ExpAverage(close, 8);
plot EMA13 = ExpAverage(close, 13);
plot EMA21 = ExpAverage(close, 21);
plot EMA34 = ExpAverage(close, 34);
EMA8.SetHiding(!show_ema_lines);
EMA13.SetHiding(!show_ema_lines);
EMA21.SetHiding(!show_ema_lines);
EMA34.SetHiding(!show_ema_lines);

def Bullish = EMA8 > EMA13 and EMA13 > EMA21 and EMA21 > EMA34;
def Bearish = EMA8 < EMA13 and EMA13 < EMA21 and EMA21 < EMA34;

AddLabel(Bullish, "BULLISH Stcked Black MAs", Color.BLACK);
AddLabel(Bearish, "Bearsh Stcked Black MAs", Color.BLACK);
AddLabel(!Bullish and !Bearish, " ", Color.BLACK);

AssignBackgroundColor( if Bullish then Color.GREEN else if Bearish then Color.RED else Color.BLACK);

input show_buy_sell_bubbles = yes;
def buy  = Bullish and !Bullish[1];
def sell = Bearish and !Bearish[1];
AddChartBubble(show_buy_sell_bubbles and buy, low, "Buy", Color.CYAN, no);
AddChartBubble(show_buy_sell_bubbles and sell, high, "Sell", Color.MAGENTA);

AddLabel(buy, "BUY", Color.BLACK);
AddLabel(sell, "SELL", Color.BLACK);
 
Hello everyone, I am looking for a label that states if the weekly ema's are stacked. exactly like the screenshot below on the top right corner.

thank you.
 

Attachments

  • Screenshot 2023-08-30 at 9.07.27 PM.png
    Screenshot 2023-08-30 at 9.07.27 PM.png
    184.6 KB · Views: 92
Hello everyone, I am looking for a label that states if the weekly ema's are stacked. exactly like the screenshot below on the top right corner.

thank you.
You didn't say what moving averages you want stacked; nor how they should be stacked.
But here is some syntax to get you started:

MTF Stacked Moving Averages
Ruby:
def Data1 = close;
input agg = AggregationPeriod.WEEK;
def Data2 = close(period = agg);


def long1 = MovAvgExponential(data1, "length" = 8)."AvgExp" is greater than MovAvgWeighted(data1,"length" = 30)
and MovAvgExponential(data1,"length" = 21)."AvgExp" is greater than MovAvgExponential(data1,"length" = 34)."AvgExp"
and MovAvgExponential(data1,"length" = 34)."AvgExp" is greater than MovAvgExponential(data1,"length" = 55)."AvgExp"
and MovAvgExponential(data1,"length" = 55)."AvgExp" is greater than MovAvgExponential(data1,"length" = 89)."AvgExp";

def long2 = MovAvgExponential(Data2, "length" = 8)."AvgExp" is greater than MovAvgWeighted(Data2,"length" = 30)
and MovAvgExponential(Data2,"length" = 21)."AvgExp" is greater than MovAvgExponential(Data2,"length" = 34)."AvgExp"
and MovAvgExponential(Data2,"length" = 34)."AvgExp" is greater than MovAvgExponential(Data2,"length" = 55)."AvgExp"
and MovAvgExponential(Data2,"length" = 55)."AvgExp" is greater than MovAvgExponential(Data2,"length" = 89)."AvgExp";


AddLabel(long1, "stacked emas" , Color.GREEN);
AddLabel(long2, "stacked weekly emas" , Color.GREEN);
 
  • Love
Reactions: IPA
Here is my EMA_Stack... Watch it and see if it will get you most of the way to where you want to be...
Ruby:
def stackedUp = MovAvgExponential("length" = 8)."AvgExp" is greater than MovAvgExponential("length" = 21)."AvgExp"
and MovAvgExponential("length" = 21)."AvgExp" is greater than MovAvgExponential("length" = 34)."AvgExp"
and MovAvgExponential("length" = 34)."AvgExp" is greater than MovAvgExponential("length" = 55)."AvgExp"
and MovAvgExponential("length" = 55)."AvgExp" is greater than MovAvgExponential("length" = 89)."AvgExp";


def stackedDn = MovAvgExponential("length" = 8)."AvgExp" is less than MovAvgExponential("length" = 21)."AvgExp"
and MovAvgExponential("length" = 21)."AvgExp" is less than MovAvgExponential("length" = 34)."AvgExp"
and MovAvgExponential("length" = 34)."AvgExp" is less than MovAvgExponential("length" = 55)."AvgExp"
and MovAvgExponential("length" = 55)."AvgExp" is less than MovAvgExponential("length" = 89)."AvgExp";


AddLabel(yes, " Stacked ", if stackedUp then Color.GREEN else if stackedDn then Color.RED else Color.GRAY);
Hi. Can I request that this be converted to sma's 10, 20, and 50.

I previously tried but failed. Thanks!
 
Hi. Can I request that this be converted to sma's 10, 20, and 50.

I previously tried but failed. Thanks!

Here ya go:
Ruby:
def stackedUp = Average(close,10) is greater than Average(close,20)
and Average(close,20) is greater than Average(close,50);

def stackedDn = Average(close,10) is less than Average(close,20)
and Average(close,20) is less than Average(close,50);


AddLabel(yes, " Stacked ",
    if stackedUp then Color.GREEN else if stackedDn then Color.RED else Color.GRAY);
 

Join useThinkScript to post your question to a community of 21,000+ developers and traders.

Similar threads

Not the exact question you're looking for?

Start a new thread and receive assistance from our community.

87k+ Posts
357 Online
Create Post

Similar threads

Similar threads

The Market Trading Game Changer

Join 2,500+ subscribers inside the useThinkScript VIP Membership Club
  • Exclusive indicators
  • Proven strategies & setups
  • Private Discord community
  • ‘Buy The Dip’ signal alerts
  • Exclusive members-only content
  • Add-ons and resources
  • 1 full year of unlimited support

Frequently Asked Questions

What is useThinkScript?

useThinkScript is the #1 community of stock market investors using indicators and other tools to power their trading strategies. Traders of all skill levels use our forums to learn about scripting and indicators, help each other, and discover new ways to gain an edge in the markets.

How do I get started?

We get it. Our forum can be intimidating, if not overwhelming. With thousands of topics, tens of thousands of posts, our community has created an incredibly deep knowledge base for stock traders. No one can ever exhaust every resource provided on our site.

If you are new, or just looking for guidance, here are some helpful links to get you started.

What are the benefits of VIP Membership?
VIP members get exclusive access to these proven and tested premium indicators: Buy the Dip, Advanced Market Moves 2.0, Take Profit, and Volatility Trading Range. In addition, VIP members get access to over 50 VIP-only custom indicators, add-ons, and strategies, private VIP-only forums, private Discord channel to discuss trades and strategies in real-time, customer support, trade alerts, and much more. Learn all about VIP membership here.
How can I access the premium indicators?
To access the premium indicators, which are plug and play ready, sign up for VIP membership here.
Back
Top