SPX Accumulation/Distribution For ThinkOrSwim

hboogie

Member
Plus
The author states:
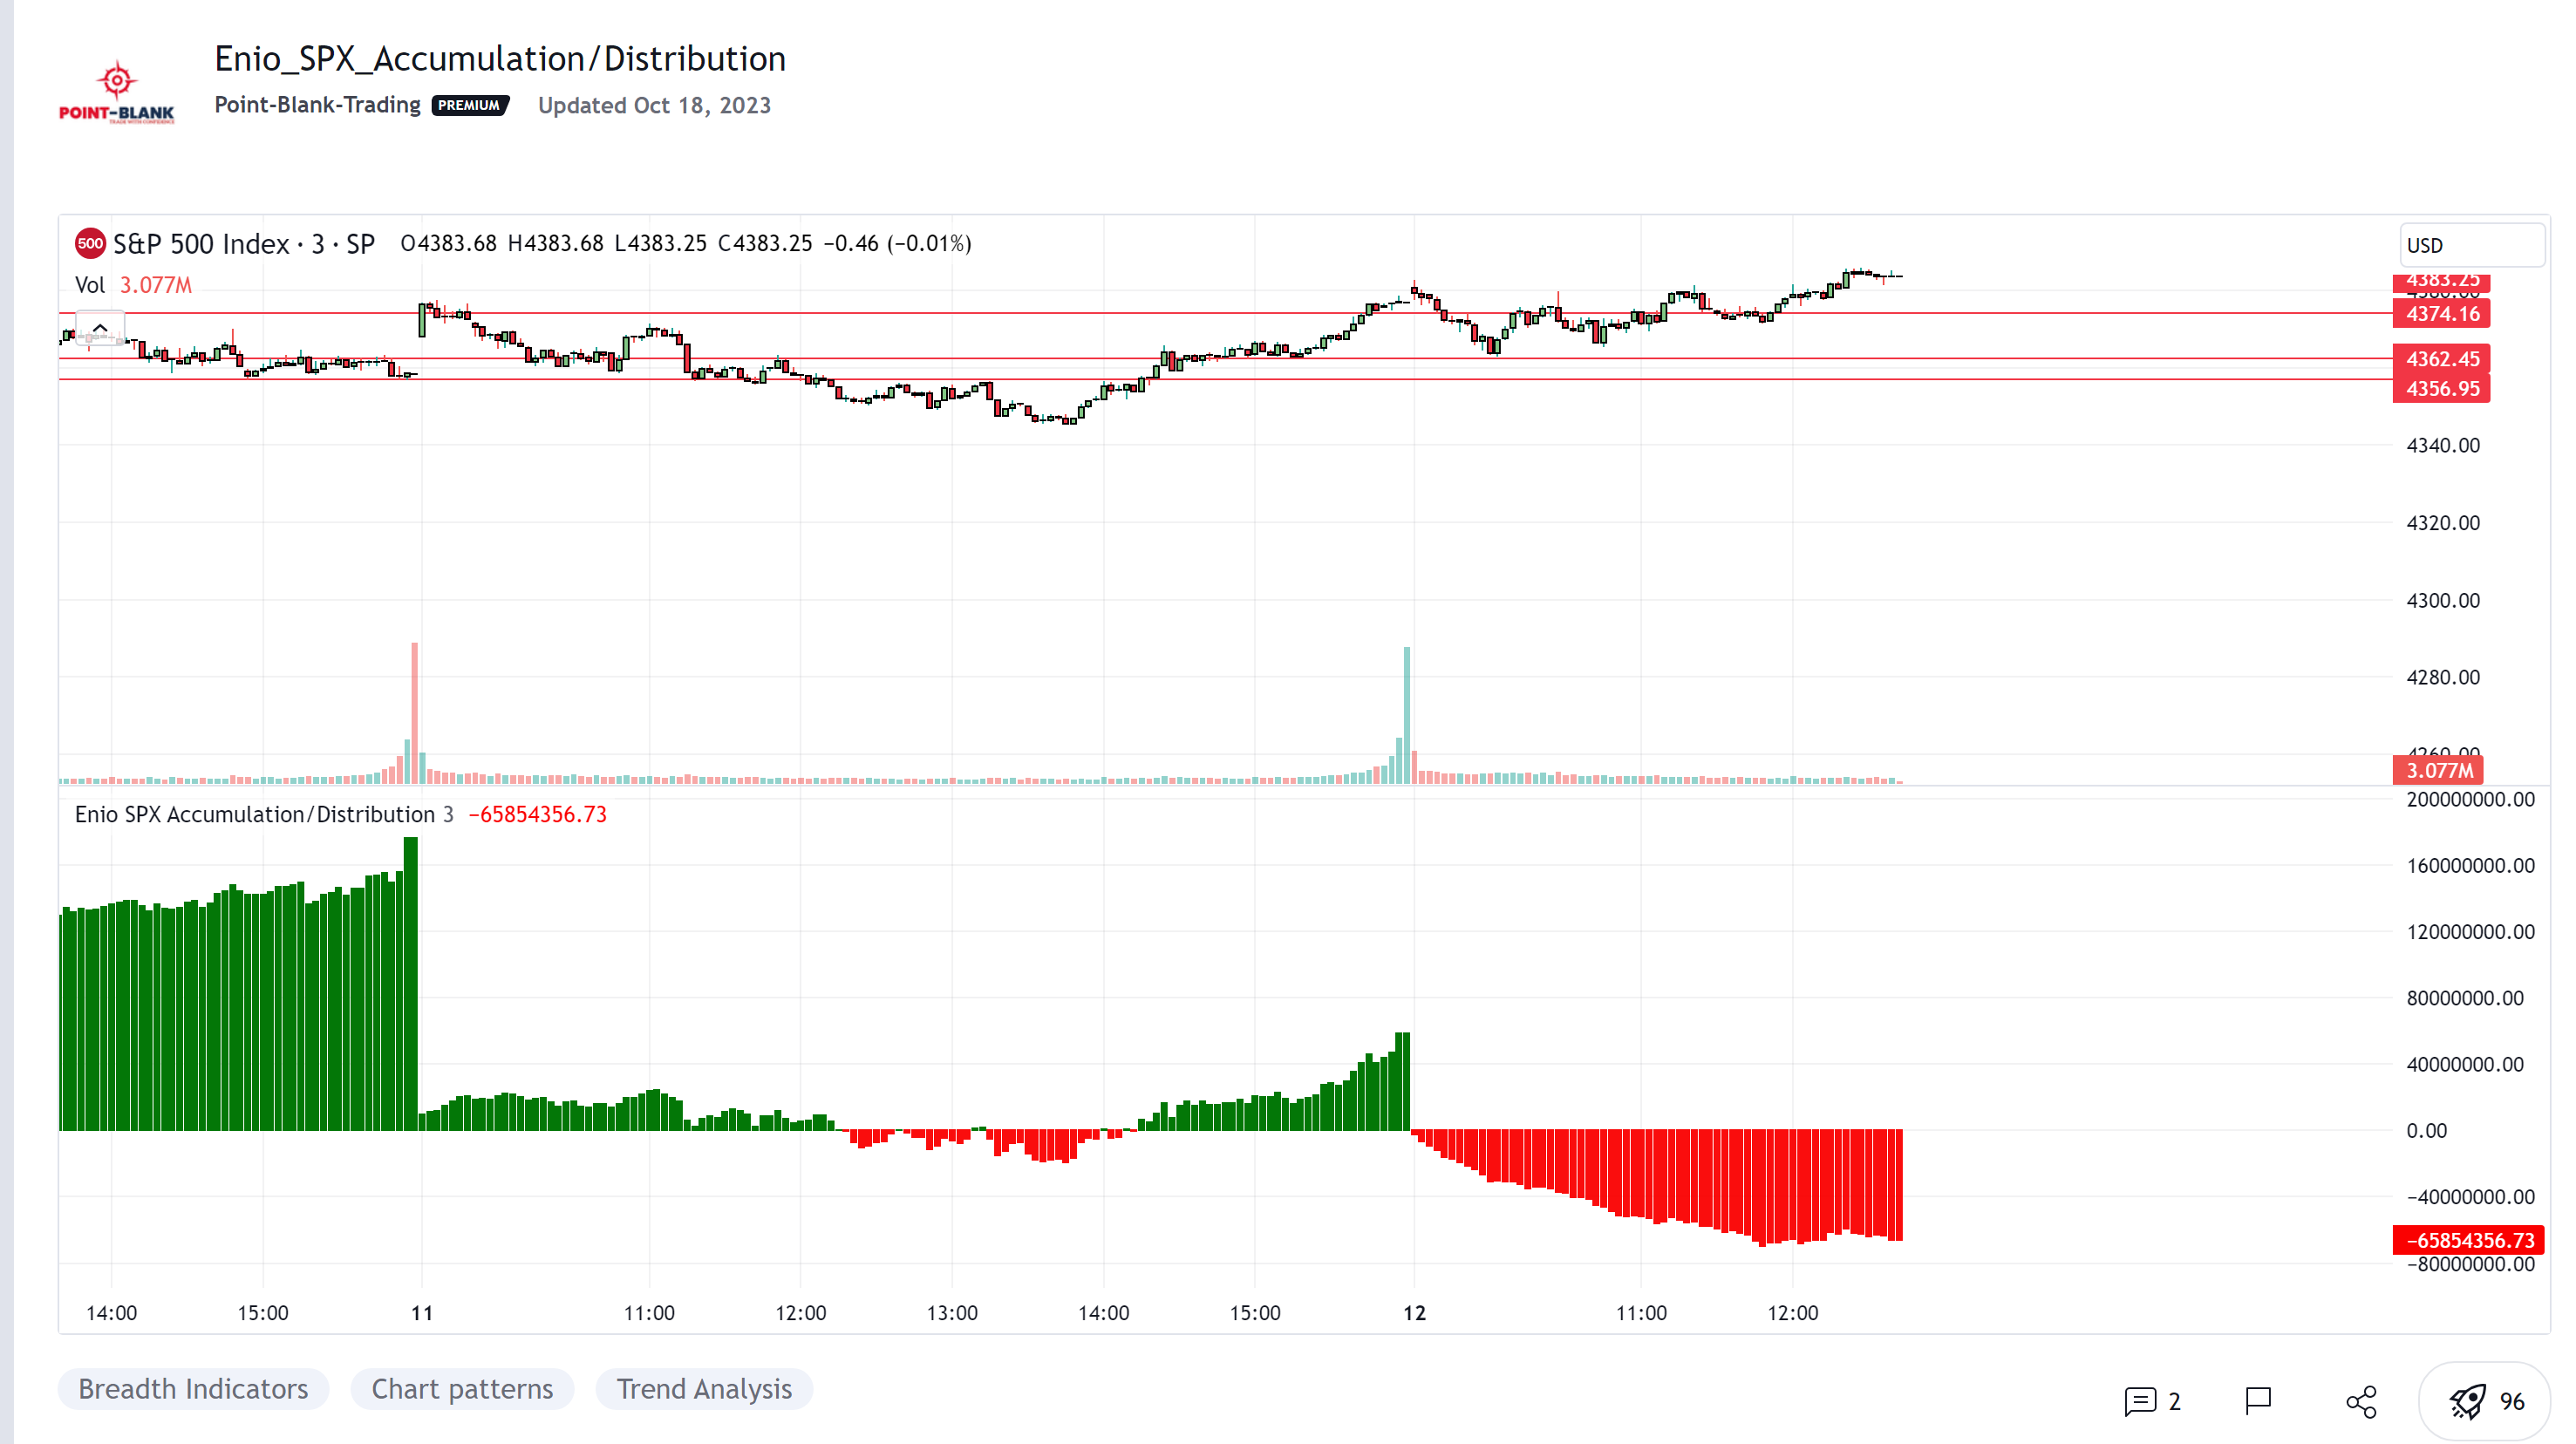
This Accumulation / Distribution indicator is used to compare the positive volume (up volume) and the number of advancing stocks against the negative volume (down volume) and the number of declining stocks.

This indicator only measures SPX market breadth (Advancing issues, Declining issues) and SPX volume (Up and down volume)so it is for use only with SPX, SPY or MES. It can also be used with ES, but data outside of regular trading hours is not provided, the indicator in those cases will print a block of the same height and same color as the last RTH bar.

When the histogram is positive or green, the bars change to a lighter color if the current bar is less than the average of the last 3 bars. A continued set of bars with a lighter color could mean that the trend is about to change.

When the histogram is negative or red, the bars change to a lighter color if the current bar is greater than the average of the last 3 bars. A continued set of bars with a lighter color could mean that the trend is about to change.

When the histogram height is low, could signal a choppy market (SPX).

The histogram can help indicate a trending market when the opening trend is maintained and the color of the bars does not change, for example, a solid green increasing histogram can indicate a bullish trending market, while a solid red decreasing histogram will indicate a strong bearish trend.

In intraday trading the indicator can signal if the SPX price changes are supported by volume and market breadth and also allows you to see when these changes or trend are weakening.

The change from green (positive) to red (negative) and vice versa should not be taken alone as a buy/sell signal but as a confirmation of signals from other indicators you trust.

Due to the great specific weight that some stocks have within the SPX price calculation, the divergences of this indicator with SPX, can be taken as warning signals, but should not become an element of trading decisions.. You could see a negative histogram while SPX is positive and vice versa.
5pZNeRJ.png


Hi, can someone convert this lovely indicator and provide an input that allows me to change the index from SPX to NDX as well
https://www.tradingview.com/script/f08K4GfI-Enio-SPX-Accumulation-Distribution/

Thank you!
 
Last edited by a moderator:
Hi, can someone convert this lovely indicator and provide an input that allows me to change the index from SPX to NDX as well


https://www.tradingview.com/script/f08K4GfI-Enio-SPX-Accumulation-Distribution/

Thank you!
find below

CSS:
#// This source code is subject to the terms of the Mozilla Public License 2.0 at
#// © Point-Blank-Trading
#indicator("Enio SPX Accumulation/Distribution")
# Converted by Sam4Cok@Samer800    - 01/2024
declare lower;

input plotStyle = {Default "Histogram", "Candlesticks"};    # "Plot style"
input lengthAD = 3;#, "AccDist_MA_length", minval=1, maxval=200, step=1)

def na = Double.NaN;
def hist = plotStyle==plotStyle."Histogram";

def aVol_open  = open(Symbol = "$UVOL");
def aVol_high  = high(Symbol = "$UVOL");
def aVol_low   = low(Symbol = "$UVOL");
def aVol_close = close(Symbol = "$UVOL");

def aIs_open  = open(Symbol = "$ADVN");
def aIs_high  = high(Symbol = "$ADVN");
def aIs_low   = low(Symbol = "$ADVN");
def aIs_close = close(Symbol = "$ADVN");

def dVol_open  = open(Symbol = "$DVOL");
def dVol_high  = high(Symbol = "$DVOL");
def dVol_low   = low(Symbol = "$DVOL");
def dVol_close = close(Symbol = "$DVOL");

def dIs_open  = open(Symbol = "$DECN");
def dIs_high  = high(Symbol = "$DECN");
def dIs_low   = low(Symbol = "$DECN");
def dIs_close = close(Symbol = "$DECN");

def ind_open = open(Symbol = "SPX");
def ind_high = high(Symbol = "SPX");
def ind_low = low(Symbol = "SPX");
def ind_close = close(Symbol = "SPX");

def AccDis_open = (aVol_open * aIs_open - dVol_open * dIs_open) / ind_open;
def AccDis_high = (aVol_open *aIs_high - dVol_high * dIs_high) / ind_high;
def AccDis_low = (aVol_open * aIs_low - dVol_low * dIs_low) / ind_low;
def AccDis_close = (aVol_close * aIs_close - dVol_close * dIs_close) / ind_close;
def nzAccClose = if !isNaN(AccDis_close) then AccDis_close else nzAccClose[1];
def AD_MA = Average(nzAccClose, lengthAD);
DefineGlobalColor("ExtUp", CreateColor(3, 119, 7));
DefineGlobalColor("NorUp", CreateColor(51, 172, 113));
DefineGlobalColor("ExtDn", CreateColor(250, 1, 1));
DefineGlobalColor("NorDn", CreateColor(224, 138, 138));

def col = if AccDis_close > 0 then if AccDis_close > AD_MA then 2 else 1 else
                                   if AccDis_close <AD_MA then -2 else -1;

plot AccDis_Hist = if hist then AccDis_close else na;
AccDis_Hist.SetPaintingStrategy(PaintingStrategy.SQUARED_HISTOGRAM);
AccDis_Hist.AssignValueColor(if col == 2 then GlobalColor("ExtUp") else
                             if col == 1 then GlobalColor("NorUp") else
                             if col ==-2 then GlobalColor("ExtDn") else GlobalColor("NorDn"));

# Plot the new Chart

AddChart(open = if !hist and col == 2 then AccDis_close else na, high = AccDis_high , low = AccDis_low ,   close = AccDis_open,
         type = ChartType.CANDLE, growcolor = GlobalColor("ExtUp"));
AddChart(open = if !hist and col == 1 then AccDis_open else na, high = AccDis_high , low = AccDis_low ,   close = AccDis_close,
         type = ChartType.CANDLE, growcolor = GlobalColor("NorUp"));

AddChart(open = if !hist and col ==-2 then AccDis_open else na, high = AccDis_high , low = AccDis_low ,   close = AccDis_close,
         type = ChartType.CANDLE, growcolor = GlobalColor("ExtDn"));
AddChart(open = if !hist and col ==-1 then AccDis_close else na, high = AccDis_high , low = AccDis_low ,   close = AccDis_open,
         type = ChartType.CANDLE, growcolor = GlobalColor("NorDn"));


#-- ENd of Code
 
The author states:
This Accumulation / Distribution indicator is used to compare the positive volume (up volume) and the number of advancing stocks against the negative volume (down volume) and the number of declining stocks.

This indicator only measures SPX market breadth (Advancing issues, Declining issues) and SPX volume (Up and down volume)so it is for use only with SPX, SPY or MES. It can also be used with ES, but data outside of regular trading hours is not provided, the indicator in those cases will print a block of the same height and same color as the last RTH bar.

When the histogram is positive or green, the bars change to a lighter color if the current bar is less than the average of the last 3 bars. A continued set of bars with a lighter color could mean that the trend is about to change.

When the histogram is negative or red, the bars change to a lighter color if the current bar is greater than the average of the last 3 bars. A continued set of bars with a lighter color could mean that the trend is about to change.

When the histogram height is low, could signal a choppy market (SPX).

The histogram can help indicate a trending market when the opening trend is maintained and the color of the bars does not change, for example, a solid green increasing histogram can indicate a bullish trending market, while a solid red decreasing histogram will indicate a strong bearish trend.

In intraday trading the indicator can signal if the SPX price changes are supported by volume and market breadth and also allows you to see when these changes or trend are weakening.

The change from green (positive) to red (negative) and vice versa should not be taken alone as a buy/sell signal but as a confirmation of signals from other indicators you trust.

Due to the great specific weight that some stocks have within the SPX price calculation, the divergences of this indicator with SPX, can be taken as warning signals, but should not become an element of trading decisions.. You could see a negative histogram while SPX is positive and vice versa.

5pZNeRJ.png


Hi, can someone convert this lovely indicator and provide an input that allows me to change the index from SPX to NDX as well
https://www.tradingview.com/script/f08K4GfI-Enio-SPX-Accumulation-Distribution/

Thank you!

It's easy enough to change SPX to NDX in the code, but I'm not quite certain that's all that is required.
 
Last edited by a moderator:

Join useThinkScript to post your question to a community of 21,000+ developers and traders.

Similar threads

Not the exact question you're looking for?

Start a new thread and receive assistance from our community.

87k+ Posts
384 Online
Create Post

Similar threads

Similar threads

The Market Trading Game Changer

Join 2,500+ subscribers inside the useThinkScript VIP Membership Club
  • Exclusive indicators
  • Proven strategies & setups
  • Private Discord community
  • ‘Buy The Dip’ signal alerts
  • Exclusive members-only content
  • Add-ons and resources
  • 1 full year of unlimited support

Frequently Asked Questions

What is useThinkScript?

useThinkScript is the #1 community of stock market investors using indicators and other tools to power their trading strategies. Traders of all skill levels use our forums to learn about scripting and indicators, help each other, and discover new ways to gain an edge in the markets.

How do I get started?

We get it. Our forum can be intimidating, if not overwhelming. With thousands of topics, tens of thousands of posts, our community has created an incredibly deep knowledge base for stock traders. No one can ever exhaust every resource provided on our site.

If you are new, or just looking for guidance, here are some helpful links to get you started.

What are the benefits of VIP Membership?
VIP members get exclusive access to these proven and tested premium indicators: Buy the Dip, Advanced Market Moves 2.0, Take Profit, and Volatility Trading Range. In addition, VIP members get access to over 50 VIP-only custom indicators, add-ons, and strategies, private VIP-only forums, private Discord channel to discuss trades and strategies in real-time, customer support, trade alerts, and much more. Learn all about VIP membership here.
How can I access the premium indicators?
To access the premium indicators, which are plug and play ready, sign up for VIP membership here.
Back
Top