
The author states:
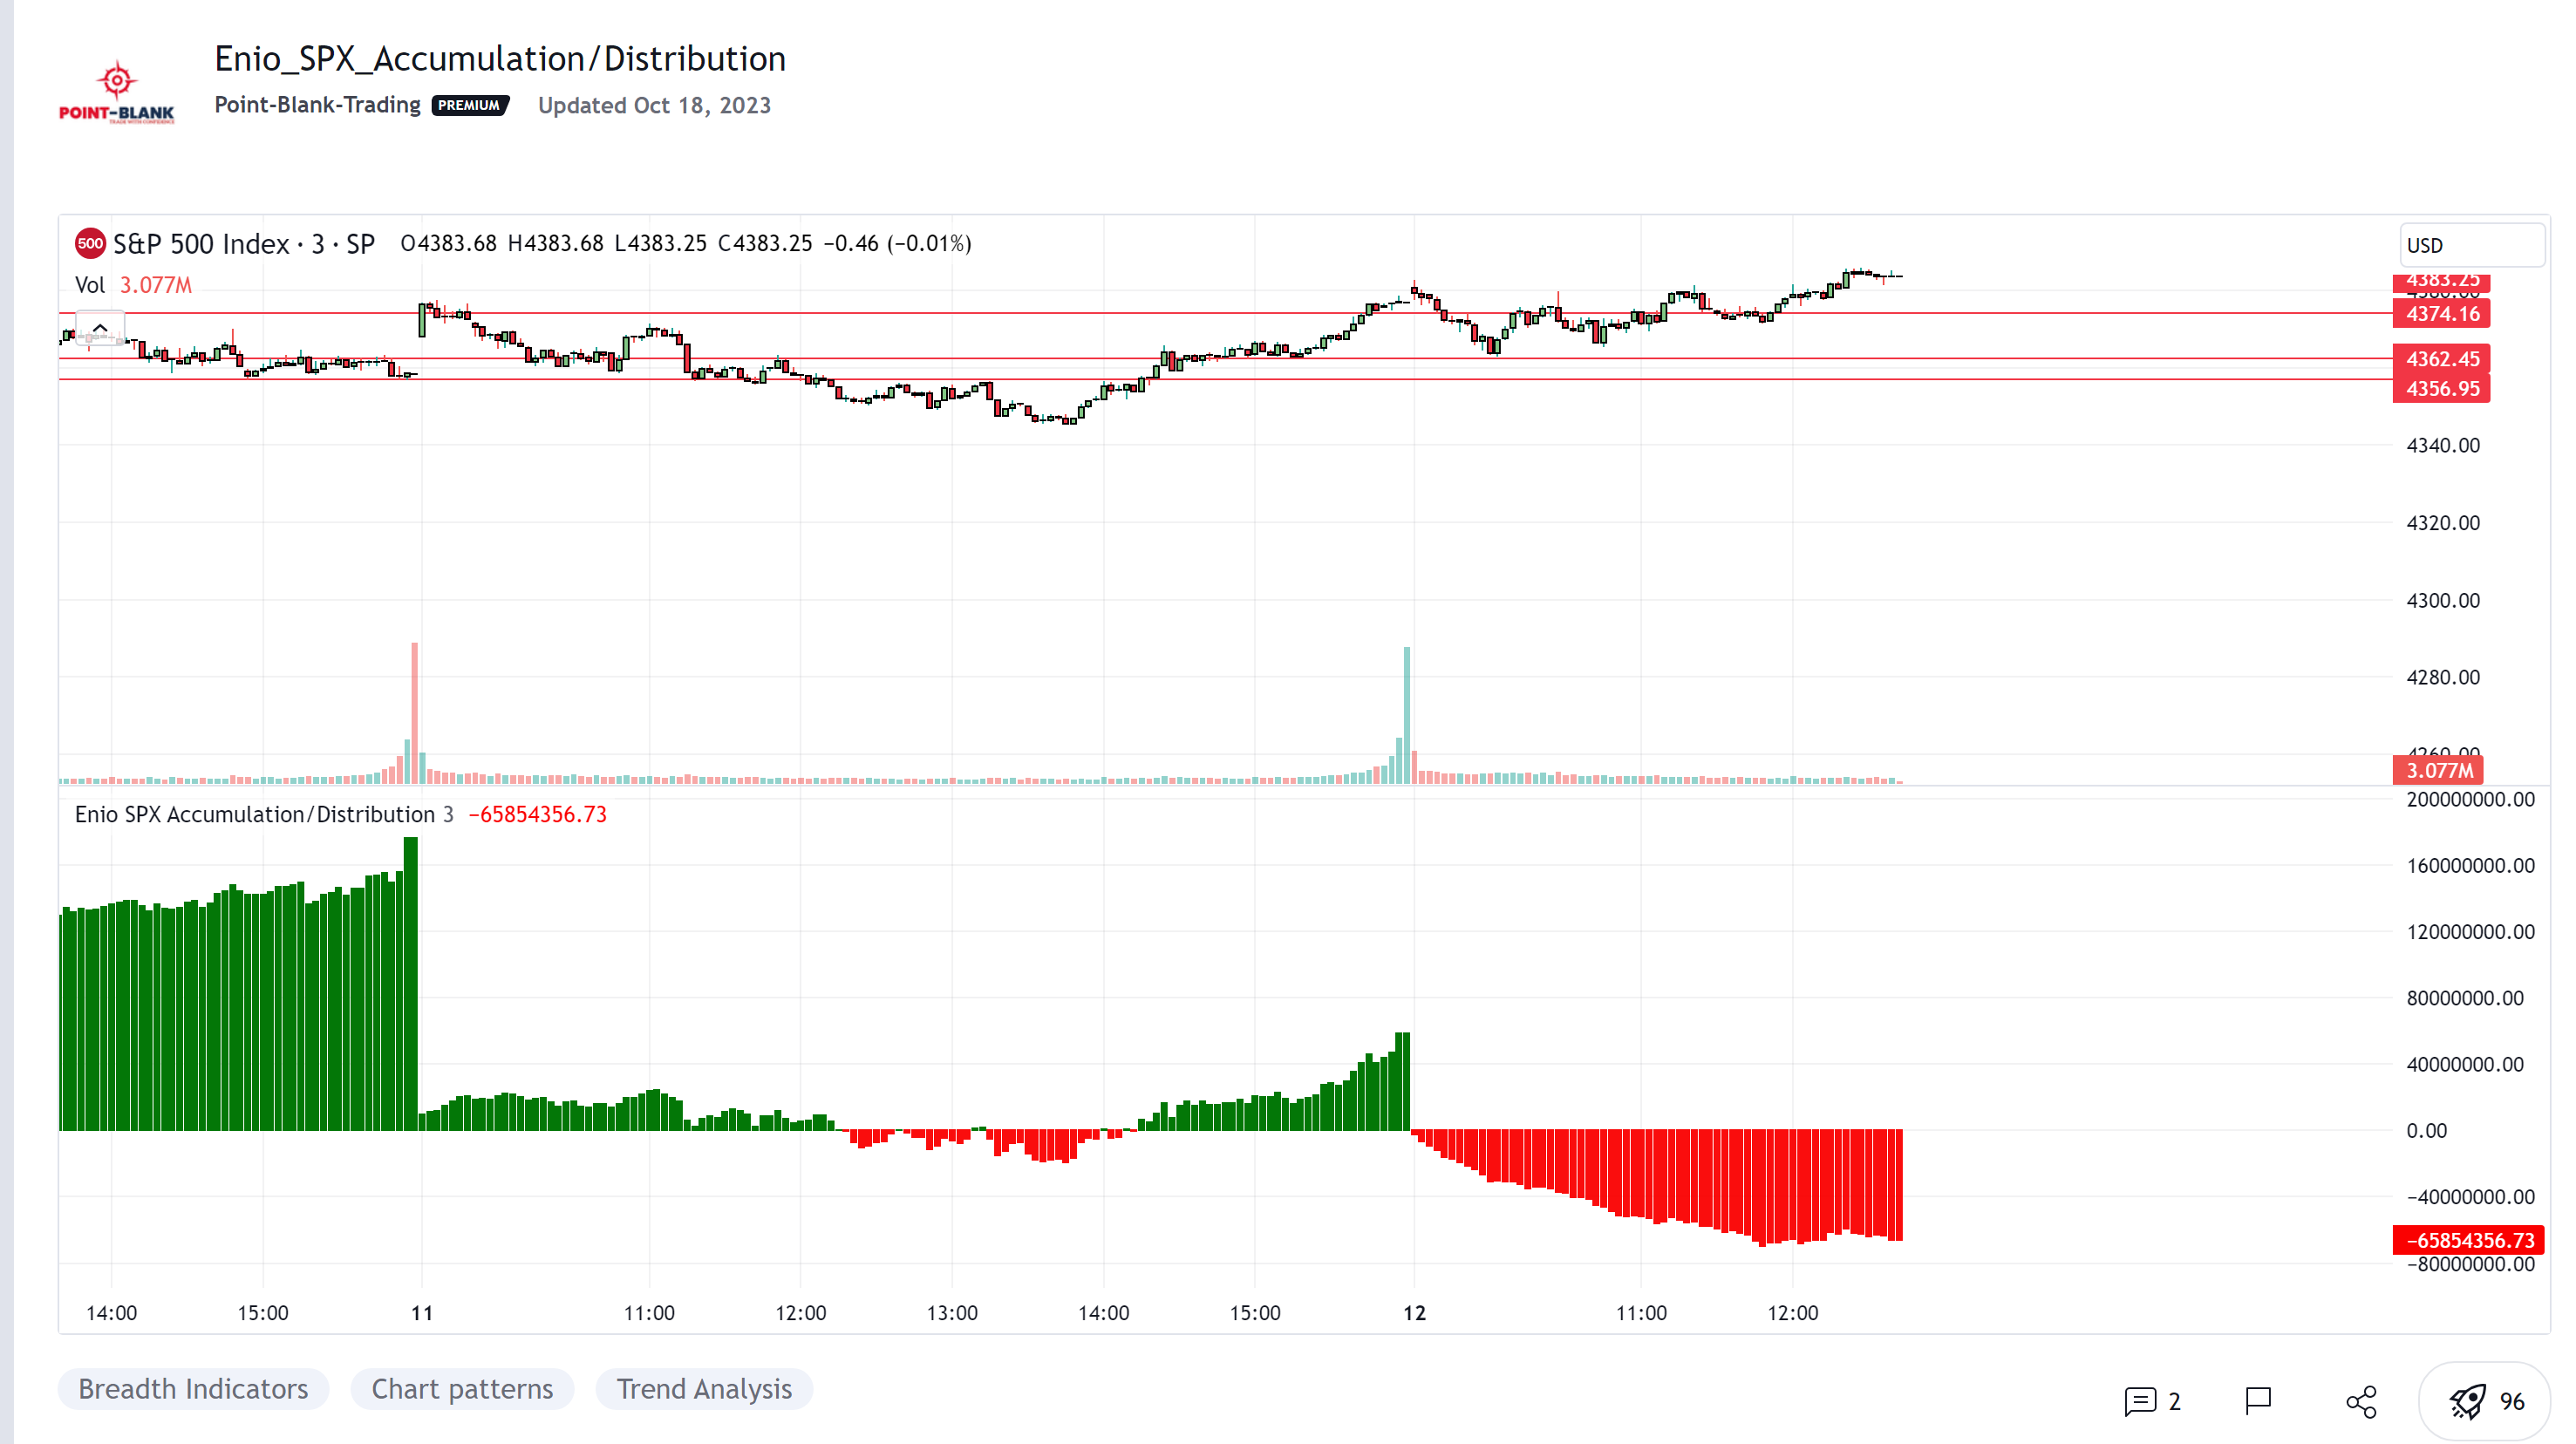
This Accumulation / Distribution indicator is used to compare the positive volume (up volume) and the number of advancing stocks against the negative volume (down volume) and the number of declining stocks.
This indicator only measures SPX market breadth (Advancing issues, Declining issues) and SPX volume (Up and down volume)so it is for use only with SPX, SPY or MES. It can also be used with ES, but data outside of regular trading hours is not provided, the indicator in those cases will print a block of the same height and same color as the last RTH bar.
When the histogram is positive or green, the bars change to a lighter color if the current bar is less than the average of the last 3 bars. A continued set of bars with a lighter color could mean that the trend is about to change.
When the histogram is negative or red, the bars change to a lighter color if the current bar is greater than the average of the last 3 bars. A continued set of bars with a lighter color could mean that the trend is about to change.
When the histogram height is low, could signal a choppy market (SPX).
The histogram can help indicate a trending market when the opening trend is maintained and the color of the bars does not change, for example, a solid green increasing histogram can indicate a bullish trending market, while a solid red decreasing histogram will indicate a strong bearish trend.
In intraday trading the indicator can signal if the SPX price changes are supported by volume and market breadth and also allows you to see when these changes or trend are weakening.
The change from green (positive) to red (negative) and vice versa should not be taken alone as a buy/sell signal but as a confirmation of signals from other indicators you trust.
Due to the great specific weight that some stocks have within the SPX price calculation, the divergences of this indicator with SPX, can be taken as warning signals, but should not become an element of trading decisions.. You could see a negative histogram while SPX is positive and vice versa.
Hi, can someone convert this lovely indicator and provide an input that allows me to change the index from SPX to NDX as well
https://www.tradingview.com/script/f08K4GfI-Enio-SPX-Accumulation-Distribution/
Thank you!
Last edited by a moderator: