So I'll take a stab at time based values here. I'm not sure what to anchor the first bar SMI value to, and someone else will likely find a serious flaw in what I've got going on.
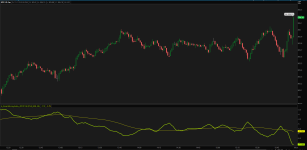
This does plot.
This only works on charts 30 min and under. It will do odd things on longer time frames. There is no good way to get intraday information in thinkscript on daily timeframes.
My understanding of the SMI is that it takes the first hour and the last half hour. If the first hour is positive, the label is red, if the last half hour is negative, the label is read. This is intentional.
I tied the first value of the SMI to the close from the day before the chart starts. This is not ideal, perhaps, but gives you a reference for the SMI vs your chart over the length of time displayed on your chart.
Perhaps this gets one of you closer to a real solution to the problem.
happy trading, mashume
This does plot.
This only works on charts 30 min and under. It will do odd things on longer time frames. There is no good way to get intraday information in thinkscript on daily timeframes.
My understanding of the SMI is that it takes the first hour and the last half hour. If the first hour is positive, the label is red, if the last half hour is negative, the label is read. This is intentional.
I tied the first value of the SMI to the close from the day before the chart starts. This is not ideal, perhaps, but gives you a reference for the SMI vs your chart over the length of time displayed on your chart.
Code:
# SMI Attempt 1
# @Mashume
# 2020-02-04

declare lower;
def b = BarNumber();

def opening_bell = if SecondsFromTime(0930) == 0 then open else if SecondsFromTime(0930) > 0 then opening_bell[1] else Double.NaN;

def end_opening_hour = if SecondsFromTime(1030) == 0 then close else if SecondsFromTime(1030) > 0 then end_opening_hour[1] else Double.NaN;

def start_last_thirty = if SecondsFromTime(1500) == 0 then open else if SecondsFromTime(1500) > 0 then start_last_thirty[1] else double.NaN;

def closing_bell = if secondsFromTime(1600) == 0 then close else if secondsFromTime(1600) > 0 then closing_bell[1] else double.nan;
# def closing_bell =  close(period = AggregationPeriod.DAY, priceType = PriceType.LAST);

def morning_change = end_opening_hour - opening_bell;
# AddLabel(yes, "m-o: " + opening_bell + "  1-h: " + end_opening_hour + "  DIFF: " + morning_change, Color.BLACK);
AddLabel(yes, "Morning: " + morning_change, if morning_change > 0 then color.red else color.green);

def afternoon_change = closing_bell - start_last_thirty;
# AddLabel(yes, "a-o: " + opening_bell + "  d-close: " + end_opening_hour + "  DIFF: " + afternoon_change, Color.BLACK);
AddLabel(yes, "Afternoon: " + afternoon_change, if afternoon_change < 0 then color.red else color.green);

def morning = morning_change;
def afternoon = afternoon_change;
plot previous_close = close(period = AggregationPeriod.DAY, priceType = PriceType.LAST)[1];
previous_close.setDefaultColor(color.dark_red);
# original:
def SMI_calc = if b == 1 then previous_close else if !IsNaN(morning) and !IsNaN(afternoon) then SMI_calc[1] - morning + afternoon else SMI_calc[1];

#day frame
# def SMI_calc = if isNaN(SMI_calc[1]) then previous_close else (SMI_calc[1] - morning) + afternoon ;
AddLabel(yes, "SMI: " + SMI_calc, Color.BLUE);
plot SMI = SMI_calc;
SMI.SetDefaultColor(color.blue);
AddCloud(SMI,  previous_close,  Color.LIME,  Color.PINK);
Perhaps this gets one of you closer to a real solution to the problem.
happy trading, mashume