SharkWaveTrend For ThinkOrSwim

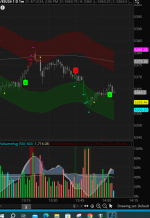
I made an UPPER version of the Sharkwave. It shows the colored clouds and square dots. Also included colored candles.

1702494228996.png


Code:
#Sharkwave_UPPER
#study(title = 'SharkWaveTrend', shorttitle = 'SharkWaveTrend')
# Converted by Sam4Cok@Samer800 - 12/2023
# Assembled for Upper chart, cloud and dots by Chewie


declare upper;
input colorBars = no;
input SharkCloud = yes;
input ColorBar = yes;
input vwapShow = no;#(true, title = 'Show Fast WT', type = input.bool)
input wtChannelLen = 9;#, title = 'WT Channel Length', type = input.integer)
input wtAverageLen = 12;#, title = 'WT Average Length', type = input.integer)
input wtMASource = hlc3;#, title = 'WT MA Source', type = input.source)
input wtMaLen = 3;#, title = 'WT MA Length', type = input.integer)
input obLevel = 53;#, title = 'WT Overbought Level 1', type = input.integer)
input osLevel = -53;#, title = 'WT Oversold Level 1', type = input.integer)
input wtShowDiv = yes;#(true, title = 'Show WT Regular Divergences', type = input.bool)
input wtShowHiddenDiv = no;#(false, title = 'Show WT Hidden Divergences', type = input.bool)
input showHiddenDiv_nl = yes;#(true, title = 'Not apply OB/OS Limits on Hidden Divergences', type = input.bool)
input wtDivOBLevel = 45;#, title = 'WT Bearish Divergence min', type = input.integer)
input wtDivOSLevel = -65;#, title = 'WT Bullish Divergence min', type = input.integer)
input wtDivOBLevel_addshow = yes;#(true, title = 'Show 2nd WT Regular Divergences', type = input.bool)
input wtDivOBLevel_add = 15;#, title = 'WT 2nd Bearish Divergence', type = input.integer)
input wtDivOSLevel_add = -40;#, title = 'WT 2nd Bullish Divergence 15 min', type = input.integer)
input rsiMFIShow = no;#(true, title = 'Show MFI', type = input.bool)
input rsiMFIperiod = 60;#,title = 'MFI Period', type = input.integer)
input rsiMFIMultiplier = 150;#, title = 'MFI Area multiplier', type = input.float)
input rsiMFIPosY = 2.5;#, title = 'MFI Area Y Pos', type = input.float)
input showRsiLine = no;    #(false, title = 'Show RSI', type = input.bool)
input rsiSRC = close;#(close, title = 'RSI Source', type = input.source)
input rsiLen = 12;#, title = 'RSI Length', type = input.integer)
#input rsiOversold = 30;#, title = 'RSI Oversold', minval = 50, maxval = 100, type = input.integer)
#input rsiOverbought = 60;#, title = 'RSI Overbought', minval = 0, maxval = 50, type = input.integer)
input rsiShowDiv = yes;#(false, title = 'Show RSI Regular Divergences', type = input.bool)
input rsiShowHiddenDiv = no;#(false, title = 'Show RSI Hidden Divergences', type = input.bool)
input rsiDivOBLevel = 60;#, title = 'RSI Bearish Divergence min', type = input.integer)
input rsiDivOSLevel = 30;#, title = 'RSI Bullish Divergence min', type = input.integer)
input stochShow = no;#(true, title = 'Show Stochastic RSI', type = input.bool)
input stochUseLog = yes;#(true, title=' Use Log?', type = input.bool)
input stochAvg = no;#(false, title='Use Average of both K & D', type = input.bool)
input stochSRC = close;#(close, title = 'Stochastic RSI Source', type = input.source)
input stochLen = 14;#, title = 'Stochastic RSI Length', type = input.integer)
input stochRsiLen = 14;#, title = 'RSI Length ', type = input.integer)
input stochKSmooth = 3;#, title = 'Stochastic RSI K Smooth', type = input.integer)
input stochDSmooth = 3;#, title = 'Stochastic RSI D Smooth', type = input.integer)
input stochShowDiv = yes;#(false, title = 'Show Stoch Regular Divergences', type = input.bool)
input stochShowHiddenDiv = no;#(false, title = 'Show Stoch Hidden Divergences', type = input.bool)
input rsiLengthInput = 12;#, minval=1, title="RSI Length", group="Shark")
input rsiSourceInput = close;#, "Source", group="Shark")
input length2 = 30;#, minval=1, group="Shark")
input src = close;#, title="Source", group="Shark")
input mult = 2.0;#, minval=0.001, maxval=50, title="StdDev", group="Shark")
input offset = 0;#, "Offset", minval = -500, maxval = 500, group="Shark")
input HighlightBreaches = yes;#, title="Highlight Oversold/Overbought", group="Shark")
input bApply25and75 = no;#, title="Apply 25/75 RSI rule", group="Shark")


def na = Double.NaN;
def last = IsNaN(close);
def pos = Double.POSITIVE_INFINITY;
def neg = Double.NEGATIVE_INFINITY;

DefineGlobalColor("intense_red", Color.RED);#CreateColor(255, 35, 35));
DefineGlobalColor("regular_red", Color.DARK_RED);#CreateColor(255, 82, 82));
DefineGlobalColor("intense_green", Color.GREEN);#CreateColor(0, 230, 118));
DefineGlobalColor("regular_green", Color.DARK_GREEN);#CreateColor(76, 175, 80));
#DefineGlobalColor("wt1", CreateColor(217,205,205));
DefineGlobalColor("wt1", color.white);
DefineGlobalColor("wt2", CreateColor(51, 153, 255));
#DefineGlobalColor("wt2", CreateColor(29, 63, 97));
#// } FUNCTIONS
#f_findDivs(src, topLimit, botLimit, useLimits) =>
script f_findDivs {
    input src = close;
    input topLimit = 70;
    input botLimit = 30;
    input useLimits = yes;
    def na = Double.NaN;
    def topfractal = src[4] < src[2] and src[3] < src[2] and src[2] > src[1] and src[2] > src[0];
    def botfractal = src[4] > src[2] and src[3] > src[2] and src[2] < src[1] and src[2] < src[0];
    def top_fractal = if isNaN(topfractal) then 0 else topfractal;
    def bot_fractal = if isNaN(botfractal) then 0 else botfractal;
    def fractalize  = if top_fractal then 1 else if bot_fractal then -1 else 0;
    def fractalTop = if fractalize > 0 and (if useLimits then src[2] >= topLimit else yes) then src[2] else na;
    def fractalBot = if fractalize < 0 and (if useLimits then src[2] <= botLimit else yes) then src[2] else na;
    def TopCond = if !IsNaN(fractalTop) and fractalTop then fractalTop else 0;
    def BotCond = if !IsNaN(fractalBot) and fractalBot then fractalBot else 0;
    def highPrev0;
    def highPrev1;
    def highPrice0;
    def highPrice1;
    if TopCond {
        highPrev1  = highPrev0[1];
        highPrev0  = src[2];
        highPrice1 = highPrice0[1];
        highPrice0 = high[2];
    } else {
        highPrev1  = highPrev1[1];
        highPrev0  = highPrev0[1];
        highPrice1 = highPrice1[1];
        highPrice0 = highPrice0[1];
    }
    def highPrev = highPrev1[2];#if highPrev1 != highPrev1[1] then highPrev1[1] else highPrev[1];
    def highPrice = highPrice1[2];#if highPrice1 != highPrice1[1] then highPrice1[1] else highPrice[1];
    def lowPrev0;
    def lowPrev1;
    def lowPrice0;
    def lowPrice1;
    if BotCond {
        lowPrev1  = lowPrev0[1];
        lowPrev0  = src[2];
        lowPrice1 = lowPrice0[1];
        lowPrice0 = low[2];
    } else {
        lowPrev1  = lowPrev1[1];
        lowPrev0  = lowPrev0[1];
        lowPrice1 = lowPrice1[1];
        lowPrice0 = lowPrice0[1];
    }
    def lowPrev = lowPrev1[2];#if lowPrev1 != lowPrev1[1] then lowPrev1[1] else lowPrev[1];
    def lowPrice = lowPrice1[2];#if lowPrice1 != lowPrice1[1] then lowPrice1[1] else lowPrice[1];
    def bearSignal = TopCond and high[2] > highPrice and src[2] < highPrev;
    def bullSignal = BotCond and low[2] < lowPrice and src[2] > lowPrev;
    def bearDivHidden = TopCond and high[2] < highPrice and src[2] > highPrev;
    def bullDivHidden = BotCond and low[2] > lowPrice and src[2] < lowPrev;
    plot top = if isNaN(TopCond) then 0 else TopCond;#fractalTop;
    plot bot = if isNaN(BotCond) then 0 else BotCond;#fractalBot;
    plot lowP = lowPrev;
    plot sigBear = if isNaN(bearSignal) then 0 else bearSignal;
    plot sigBull = if isNaN(bullSignal) then 0 else bullSignal;
    plot hidBear = if isNaN(bearDivHidden) then 0 else bearDivHidden;
    plot hidBull = if isNaN(bullDivHidden) then 0 else bullDivHidden;
}
#// Stochastic RSI
script f_stochrsi {
    input _src = close;
    input _stochlen = 14;
    input _rsilen = 14;
    input _smoothk = 3;
    input _smoothd = 3;
    input _log = yes;
    input _avg = no;
    def src = if _log then Log(_src) else _src;
    def rsi = RSI(Price = src, Length = _rsilen);
    def stoch = 100 * (rsi - Lowest(rsi, _stochlen)) / (Highest(rsi, _stochlen) - Lowest(rsi, _stochlen));
    def kk = Average(stoch, _smoothk);
    def d1 = Average(kk, _smoothd);
    def avg_1 = (kk + d1) / 2;
    def k = if _avg then avg_1 else kk;
    plot stochK = k;
    plot stochD = d1;
}
#/ RSI+MFI
script f_rsimfi {
    input _period = 60;
    input _multiplier = 150;
    input rsiMFIPosY = 2.5;
    def c = close;
    def o = open;
    def h = high;
    def l = low;
    def dif = (c - o) / (h - l);
    def diff = if !isNaN(dif) then dif else 0;
    def rsimfi = Average(diff * _multiplier, _period) - rsiMFIPosY;
    plot f_rsimfi = rsimfi;
}
#// WaveTrend
script f_wavetrend {
#def wt1 = f_wavetrend(wtMASource, wtChannelLen, wtAverageLen, wtMALen, obLevel, osLevel).wt_1;
    input wtMASource = close;
    input wtChannelLen = 9;
    input wtAverageLen = 12;
    input wtMALen = 3;
    input obLevel = 53;
    input osLevel = -53;
    def tfsrc = wtMASource;
    def esa = ExpAverage(tfsrc, wtChannelLen);
    def de = ExpAverage(AbsValue(tfsrc - esa), wtChannelLen);
    def ci = (tfsrc - esa) / (0.015 * de);
    def wt1 = ExpAverage(ci, wtAverageLen);
    def wt2 = Average(wt1, wtMALen);
    def wtVwap = wt1 - wt2;
    def wtOversold = wt2 <= osLevel;
    def wtOverbought = wt2 >= obLevel;
    def wtCross = Crosses(wt1, wt2, CrossingDirection.ANY);
    def wtCrossUp = (wt2 - wt1) <= 0;
    def wtCrossDown = (wt2 - wt1) >= 0;
    def wtCrosslast = Crosses(wt1[2], wt2[2], CrossingDirection.ANY);
    def wtCrossUplast = (wt2[2] - wt1[2]) <= 0;
    def wtCrossDownlast = (wt2[2] - wt1[2]) >= 0;
    plot wt_1 = wt1;
    plot wt_2 = wt2;
    plot wt_OS = wtOversold;
    plot wt_OB = wtOverbought;
    plot wt_cross = wtCross;
    plot wt_CrossUp = wtCrossUp;
    plot wt_CrossDn = wtCrossDown;
    plot wt_Vwap = wtVwap;
}
#// CALCULATE INDICATORS {
#// RSI
def rsi = RSI(Price = rsiSRC, Length = rsiLen);
#// RSI + MFI Area
def rsiMFI = f_rsimfi(rsiMFIperiod, rsiMFIMultiplier, rsiMFIPosY);
#// Calculates WaveTrend
def wt1 = f_wavetrend(wtMASource, wtChannelLen, wtAverageLen, wtMALen, obLevel, osLevel).wt_1;
def wt2 = f_wavetrend(wtMASource, wtChannelLen, wtAverageLen, wtMALen, obLevel, osLevel).wt_2;
def wtOversold = f_wavetrend(wtMASource, wtChannelLen, wtAverageLen, wtMALen, obLevel, osLevel).wt_OS;
def wtOverbought = f_wavetrend(wtMASource, wtChannelLen, wtAverageLen, wtMALen, obLevel, osLevel).wt_OB;
def wtCross = f_wavetrend(wtMASource, wtChannelLen, wtAverageLen, wtMALen, obLevel, osLevel).wt_cross;
def wtCrossUp = f_wavetrend(wtMASource, wtChannelLen, wtAverageLen, wtMALen, obLevel, osLevel).wt_CrossUp;
def wtCrossDown = f_wavetrend(wtMASource, wtChannelLen, wtAverageLen, wtMALen, obLevel, osLevel).wt_CrossDn;
def wtVwap = f_wavetrend(wtMASource, wtChannelLen, wtAverageLen, wtMALen, obLevel, osLevel).wt_Vwap;
#// Stochastic RSI
def stochK = f_stochrsi(stochSRC, stochLen, stochRsiLen, stochKSmooth, stochDSmooth, stochUseLog, stochAvg).stochK;
def stochD = f_stochrsi(stochSRC, stochLen, stochRsiLen, stochKSmooth, stochDSmooth, stochUseLog, stochAvg).stochD;
#// WT Divergences
def wtBearDiv = f_findDivs(wt2, wtDivOBLevel, wtDivOSLevel, yes).sigBear;
def wtBullDiv = f_findDivs(wt2, wtDivOBLevel, wtDivOSLevel, yes).sigBull;
def wtBearDivHidden = f_findDivs(wt2, wtDivOBLevel, wtDivOSLevel, yes).hidBear;
def wtBullDivHidden = f_findDivs(wt2, wtDivOBLevel, wtDivOSLevel, yes).hidBull;

def wtBearDiv_add = f_findDivs(wt2, wtDivOBLevel_add, wtDivOSLevel_add, yes).sigBear;
def wtBullDiv_add = f_findDivs(wt2, wtDivOBLevel_add, wtDivOSLevel_add, yes).sigBull;
def wtBearDivHidden_add = f_findDivs(wt2, wtDivOBLevel_add, wtDivOSLevel_add, yes).hidBear;
def wtBullDivHidden_add = f_findDivs(wt2, wtDivOBLevel_add, wtDivOSLevel_add, yes).hidBull;
def wtBearDivHidden_nl  = f_findDivs(wt2, 0, 0, no).hidBear;
def wtBullDivHidden_nl  = f_findDivs(wt2, 0, 0, no).hidBull;

def wtBearDivHidden_ = if showHiddenDiv_nl then wtBearDivHidden_nl else wtBearDivHidden;
def wtBullDivHidden_ = if showHiddenDiv_nl then wtBullDivHidden_nl else wtBullDivHidden;

def wtBearDivColor_add = (wtShowDiv and (wtDivOBLevel_addshow and wtBearDiv_add)) or (wtShowHiddenDiv and (wtDivOBLevel_addshow and wtBearDivHidden_add));# ? RED #9a0202 : na
def wtBullDivColor_add = (wtShowDiv and (wtDivOBLevel_addshow and wtBullDiv_add)) or (wtShowHiddenDiv and (wtDivOBLevel_addshow and wtBullDivHidden_add));# ? GREEN #1b5e20 : na


#// RSI Divergences
def rsiBearDiv = f_findDivs(rsi, rsiDivOBLevel, rsiDivOSLevel, yes).sigBear;
def rsiBullDiv = f_findDivs(rsi, rsiDivOBLevel, rsiDivOSLevel, yes).sigBull;
#// Stoch Divergences
def stochBearDiv = f_findDivs(stochK, 0, 0, no).sigBear;
def stochBullDiv = f_findDivs(stochK, 0, 0, no).sigBull;
def stochBearDivHidden = f_findDivs(stochK, 0, 0, no).hidBear;
def stochBullDivHidden = f_findDivs(stochK, 0, 0, no).hidBull;

def stochBearDivColor = (stochShowDiv and stochBearDiv) or (stochShowHiddenDiv and stochBearDivHidden);#red
def stochBullDivColor = (stochShowDiv and stochBullDiv) or (stochShowHiddenDiv and stochBullDivHidden);#green


#// Buy signal.
def buySignal = wtCross and wtCrossUp and wtOversold;

def buySignalDiv = (wtShowDiv and wtBullDiv) or
               (wtShowDiv and wtBullDiv_add) or
               (stochShowDiv and stochBullDiv) or
               (rsiShowDiv and rsiBullDiv);
#// Sell signal
def sellSignal = wtCross and wtCrossDown and wtOverbought;

def sellSignalDiv = (wtShowDiv and wtBearDiv) or
               (wtShowDiv and wtBearDiv_add) or
               (stochShowDiv and stochBearDiv) or
               (rsiShowDiv and rsiBearDiv);

#// } CALCULATE INDICATORS
#// WT Areas

def wtWave1 = wt1;    # 'WT Wave 1'
def wtWave2 = wt2;    # 'WT Wave 2'

plot sqBuy = if buySignal then low - ATR(60)/2 else na; # 'Buy circle'
plot sqSell = if sellSignal then high + ATR(60)/2 else na; # 'Sell circle'

sqBuy.SetLineWeight(4);
sqSell.SetLineWeight(4);
sqBuy.SetPaintingStrategy(PaintingStrategy.SQUARES);
sqSell.SetPaintingStrategy(PaintingStrategy.SQUARES);
sqBuy.SetDefaultColor(Color.green);
sqSell.SetDefaultColor(Color.red);


AssignPriceColor(if !ColorBar then Color.CURRENT else
                 if wtWave1 > wtWave2
                             then Color.green
                             else if wtWave1 < wtWave2
                             then Color.RED else Color.YELLOW);

AddCloud(
    if SharkCloud and wtwave1 > 60 then Double.POSITIVE_INFINITY else Double.NaN,
    if SharkCloud and wtwave1 > 60 then Double.NEGATIVE_INFINITY else Double.NaN, Color.dark_RED);

AddCloud(
    if SharkCloud and wtwave1 > 79 then Double.POSITIVE_INFINITY else Double.NaN,
    if SharkCloud and wtwave1 > 79 then Double.NEGATIVE_INFINITY else Double.NaN, Color.dark_red);

AddCloud(
    if SharkCloud and wtwave1 < -60 then Double.POSITIVE_INFINITY else Double.NaN,
    if SharkCloud and wtwave1 < -60 then Double.NEGATIVE_INFINITY else Double.NaN, Color.dark_green);

AddCloud(
    if SharkCloud and wtwave1 < -79 then Double.POSITIVE_INFINITY else Double.NaN,
    if SharkCloud and wtwave1 < -79 then Double.NEGATIVE_INFINITY else Double.NaN, Color.dark_green);
 

Join useThinkScript to post your question to a community of 21,000+ developers and traders.

I made an UPPER version of the Sharkwave. It shows the colored clouds and square dots. Also included colored candles.

View attachment 20394

Code:
#Sharkwave_UPPER
#study(title = 'SharkWaveTrend', shorttitle = 'SharkWaveTrend')
# Converted by Sam4Cok@Samer800 - 12/2023
# Assembled for Upper chart, cloud and dots by Chewie


declare upper;
input colorBars = no;
input SharkCloud = yes;
input ColorBar = yes;
input vwapShow = no;#(true, title = 'Show Fast WT', type = input.bool)
input wtChannelLen = 9;#, title = 'WT Channel Length', type = input.integer)
input wtAverageLen = 12;#, title = 'WT Average Length', type = input.integer)
input wtMASource = hlc3;#, title = 'WT MA Source', type = input.source)
input wtMaLen = 3;#, title = 'WT MA Length', type = input.integer)
input obLevel = 53;#, title = 'WT Overbought Level 1', type = input.integer)
input osLevel = -53;#, title = 'WT Oversold Level 1', type = input.integer)
input wtShowDiv = yes;#(true, title = 'Show WT Regular Divergences', type = input.bool)
input wtShowHiddenDiv = no;#(false, title = 'Show WT Hidden Divergences', type = input.bool)
input showHiddenDiv_nl = yes;#(true, title = 'Not apply OB/OS Limits on Hidden Divergences', type = input.bool)
input wtDivOBLevel = 45;#, title = 'WT Bearish Divergence min', type = input.integer)
input wtDivOSLevel = -65;#, title = 'WT Bullish Divergence min', type = input.integer)
input wtDivOBLevel_addshow = yes;#(true, title = 'Show 2nd WT Regular Divergences', type = input.bool)
input wtDivOBLevel_add = 15;#, title = 'WT 2nd Bearish Divergence', type = input.integer)
input wtDivOSLevel_add = -40;#, title = 'WT 2nd Bullish Divergence 15 min', type = input.integer)
input rsiMFIShow = no;#(true, title = 'Show MFI', type = input.bool)
input rsiMFIperiod = 60;#,title = 'MFI Period', type = input.integer)
input rsiMFIMultiplier = 150;#, title = 'MFI Area multiplier', type = input.float)
input rsiMFIPosY = 2.5;#, title = 'MFI Area Y Pos', type = input.float)
input showRsiLine = no;    #(false, title = 'Show RSI', type = input.bool)
input rsiSRC = close;#(close, title = 'RSI Source', type = input.source)
input rsiLen = 12;#, title = 'RSI Length', type = input.integer)
#input rsiOversold = 30;#, title = 'RSI Oversold', minval = 50, maxval = 100, type = input.integer)
#input rsiOverbought = 60;#, title = 'RSI Overbought', minval = 0, maxval = 50, type = input.integer)
input rsiShowDiv = yes;#(false, title = 'Show RSI Regular Divergences', type = input.bool)
input rsiShowHiddenDiv = no;#(false, title = 'Show RSI Hidden Divergences', type = input.bool)
input rsiDivOBLevel = 60;#, title = 'RSI Bearish Divergence min', type = input.integer)
input rsiDivOSLevel = 30;#, title = 'RSI Bullish Divergence min', type = input.integer)
input stochShow = no;#(true, title = 'Show Stochastic RSI', type = input.bool)
input stochUseLog = yes;#(true, title=' Use Log?', type = input.bool)
input stochAvg = no;#(false, title='Use Average of both K & D', type = input.bool)
input stochSRC = close;#(close, title = 'Stochastic RSI Source', type = input.source)
input stochLen = 14;#, title = 'Stochastic RSI Length', type = input.integer)
input stochRsiLen = 14;#, title = 'RSI Length ', type = input.integer)
input stochKSmooth = 3;#, title = 'Stochastic RSI K Smooth', type = input.integer)
input stochDSmooth = 3;#, title = 'Stochastic RSI D Smooth', type = input.integer)
input stochShowDiv = yes;#(false, title = 'Show Stoch Regular Divergences', type = input.bool)
input stochShowHiddenDiv = no;#(false, title = 'Show Stoch Hidden Divergences', type = input.bool)
input rsiLengthInput = 12;#, minval=1, title="RSI Length", group="Shark")
input rsiSourceInput = close;#, "Source", group="Shark")
input length2 = 30;#, minval=1, group="Shark")
input src = close;#, title="Source", group="Shark")
input mult = 2.0;#, minval=0.001, maxval=50, title="StdDev", group="Shark")
input offset = 0;#, "Offset", minval = -500, maxval = 500, group="Shark")
input HighlightBreaches = yes;#, title="Highlight Oversold/Overbought", group="Shark")
input bApply25and75 = no;#, title="Apply 25/75 RSI rule", group="Shark")


def na = Double.NaN;
def last = IsNaN(close);
def pos = Double.POSITIVE_INFINITY;
def neg = Double.NEGATIVE_INFINITY;

DefineGlobalColor("intense_red", Color.RED);#CreateColor(255, 35, 35));
DefineGlobalColor("regular_red", Color.DARK_RED);#CreateColor(255, 82, 82));
DefineGlobalColor("intense_green", Color.GREEN);#CreateColor(0, 230, 118));
DefineGlobalColor("regular_green", Color.DARK_GREEN);#CreateColor(76, 175, 80));
#DefineGlobalColor("wt1", CreateColor(217,205,205));
DefineGlobalColor("wt1", color.white);
DefineGlobalColor("wt2", CreateColor(51, 153, 255));
#DefineGlobalColor("wt2", CreateColor(29, 63, 97));
#// } FUNCTIONS
#f_findDivs(src, topLimit, botLimit, useLimits) =>
script f_findDivs {
    input src = close;
    input topLimit = 70;
    input botLimit = 30;
    input useLimits = yes;
    def na = Double.NaN;
    def topfractal = src[4] < src[2] and src[3] < src[2] and src[2] > src[1] and src[2] > src[0];
    def botfractal = src[4] > src[2] and src[3] > src[2] and src[2] < src[1] and src[2] < src[0];
    def top_fractal = if isNaN(topfractal) then 0 else topfractal;
    def bot_fractal = if isNaN(botfractal) then 0 else botfractal;
    def fractalize  = if top_fractal then 1 else if bot_fractal then -1 else 0;
    def fractalTop = if fractalize > 0 and (if useLimits then src[2] >= topLimit else yes) then src[2] else na;
    def fractalBot = if fractalize < 0 and (if useLimits then src[2] <= botLimit else yes) then src[2] else na;
    def TopCond = if !IsNaN(fractalTop) and fractalTop then fractalTop else 0;
    def BotCond = if !IsNaN(fractalBot) and fractalBot then fractalBot else 0;
    def highPrev0;
    def highPrev1;
    def highPrice0;
    def highPrice1;
    if TopCond {
        highPrev1  = highPrev0[1];
        highPrev0  = src[2];
        highPrice1 = highPrice0[1];
        highPrice0 = high[2];
    } else {
        highPrev1  = highPrev1[1];
        highPrev0  = highPrev0[1];
        highPrice1 = highPrice1[1];
        highPrice0 = highPrice0[1];
    }
    def highPrev = highPrev1[2];#if highPrev1 != highPrev1[1] then highPrev1[1] else highPrev[1];
    def highPrice = highPrice1[2];#if highPrice1 != highPrice1[1] then highPrice1[1] else highPrice[1];
    def lowPrev0;
    def lowPrev1;
    def lowPrice0;
    def lowPrice1;
    if BotCond {
        lowPrev1  = lowPrev0[1];
        lowPrev0  = src[2];
        lowPrice1 = lowPrice0[1];
        lowPrice0 = low[2];
    } else {
        lowPrev1  = lowPrev1[1];
        lowPrev0  = lowPrev0[1];
        lowPrice1 = lowPrice1[1];
        lowPrice0 = lowPrice0[1];
    }
    def lowPrev = lowPrev1[2];#if lowPrev1 != lowPrev1[1] then lowPrev1[1] else lowPrev[1];
    def lowPrice = lowPrice1[2];#if lowPrice1 != lowPrice1[1] then lowPrice1[1] else lowPrice[1];
    def bearSignal = TopCond and high[2] > highPrice and src[2] < highPrev;
    def bullSignal = BotCond and low[2] < lowPrice and src[2] > lowPrev;
    def bearDivHidden = TopCond and high[2] < highPrice and src[2] > highPrev;
    def bullDivHidden = BotCond and low[2] > lowPrice and src[2] < lowPrev;
    plot top = if isNaN(TopCond) then 0 else TopCond;#fractalTop;
    plot bot = if isNaN(BotCond) then 0 else BotCond;#fractalBot;
    plot lowP = lowPrev;
    plot sigBear = if isNaN(bearSignal) then 0 else bearSignal;
    plot sigBull = if isNaN(bullSignal) then 0 else bullSignal;
    plot hidBear = if isNaN(bearDivHidden) then 0 else bearDivHidden;
    plot hidBull = if isNaN(bullDivHidden) then 0 else bullDivHidden;
}
#// Stochastic RSI
script f_stochrsi {
    input _src = close;
    input _stochlen = 14;
    input _rsilen = 14;
    input _smoothk = 3;
    input _smoothd = 3;
    input _log = yes;
    input _avg = no;
    def src = if _log then Log(_src) else _src;
    def rsi = RSI(Price = src, Length = _rsilen);
    def stoch = 100 * (rsi - Lowest(rsi, _stochlen)) / (Highest(rsi, _stochlen) - Lowest(rsi, _stochlen));
    def kk = Average(stoch, _smoothk);
    def d1 = Average(kk, _smoothd);
    def avg_1 = (kk + d1) / 2;
    def k = if _avg then avg_1 else kk;
    plot stochK = k;
    plot stochD = d1;
}
#/ RSI+MFI
script f_rsimfi {
    input _period = 60;
    input _multiplier = 150;
    input rsiMFIPosY = 2.5;
    def c = close;
    def o = open;
    def h = high;
    def l = low;
    def dif = (c - o) / (h - l);
    def diff = if !isNaN(dif) then dif else 0;
    def rsimfi = Average(diff * _multiplier, _period) - rsiMFIPosY;
    plot f_rsimfi = rsimfi;
}
#// WaveTrend
script f_wavetrend {
#def wt1 = f_wavetrend(wtMASource, wtChannelLen, wtAverageLen, wtMALen, obLevel, osLevel).wt_1;
    input wtMASource = close;
    input wtChannelLen = 9;
    input wtAverageLen = 12;
    input wtMALen = 3;
    input obLevel = 53;
    input osLevel = -53;
    def tfsrc = wtMASource;
    def esa = ExpAverage(tfsrc, wtChannelLen);
    def de = ExpAverage(AbsValue(tfsrc - esa), wtChannelLen);
    def ci = (tfsrc - esa) / (0.015 * de);
    def wt1 = ExpAverage(ci, wtAverageLen);
    def wt2 = Average(wt1, wtMALen);
    def wtVwap = wt1 - wt2;
    def wtOversold = wt2 <= osLevel;
    def wtOverbought = wt2 >= obLevel;
    def wtCross = Crosses(wt1, wt2, CrossingDirection.ANY);
    def wtCrossUp = (wt2 - wt1) <= 0;
    def wtCrossDown = (wt2 - wt1) >= 0;
    def wtCrosslast = Crosses(wt1[2], wt2[2], CrossingDirection.ANY);
    def wtCrossUplast = (wt2[2] - wt1[2]) <= 0;
    def wtCrossDownlast = (wt2[2] - wt1[2]) >= 0;
    plot wt_1 = wt1;
    plot wt_2 = wt2;
    plot wt_OS = wtOversold;
    plot wt_OB = wtOverbought;
    plot wt_cross = wtCross;
    plot wt_CrossUp = wtCrossUp;
    plot wt_CrossDn = wtCrossDown;
    plot wt_Vwap = wtVwap;
}
#// CALCULATE INDICATORS {
#// RSI
def rsi = RSI(Price = rsiSRC, Length = rsiLen);
#// RSI + MFI Area
def rsiMFI = f_rsimfi(rsiMFIperiod, rsiMFIMultiplier, rsiMFIPosY);
#// Calculates WaveTrend
def wt1 = f_wavetrend(wtMASource, wtChannelLen, wtAverageLen, wtMALen, obLevel, osLevel).wt_1;
def wt2 = f_wavetrend(wtMASource, wtChannelLen, wtAverageLen, wtMALen, obLevel, osLevel).wt_2;
def wtOversold = f_wavetrend(wtMASource, wtChannelLen, wtAverageLen, wtMALen, obLevel, osLevel).wt_OS;
def wtOverbought = f_wavetrend(wtMASource, wtChannelLen, wtAverageLen, wtMALen, obLevel, osLevel).wt_OB;
def wtCross = f_wavetrend(wtMASource, wtChannelLen, wtAverageLen, wtMALen, obLevel, osLevel).wt_cross;
def wtCrossUp = f_wavetrend(wtMASource, wtChannelLen, wtAverageLen, wtMALen, obLevel, osLevel).wt_CrossUp;
def wtCrossDown = f_wavetrend(wtMASource, wtChannelLen, wtAverageLen, wtMALen, obLevel, osLevel).wt_CrossDn;
def wtVwap = f_wavetrend(wtMASource, wtChannelLen, wtAverageLen, wtMALen, obLevel, osLevel).wt_Vwap;
#// Stochastic RSI
def stochK = f_stochrsi(stochSRC, stochLen, stochRsiLen, stochKSmooth, stochDSmooth, stochUseLog, stochAvg).stochK;
def stochD = f_stochrsi(stochSRC, stochLen, stochRsiLen, stochKSmooth, stochDSmooth, stochUseLog, stochAvg).stochD;
#// WT Divergences
def wtBearDiv = f_findDivs(wt2, wtDivOBLevel, wtDivOSLevel, yes).sigBear;
def wtBullDiv = f_findDivs(wt2, wtDivOBLevel, wtDivOSLevel, yes).sigBull;
def wtBearDivHidden = f_findDivs(wt2, wtDivOBLevel, wtDivOSLevel, yes).hidBear;
def wtBullDivHidden = f_findDivs(wt2, wtDivOBLevel, wtDivOSLevel, yes).hidBull;

def wtBearDiv_add = f_findDivs(wt2, wtDivOBLevel_add, wtDivOSLevel_add, yes).sigBear;
def wtBullDiv_add = f_findDivs(wt2, wtDivOBLevel_add, wtDivOSLevel_add, yes).sigBull;
def wtBearDivHidden_add = f_findDivs(wt2, wtDivOBLevel_add, wtDivOSLevel_add, yes).hidBear;
def wtBullDivHidden_add = f_findDivs(wt2, wtDivOBLevel_add, wtDivOSLevel_add, yes).hidBull;
def wtBearDivHidden_nl  = f_findDivs(wt2, 0, 0, no).hidBear;
def wtBullDivHidden_nl  = f_findDivs(wt2, 0, 0, no).hidBull;

def wtBearDivHidden_ = if showHiddenDiv_nl then wtBearDivHidden_nl else wtBearDivHidden;
def wtBullDivHidden_ = if showHiddenDiv_nl then wtBullDivHidden_nl else wtBullDivHidden;

def wtBearDivColor_add = (wtShowDiv and (wtDivOBLevel_addshow and wtBearDiv_add)) or (wtShowHiddenDiv and (wtDivOBLevel_addshow and wtBearDivHidden_add));# ? RED #9a0202 : na
def wtBullDivColor_add = (wtShowDiv and (wtDivOBLevel_addshow and wtBullDiv_add)) or (wtShowHiddenDiv and (wtDivOBLevel_addshow and wtBullDivHidden_add));# ? GREEN #1b5e20 : na


#// RSI Divergences
def rsiBearDiv = f_findDivs(rsi, rsiDivOBLevel, rsiDivOSLevel, yes).sigBear;
def rsiBullDiv = f_findDivs(rsi, rsiDivOBLevel, rsiDivOSLevel, yes).sigBull;
#// Stoch Divergences
def stochBearDiv = f_findDivs(stochK, 0, 0, no).sigBear;
def stochBullDiv = f_findDivs(stochK, 0, 0, no).sigBull;
def stochBearDivHidden = f_findDivs(stochK, 0, 0, no).hidBear;
def stochBullDivHidden = f_findDivs(stochK, 0, 0, no).hidBull;

def stochBearDivColor = (stochShowDiv and stochBearDiv) or (stochShowHiddenDiv and stochBearDivHidden);#red
def stochBullDivColor = (stochShowDiv and stochBullDiv) or (stochShowHiddenDiv and stochBullDivHidden);#green


#// Buy signal.
def buySignal = wtCross and wtCrossUp and wtOversold;

def buySignalDiv = (wtShowDiv and wtBullDiv) or
               (wtShowDiv and wtBullDiv_add) or
               (stochShowDiv and stochBullDiv) or
               (rsiShowDiv and rsiBullDiv);
#// Sell signal
def sellSignal = wtCross and wtCrossDown and wtOverbought;

def sellSignalDiv = (wtShowDiv and wtBearDiv) or
               (wtShowDiv and wtBearDiv_add) or
               (stochShowDiv and stochBearDiv) or
               (rsiShowDiv and rsiBearDiv);

#// } CALCULATE INDICATORS
#// WT Areas

def wtWave1 = wt1;    # 'WT Wave 1'
def wtWave2 = wt2;    # 'WT Wave 2'

plot sqBuy = if buySignal then low - ATR(60)/2 else na; # 'Buy circle'
plot sqSell = if sellSignal then high + ATR(60)/2 else na; # 'Sell circle'

sqBuy.SetLineWeight(4);
sqSell.SetLineWeight(4);
sqBuy.SetPaintingStrategy(PaintingStrategy.SQUARES);
sqSell.SetPaintingStrategy(PaintingStrategy.SQUARES);
sqBuy.SetDefaultColor(Color.green);
sqSell.SetDefaultColor(Color.red);


AssignPriceColor(if !ColorBar then Color.CURRENT else
                 if wtWave1 > wtWave2
                             then Color.green
                             else if wtWave1 < wtWave2
                             then Color.RED else Color.YELLOW);

AddCloud(
    if SharkCloud and wtwave1 > 60 then Double.POSITIVE_INFINITY else Double.NaN,
    if SharkCloud and wtwave1 > 60 then Double.NEGATIVE_INFINITY else Double.NaN, Color.dark_RED);

AddCloud(
    if SharkCloud and wtwave1 > 79 then Double.POSITIVE_INFINITY else Double.NaN,
    if SharkCloud and wtwave1 > 79 then Double.NEGATIVE_INFINITY else Double.NaN, Color.dark_red);

AddCloud(
    if SharkCloud and wtwave1 < -60 then Double.POSITIVE_INFINITY else Double.NaN,
    if SharkCloud and wtwave1 < -60 then Double.NEGATIVE_INFINITY else Double.NaN, Color.dark_green);

AddCloud(
    if SharkCloud and wtwave1 < -79 then Double.POSITIVE_INFINITY else Double.NaN,
    if SharkCloud and wtwave1 < -79 then Double.NEGATIVE_INFINITY else Double.NaN, Color.dark_green);
@chewie76 Great job! Looks very promising. Thank you very much for sharing!
 
I wish there was a watchlist for the shark waves. That would be great. He has some awesome stuff in his videos, but I don't understand the coding part of it.
 
I wish there was a watchlist for the shark waves. That would be great. He has some awesome stuff in his videos, but I don't understand the coding part of it.
You can use this code for a watchlist column. It is when the line is over 60-80.
Zuki6Fb.png

Code:
#study(title = 'SharkWaveTrend', shorttitle = 'SharkWaveTrend')
# Converted by Sam4Cok@Samer800 - 12/2023

input colorBars = no;
input vwapShow = no;#(true, title = 'Show Fast WT', type = input.bool)
input wtChannelLen = 9;#, title = 'WT Channel Length', type = input.integer)
input wtAverageLen = 12;#, title = 'WT Average Length', type = input.integer)
input wtMASource = hlc3;#, title = 'WT MA Source', type = input.source)
input wtMaLen = 3;#, title = 'WT MA Length', type = input.integer)
input obLevel = 53;#, title = 'WT Overbought Level 1', type = input.integer)
input osLevel = -53;#, title = 'WT Oversold Level 1', type = input.integer)
input wtShowDiv = yes;#(true, title = 'Show WT Regular Divergences', type = input.bool)
input wtShowHiddenDiv = no;#(false, title = 'Show WT Hidden Divergences', type = input.bool)
input showHiddenDiv_nl = yes;#(true, title = 'Not apply OB/OS Limits on Hidden Divergences', type = input.bool)
input wtDivOBLevel = 45;#, title = 'WT Bearish Divergence min', type = input.integer)
input wtDivOSLevel = -65;#, title = 'WT Bullish Divergence min', type = input.integer)
input wtDivOBLevel_addshow = yes;#(true, title = 'Show 2nd WT Regular Divergences', type = input.bool)
input wtDivOBLevel_add = 15;#, title = 'WT 2nd Bearish Divergence', type = input.integer)
input wtDivOSLevel_add = -40;#, title = 'WT 2nd Bullish Divergence 15 min', type = input.integer)
input rsiMFIShow = no;#(true, title = 'Show MFI', type = input.bool)
input rsiMFIperiod = 60;#,title = 'MFI Period', type = input.integer)
input rsiMFIMultiplier = 150;#, title = 'MFI Area multiplier', type = input.float)
input rsiMFIPosY = 2.5;#, title = 'MFI Area Y Pos', type = input.float)
input showRsiLine = no;    #(false, title = 'Show RSI', type = input.bool)
input rsiSRC = close;#(close, title = 'RSI Source', type = input.source)
input rsiLen = 12;#, title = 'RSI Length', type = input.integer)
#input rsiOversold = 30;#, title = 'RSI Oversold', minval = 50, maxval = 100, type = input.integer)
#input rsiOverbought = 60;#, title = 'RSI Overbought', minval = 0, maxval = 50, type = input.integer)
input rsiShowDiv = yes;#(false, title = 'Show RSI Regular Divergences', type = input.bool)
input rsiShowHiddenDiv = no;#(false, title = 'Show RSI Hidden Divergences', type = input.bool)
input rsiDivOBLevel = 60;#, title = 'RSI Bearish Divergence min', type = input.integer)
input rsiDivOSLevel = 30;#, title = 'RSI Bullish Divergence min', type = input.integer)

input stochShow = no;#(true, title = 'Show Stochastic RSI', type = input.bool)
input stochUseLog = yes;#(true, title=' Use Log?', type = input.bool)
input stochAvg = no;#(false, title='Use Average of both K & D', type = input.bool)
input stochSRC = close;#(close, title = 'Stochastic RSI Source', type = input.source)
input stochLen = 14;#, title = 'Stochastic RSI Length', type = input.integer)
input stochRsiLen = 14;#, title = 'RSI Length ', type = input.integer)
input stochKSmooth = 3;#, title = 'Stochastic RSI K Smooth', type = input.integer)
input stochDSmooth = 3;#, title = 'Stochastic RSI D Smooth', type = input.integer)
input stochShowDiv = yes;#(false, title = 'Show Stoch Regular Divergences', type = input.bool)
input stochShowHiddenDiv = no;#(false, title = 'Show Stoch Hidden Divergences', type = input.bool)
input rsiLengthInput = 12;#, minval=1, title="RSI Length", group="Shark")
input rsiSourceInput = close;#, "Source", group="Shark")
input length2 = 30;#, minval=1, group="Shark")
input src = close;#, title="Source", group="Shark")
input mult = 2.0;#, minval=0.001, maxval=50, title="StdDev", group="Shark")
input offset = 0;#, "Offset", minval = -500, maxval = 500, group="Shark")
input HighlightBreaches = yes;#, title="Highlight Oversold/Overbought", group="Shark")
input bApply25and75 = no;#, title="Apply 25/75 RSI rule", group="Shark")


def na = Double.NaN;
def last = IsNaN(close);
def pos = Double.POSITIVE_INFINITY;
def neg = Double.NEGATIVE_INFINITY;

DefineGlobalColor("intense_red", Color.RED);#CreateColor(255, 35, 35));
DefineGlobalColor("regular_red", Color.DARK_RED);#CreateColor(255, 82, 82));
DefineGlobalColor("intense_green", Color.GREEN);#CreateColor(0, 230, 118));
DefineGlobalColor("regular_green", Color.DARK_GREEN);#CreateColor(76, 175, 80));
#DefineGlobalColor("wt1", CreateColor(217,205,205));
DefineGlobalColor("wt1", Color.WHITE);
DefineGlobalColor("wt2", CreateColor(51, 102, 255));
#DefineGlobalColor("wt2", CreateColor(29, 63, 97));
#// } FUNCTIONS
#f_findDivs(src, topLimit, botLimit, useLimits) =>
script f_findDivs {
    input src = close;
    input topLimit = 70;
    input botLimit = 30;
    input useLimits = yes;
    def na = Double.NaN;
    def topfractal = src[4] < src[2] and src[3] < src[2] and src[2] > src[1] and src[2] > src[0];
    def botfractal = src[4] > src[2] and src[3] > src[2] and src[2] < src[1] and src[2] < src[0];
    def top_fractal = if IsNaN(topfractal) then 0 else topfractal;
    def bot_fractal = if IsNaN(botfractal) then 0 else botfractal;
    def fractalize  = if top_fractal then 1 else if bot_fractal then -1 else 0;
    def fractalTop = if fractalize > 0 and (if useLimits then src[2] >= topLimit else yes) then src[2] else na;
    def fractalBot = if fractalize < 0 and (if useLimits then src[2] <= botLimit else yes) then src[2] else na;
    def TopCond = if !IsNaN(fractalTop) and fractalTop then fractalTop else 0;
    def BotCond = if !IsNaN(fractalBot) and fractalBot then fractalBot else 0;
    def highPrev0;
    def highPrev1;
    def highPrice0;
    def highPrice1;
    if TopCond {
        highPrev1  = highPrev0[1];
        highPrev0  = src[2];
        highPrice1 = highPrice0[1];
        highPrice0 = high[2];
    } else {
        highPrev1  = highPrev1[1];
        highPrev0  = highPrev0[1];
        highPrice1 = highPrice1[1];
        highPrice0 = highPrice0[1];
    }
    def highPrev = highPrev1[2];#if highPrev1 != highPrev1[1] then highPrev1[1] else highPrev[1];
    def highPrice = highPrice1[2];#if highPrice1 != highPrice1[1] then highPrice1[1] else highPrice[1];
    def lowPrev0;
    def lowPrev1;
    def lowPrice0;
    def lowPrice1;
    if BotCond {
        lowPrev1  = lowPrev0[1];
        lowPrev0  = src[2];
        lowPrice1 = lowPrice0[1];
        lowPrice0 = low[2];
    } else {
        lowPrev1  = lowPrev1[1];
        lowPrev0  = lowPrev0[1];
        lowPrice1 = lowPrice1[1];
        lowPrice0 = lowPrice0[1];
    }
    def lowPrev = lowPrev1[2];#if lowPrev1 != lowPrev1[1] then lowPrev1[1] else lowPrev[1];
    def lowPrice = lowPrice1[2];#if lowPrice1 != lowPrice1[1] then lowPrice1[1] else lowPrice[1];
    def bearSignal = TopCond and high[2] > highPrice and src[2] < highPrev;
    def bullSignal = BotCond and low[2] < lowPrice and src[2] > lowPrev;
    def bearDivHidden = TopCond and high[2] < highPrice and src[2] > highPrev;
    def bullDivHidden = BotCond and low[2] > lowPrice and src[2] < lowPrev;
    plot top = if IsNaN(TopCond) then 0 else TopCond;#fractalTop;
    plot bot = if IsNaN(BotCond) then 0 else BotCond;#fractalBot;
    plot lowP = lowPrev;
    plot sigBear = if IsNaN(bearSignal) then 0 else bearSignal;
    plot sigBull = if IsNaN(bullSignal) then 0 else bullSignal;
    plot hidBear = if IsNaN(bearDivHidden) then 0 else bearDivHidden;
    plot hidBull = if IsNaN(bullDivHidden) then 0 else bullDivHidden;
}
#// Stochastic RSI
script f_stochrsi {
    input _src = close;
    input _stochlen = 14;
    input _rsilen = 14;
    input _smoothk = 3;
    input _smoothd = 3;
    input _log = yes;
    input _avg = no;
    def src = if _log then Log(_src) else _src;
    def rsi = RSI(Price = src, Length = _rsilen);
    def stoch = 100 * (rsi - Lowest(rsi, _stochlen)) / (Highest(rsi, _stochlen) - Lowest(rsi, _stochlen));
    def kk = Average(stoch, _smoothk);
    def d1 = Average(kk, _smoothd);
    def avg_1 = (kk + d1) / 2;
    def k = if _avg then avg_1 else kk;
    plot stochK = k;
    plot stochD = d1;
}
#/ RSI+MFI
script f_rsimfi {
    input _period = 60;
    input _multiplier = 150;
    input rsiMFIPosY = 2.5;
    def c = close;
    def o = open;
    def h = high;
    def l = low;
    def dif = (c - o) / (h - l);
    def diff = if !IsNaN(dif) then dif else 0;
    def rsimfi = Average(diff * _multiplier, _period) - rsiMFIPosY;
    plot f_rsimfi = rsimfi;
}
#// WaveTrend
script f_wavetrend {
#def wt1 = f_wavetrend(wtMASource, wtChannelLen, wtAverageLen, wtMALen, obLevel, osLevel).wt_1;
    input wtMASource = close;
    input wtChannelLen = 9;
    input wtAverageLen = 12;
    input wtMALen = 3;
    input obLevel = 53;
    input osLevel = -53;
    def tfsrc = wtMASource;
    def esa = ExpAverage(tfsrc, wtChannelLen);
    def de = ExpAverage(AbsValue(tfsrc - esa), wtChannelLen);
    def ci = (tfsrc - esa) / (0.015 * de);
    def wt1 = ExpAverage(ci, wtAverageLen);
    def wt2 = Average(wt1, wtMALen);
    def wtVwap = wt1 - wt2;
    def wtOversold = wt2 <= osLevel;
    def wtOverbought = wt2 >= obLevel;
    def wtCross = Crosses(wt1, wt2, CrossingDirection.ANY);
    def wtCrossUp = (wt2 - wt1) <= 0;
    def wtCrossDown = (wt2 - wt1) >= 0;
    def wtCrosslast = Crosses(wt1[2], wt2[2], CrossingDirection.ANY);
    def wtCrossUplast = (wt2[2] - wt1[2]) <= 0;
    def wtCrossDownlast = (wt2[2] - wt1[2]) >= 0;
    plot wt_1 = wt1;
    def wt_2 = wt2;
    def wt_OS = wtOversold;
    def wt_OB = wtOverbought;
    def wt_cross = wtCross;
    def wt_CrossUp = wtCrossUp;
    def wt_CrossDn = wtCrossDown;
    def wt_Vwap = wtVwap;
}
#// CALCULATE INDICATORS {
#// RSI
def rsi = RSI(Price = rsiSRC, Length = rsiLen);
#// RSI + MFI Area
def rsiMFI = f_rsimfi(rsiMFIperiod, rsiMFIMultiplier, rsiMFIPosY);
#// Calculates WaveTrend
def wt1 = f_wavetrend(wtMASource, wtChannelLen, wtAverageLen, wtMALen, obLevel, osLevel).wt_1;
def wt2 = f_wavetrend(wtMASource, wtChannelLen, wtAverageLen, wtMALen, obLevel, osLevel).wt_2;
def wtOversold = f_wavetrend(wtMASource, wtChannelLen, wtAverageLen, wtMALen, obLevel, osLevel).wt_OS;
def wtOverbought = f_wavetrend(wtMASource, wtChannelLen, wtAverageLen, wtMALen, obLevel, osLevel).wt_OB;
def wtCross = f_wavetrend(wtMASource, wtChannelLen, wtAverageLen, wtMALen, obLevel, osLevel).wt_cross;
def wtCrossUp = f_wavetrend(wtMASource, wtChannelLen, wtAverageLen, wtMALen, obLevel, osLevel).wt_CrossUp;
def wtCrossDown = f_wavetrend(wtMASource, wtChannelLen, wtAverageLen, wtMALen, obLevel, osLevel).wt_CrossDn;
def wtVwap = f_wavetrend(wtMASource, wtChannelLen, wtAverageLen, wtMALen, obLevel, osLevel).wt_Vwap;


def shark1 = wt1 > 60 and wt1 < 80;
def shark2 = wt1 > 80;
def nshark1 = wt1 < -60 and wt1 > -80;
def nshark2 = wt1 < -80;

AddLabel(yes, if shark1 then "sell" else if shark2 then "XSELL" else if nshark1 then "buy" else if nshark2 then "XBUY" else " ", if shark1 then color.white else if NSHARK1 or shark2 then color.YELLOW else Color.BLACK);

AssignBACKGROUNDColor(if shark1 then color.dark_red else if shark2 then color.red else if nshark1 then color.dark_green else if nshark2 then color.green else color.black);
 
Last edited by a moderator:
#study(title = 'SharkWaveTrend', shorttitle = 'SharkWaveTrend') # Converted by Sam4Cok@Samer800 - 12/2023 input colorBars = no; input vwapShow = no;#(true, title = 'Show Fast WT', type = input.bool) input wtChannelLen = 9;#, title = 'WT Channel Length', type = input.integer) input wtAverageLen = 12;#, title = 'WT Average Length', type = input.integer) input wtMASource = hlc3;#, title = 'WT MA Source', type = input.source) input wtMaLen = 3;#, title = 'WT MA Length', type = input.integer) input obLevel = 53;#, title = 'WT Overbought Level 1', type = input.integer) input osLevel = -53;#, title = 'WT Oversold Level 1', type = input.integer) input wtShowDiv = yes;#(true, title = 'Show WT Regular Divergences', type = input.bool) input wtShowHiddenDiv = no;#(false, title = 'Show WT Hidden Divergences', type = input.bool) input showHiddenDiv_nl = yes;#(true, title = 'Not apply OB/OS Limits on Hidden Divergences', type = input.bool) input wtDivOBLevel = 45;#, title = 'WT Bearish Divergence min', type = input.integer) input wtDivOSLevel = -65;#, title = 'WT Bullish Divergence min', type = input.integer) input wtDivOBLevel_addshow = yes;#(true, title = 'Show 2nd WT Regular Divergences', type = input.bool) input wtDivOBLevel_add = 15;#, title = 'WT 2nd Bearish Divergence', type = input.integer) input wtDivOSLevel_add = -40;#, title = 'WT 2nd Bullish Divergence 15 min', type = input.integer) input rsiMFIShow = no;#(true, title = 'Show MFI', type = input.bool) input rsiMFIperiod = 60;#,title = 'MFI Period', type = input.integer) input rsiMFIMultiplier = 150;#, title = 'MFI Area multiplier', type = input.float) input rsiMFIPosY = 2.5;#, title = 'MFI Area Y Pos', type = input.float) input showRsiLine = no; #(false, title = 'Show RSI', type = input.bool) input rsiSRC = close;#(close, title = 'RSI Source', type = input.source) input rsiLen = 12;#, title = 'RSI Length', type = input.integer) #input rsiOversold = 30;#, title = 'RSI Oversold', minval = 50, maxval = 100, type = input.integer) #input rsiOverbought = 60;#, title = 'RSI Overbought', minval = 0, maxval = 50, type = input.integer) input rsiShowDiv = yes;#(false, title = 'Show RSI Regular Divergences', type = input.bool) input rsiShowHiddenDiv = no;#(false, title = 'Show RSI Hidden Divergences', type = input.bool) input rsiDivOBLevel = 60;#, title = 'RSI Bearish Divergence min', type = input.integer) input rsiDivOSLevel = 30;#, title = 'RSI Bullish Divergence min', type = input.integer) input stochShow = no;#(true, title = 'Show Stochastic RSI', type = input.bool) input stochUseLog = yes;#(true, title=' Use Log?', type = input.bool) input stochAvg = no;#(false, title='Use Average of both K & D', type = input.bool) input stochSRC = close;#(close, title = 'Stochastic RSI Source', type = input.source) input stochLen = 14;#, title = 'Stochastic RSI Length', type = input.integer) input stochRsiLen = 14;#, title = 'RSI Length ', type = input.integer) input stochKSmooth = 3;#, title = 'Stochastic RSI K Smooth', type = input.integer) input stochDSmooth = 3;#, title = 'Stochastic RSI D Smooth', type = input.integer) input stochShowDiv = yes;#(false, title = 'Show Stoch Regular Divergences', type = input.bool) input stochShowHiddenDiv = no;#(false, title = 'Show Stoch Hidden Divergences', type = input.bool) input rsiLengthInput = 12;#, minval=1, title="RSI Length", group="Shark") input rsiSourceInput = close;#, "Source", group="Shark") input length2 = 30;#, minval=1, group="Shark") input src = close;#, title="Source", group="Shark") input mult = 2.0;#, minval=0.001, maxval=50, title="StdDev", group="Shark") input offset = 0;#, "Offset", minval = -500, maxval = 500, group="Shark") input HighlightBreaches = yes;#, title="Highlight Oversold/Overbought", group="Shark") input bApply25and75 = no;#, title="Apply 25/75 RSI rule", group="Shark") def na = Double.NaN; def last = IsNaN(close); def pos = Double.POSITIVE_INFINITY; def neg = Double.NEGATIVE_INFINITY; DefineGlobalColor("intense_red", Color.RED);#CreateColor(255, 35, 35)); DefineGlobalColor("regular_red", Color.DARK_RED);#CreateColor(255, 82, 82)); DefineGlobalColor("intense_green", Color.GREEN);#CreateColor(0, 230, 118)); DefineGlobalColor("regular_green", Color.DARK_GREEN);#CreateColor(76, 175, 80)); #DefineGlobalColor("wt1", CreateColor(217,205,205)); DefineGlobalColor("wt1", Color.WHITE); DefineGlobalColor("wt2", CreateColor(51, 102, 255)); #DefineGlobalColor("wt2", CreateColor(29, 63, 97)); #// } FUNCTIONS #f_findDivs(src, topLimit, botLimit, useLimits) => script f_findDivs { input src = close; input topLimit = 70; input botLimit = 30; input useLimits = yes; def na = Double.NaN; def topfractal = src[4] < src[2] and src[3] < src[2] and src[2] > src[1] and src[2] > src[0]; def botfractal = src[4] > src[2] and src[3] > src[2] and src[2] < src[1] and src[2] < src[0]; def top_fractal = if IsNaN(topfractal) then 0 else topfractal; def bot_fractal = if IsNaN(botfractal) then 0 else botfractal; def fractalize = if top_fractal then 1 else if bot_fractal then -1 else 0; def fractalTop = if fractalize > 0 and (if useLimits then src[2] >= topLimit else yes) then src[2] else na; def fractalBot = if fractalize < 0 and (if useLimits then src[2] <= botLimit else yes) then src[2] else na; def TopCond = if !IsNaN(fractalTop) and fractalTop then fractalTop else 0; def BotCond = if !IsNaN(fractalBot) and fractalBot then fractalBot else 0; def highPrev0; def highPrev1; def highPrice0; def highPrice1; if TopCond { highPrev1 = highPrev0[1]; highPrev0 = src[2]; highPrice1 = highPrice0[1]; highPrice0 = high[2]; } else { highPrev1 = highPrev1[1]; highPrev0 = highPrev0[1]; highPrice1 = highPrice1[1]; highPrice0 = highPrice0[1]; } def highPrev = highPrev1[2];#if highPrev1 != highPrev1[1] then highPrev1[1] else highPrev[1]; def highPrice = highPrice1[2];#if highPrice1 != highPrice1[1] then highPrice1[1] else highPrice[1]; def lowPrev0; def lowPrev1; def lowPrice0; def lowPrice1; if BotCond { lowPrev1 = lowPrev0[1]; lowPrev0 = src[2]; lowPrice1 = lowPrice0[1]; lowPrice0 = low[2]; } else { lowPrev1 = lowPrev1[1]; lowPrev0 = lowPrev0[1]; lowPrice1 = lowPrice1[1]; lowPrice0 = lowPrice0[1]; } def lowPrev = lowPrev1[2];#if lowPrev1 != lowPrev1[1] then lowPrev1[1] else lowPrev[1]; def lowPrice = lowPrice1[2];#if lowPrice1 != lowPrice1[1] then lowPrice1[1] else lowPrice[1]; def bearSignal = TopCond and high[2] > highPrice and src[2] < highPrev; def bullSignal = BotCond and low[2] < lowPrice and src[2] > lowPrev; def bearDivHidden = TopCond and high[2] < highPrice and src[2] > highPrev; def bullDivHidden = BotCond and low[2] > lowPrice and src[2] < lowPrev; plot top = if IsNaN(TopCond) then 0 else TopCond;#fractalTop; plot bot = if IsNaN(BotCond) then 0 else BotCond;#fractalBot; plot lowP = lowPrev; plot sigBear = if IsNaN(bearSignal) then 0 else bearSignal; plot sigBull = if IsNaN(bullSignal) then 0 else bullSignal; plot hidBear = if IsNaN(bearDivHidden) then 0 else bearDivHidden; plot hidBull = if IsNaN(bullDivHidden) then 0 else bullDivHidden; } #// Stochastic RSI script f_stochrsi { input _src = close; input _stochlen = 14; input _rsilen = 14; input _smoothk = 3; input _smoothd = 3; input _log = yes; input _avg = no; def src = if _log then Log(_src) else _src; def rsi = RSI(Price = src, Length = _rsilen); def stoch = 100 * (rsi - Lowest(rsi, _stochlen)) / (Highest(rsi, _stochlen) - Lowest(rsi, _stochlen)); def kk = Average(stoch, _smoothk); def d1 = Average(kk, _smoothd); def avg_1 = (kk + d1) / 2; def k = if _avg then avg_1 else kk; plot stochK = k; plot stochD = d1; } #/ RSI+MFI script f_rsimfi { input _period = 60; input _multiplier = 150; input rsiMFIPosY = 2.5; def c = close; def o = open; def h = high; def l = low; def dif = (c - o) / (h - l); def diff = if !IsNaN(dif) then dif else 0; def rsimfi = Average(diff * _multiplier, _period) - rsiMFIPosY; plot f_rsimfi = rsimfi; } #// WaveTrend script f_wavetrend { #def wt1 = f_wavetrend(wtMASource, wtChannelLen, wtAverageLen, wtMALen, obLevel, osLevel).wt_1; input wtMASource = close; input wtChannelLen = 9; input wtAverageLen = 12; input wtMALen = 3; input obLevel = 53; input osLevel = -53; def tfsrc = wtMASource; def esa = ExpAverage(tfsrc, wtChannelLen); def de = ExpAverage(AbsValue(tfsrc - esa), wtChannelLen); def ci = (tfsrc - esa) / (0.015 * de); def wt1 = ExpAverage(ci, wtAverageLen); def wt2 = Average(wt1, wtMALen); def wtVwap = wt1 - wt2; def wtOversold = wt2 <= osLevel; def wtOverbought = wt2 >= obLevel; def wtCross = Crosses(wt1, wt2, CrossingDirection.ANY); def wtCrossUp = (wt2 - wt1) <= 0; def wtCrossDown = (wt2 - wt1) >= 0; def wtCrosslast = Crosses(wt1[2], wt2[2], CrossingDirection.ANY); def wtCrossUplast = (wt2[2] - wt1[2]) <= 0; def wtCrossDownlast = (wt2[2] - wt1[2]) >= 0; plot wt_1 = wt1; def wt_2 = wt2; def wt_OS = wtOversold; def wt_OB = wtOverbought; def wt_cross = wtCross; def wt_CrossUp = wtCrossUp; def wt_CrossDn = wtCrossDown; def wt_Vwap = wtVwap; } #// CALCULATE INDICATORS { #// RSI def rsi = RSI(Price = rsiSRC, Length = rsiLen); #// RSI + MFI Area def rsiMFI = f_rsimfi(rsiMFIperiod, rsiMFIMultiplier, rsiMFIPosY); #// Calculates WaveTrend def wt1 = f_wavetrend(wtMASource, wtChannelLen, wtAverageLen, wtMALen, obLevel, osLevel).wt_1; def wt2 = f_wavetrend(wtMASource, wtChannelLen, wtAverageLen, wtMALen, obLevel, osLevel).wt_2; def wtOversold = f_wavetrend(wtMASource, wtChannelLen, wtAverageLen, wtMALen, obLevel, osLevel).wt_OS; def wtOverbought = f_wavetrend(wtMASource, wtChannelLen, wtAverageLen, wtMALen, obLevel, osLevel).wt_OB; def wtCross = f_wavetrend(wtMASource, wtChannelLen, wtAverageLen, wtMALen, obLevel, osLevel).wt_cross; def wtCrossUp = f_wavetrend(wtMASource, wtChannelLen, wtAverageLen, wtMALen, obLevel, osLevel).wt_CrossUp; def wtCrossDown = f_wavetrend(wtMASource, wtChannelLen, wtAverageLen, wtMALen, obLevel, osLevel).wt_CrossDn; def wtVwap = f_wavetrend(wtMASource, wtChannelLen, wtAverageLen, wtMALen, obLevel, osLevel).wt_Vwap; def shark1 = wt1 > 60 and wt1 < 80; def shark2 = wt1 > 80; def nshark1 = wt1 < -60 and wt1 > -80; def nshark2 = wt1 < -80; AddLabel(yes, if shark1 then "sell" else if shark2 then "XSELL" else if nshark1 then "buy" else if nshark2 then "XBUY" else " ", if shark1 then color.white else if NSHARK1 or shark2 then color.YELLOW else Color.BLACK); AssignBACKGROUNDColor(if shark1 then color.dark_red else if shark2 then color.red else if nshark1 then color.dark_green else if nshark2 then color.green else color.black);
Can we use this on Daily or hourly ?
 
Has anyone been successful setting up a Sharkwave Watchlist? with my very, very
limited knowledge I have been able to set up the chart with both indicators, but do no know how to set up
the Watchlist can anyone help please - this is for TOS
 
Has anyone been successful setting up a Sharkwave Watchlist? with my very, very
limited knowledge I have been able to set up the chart with both indicators, but do no know how to set up
the Watchlist can anyone help please - this is for TOS
Yes. I created one. See below.
Code:
#study(title = 'SharkWaveTrend', shorttitle = 'SharkWaveTrend')
# Converted by Sam4Cok@Samer800 - 12/2023

input colorBars = no;
input vwapShow = no;#(true, title = 'Show Fast WT', type = input.bool)
input wtChannelLen = 5;#, title = 'WT Channel Length', type = input.integer)
input wtAverageLen = 5;#, title = 'WT Average Length', type = input.integer)
input wtMASource = hlc3;#, title = 'WT MA Source', type = input.source)
input wtMaLen = 2;#, title = 'WT MA Length', type = input.integer)
input obLevel = 53;#, title = 'WT Overbought Level 1', type = input.integer)
input osLevel = -53;#, title = 'WT Oversold Level 1', type = input.integer)
input wtShowDiv = yes;#(true, title = 'Show WT Regular Divergences', type = input.bool)
input wtShowHiddenDiv = no;#(false, title = 'Show WT Hidden Divergences', type = input.bool)
input showHiddenDiv_nl = yes;#(true, title = 'Not apply OB/OS Limits on Hidden Divergences', type = input.bool)
input wtDivOBLevel = 45;#, title = 'WT Bearish Divergence min', type = input.integer)
input wtDivOSLevel = -65;#, title = 'WT Bullish Divergence min', type = input.integer)
input wtDivOBLevel_addshow = yes;#(true, title = 'Show 2nd WT Regular Divergences', type = input.bool)
input wtDivOBLevel_add = 15;#, title = 'WT 2nd Bearish Divergence', type = input.integer)
input wtDivOSLevel_add = -40;#, title = 'WT 2nd Bullish Divergence 15 min', type = input.integer)
input rsiMFIShow = no;#(true, title = 'Show MFI', type = input.bool)
input rsiMFIperiod = 60;#,title = 'MFI Period', type = input.integer)
input rsiMFIMultiplier = 150;#, title = 'MFI Area multiplier', type = input.float)
input rsiMFIPosY = 2.5;#, title = 'MFI Area Y Pos', type = input.float)
input showRsiLine = no;    #(false, title = 'Show RSI', type = input.bool)
input rsiSRC = close;#(close, title = 'RSI Source', type = input.source)
input rsiLen = 12;#, title = 'RSI Length', type = input.integer)
#input rsiOversold = 30;#, title = 'RSI Oversold', minval = 50, maxval = 100, type = input.integer)
#input rsiOverbought = 60;#, title = 'RSI Overbought', minval = 0, maxval = 50, type = input.integer)
input rsiShowDiv = yes;#(false, title = 'Show RSI Regular Divergences', type = input.bool)
input rsiShowHiddenDiv = no;#(false, title = 'Show RSI Hidden Divergences', type = input.bool)
input rsiDivOBLevel = 60;#, title = 'RSI Bearish Divergence min', type = input.integer)
input rsiDivOSLevel = 30;#, title = 'RSI Bullish Divergence min', type = input.integer)

input stochShow = no;#(true, title = 'Show Stochastic RSI', type = input.bool)
input stochUseLog = yes;#(true, title=' Use Log?', type = input.bool)
input stochAvg = no;#(false, title='Use Average of both K & D', type = input.bool)
input stochSRC = close;#(close, title = 'Stochastic RSI Source', type = input.source)
input stochLen = 14;#, title = 'Stochastic RSI Length', type = input.integer)
input stochRsiLen = 14;#, title = 'RSI Length ', type = input.integer)
input stochKSmooth = 3;#, title = 'Stochastic RSI K Smooth', type = input.integer)
input stochDSmooth = 3;#, title = 'Stochastic RSI D Smooth', type = input.integer)
input stochShowDiv = yes;#(false, title = 'Show Stoch Regular Divergences', type = input.bool)
input stochShowHiddenDiv = no;#(false, title = 'Show Stoch Hidden Divergences', type = input.bool)
input rsiLengthInput = 12;#, minval=1, title="RSI Length", group="Shark")
input rsiSourceInput = close;#, "Source", group="Shark")
input length2 = 30;#, minval=1, group="Shark")
input src = close;#, title="Source", group="Shark")
input mult = 2.0;#, minval=0.001, maxval=50, title="StdDev", group="Shark")
input offset = 0;#, "Offset", minval = -500, maxval = 500, group="Shark")
input HighlightBreaches = yes;#, title="Highlight Oversold/Overbought", group="Shark")
input bApply25and75 = no;#, title="Apply 25/75 RSI rule", group="Shark")


def na = Double.NaN;
def last = IsNaN(close);
def pos = Double.POSITIVE_INFINITY;
def neg = Double.NEGATIVE_INFINITY;

DefineGlobalColor("intense_red", Color.RED);#CreateColor(255, 35, 35));
DefineGlobalColor("regular_red", Color.DARK_RED);#CreateColor(255, 82, 82));
DefineGlobalColor("intense_green", Color.GREEN);#CreateColor(0, 230, 118));
DefineGlobalColor("regular_green", Color.DARK_GREEN);#CreateColor(76, 175, 80));
#DefineGlobalColor("wt1", CreateColor(217,205,205));
DefineGlobalColor("wt1", Color.WHITE);
DefineGlobalColor("wt2", CreateColor(51, 102, 255));
#DefineGlobalColor("wt2", CreateColor(29, 63, 97));
#// } FUNCTIONS
#f_findDivs(src, topLimit, botLimit, useLimits) =>
script f_findDivs {
    input src = close;
    input topLimit = 70;
    input botLimit = 30;
    input useLimits = yes;
    def na = Double.NaN;
    def topfractal = src[4] < src[2] and src[3] < src[2] and src[2] > src[1] and src[2] > src[0];
    def botfractal = src[4] > src[2] and src[3] > src[2] and src[2] < src[1] and src[2] < src[0];
    def top_fractal = if IsNaN(topfractal) then 0 else topfractal;
    def bot_fractal = if IsNaN(botfractal) then 0 else botfractal;
    def fractalize  = if top_fractal then 1 else if bot_fractal then -1 else 0;
    def fractalTop = if fractalize > 0 and (if useLimits then src[2] >= topLimit else yes) then src[2] else na;
    def fractalBot = if fractalize < 0 and (if useLimits then src[2] <= botLimit else yes) then src[2] else na;
    def TopCond = if !IsNaN(fractalTop) and fractalTop then fractalTop else 0;
    def BotCond = if !IsNaN(fractalBot) and fractalBot then fractalBot else 0;
    def highPrev0;
    def highPrev1;
    def highPrice0;
    def highPrice1;
    if TopCond {
        highPrev1  = highPrev0[1];
        highPrev0  = src[2];
        highPrice1 = highPrice0[1];
        highPrice0 = high[2];
    } else {
        highPrev1  = highPrev1[1];
        highPrev0  = highPrev0[1];
        highPrice1 = highPrice1[1];
        highPrice0 = highPrice0[1];
    }
    def highPrev = highPrev1[2];#if highPrev1 != highPrev1[1] then highPrev1[1] else highPrev[1];
    def highPrice = highPrice1[2];#if highPrice1 != highPrice1[1] then highPrice1[1] else highPrice[1];
    def lowPrev0;
    def lowPrev1;
    def lowPrice0;
    def lowPrice1;
    if BotCond {
        lowPrev1  = lowPrev0[1];
        lowPrev0  = src[2];
        lowPrice1 = lowPrice0[1];
        lowPrice0 = low[2];
    } else {
        lowPrev1  = lowPrev1[1];
        lowPrev0  = lowPrev0[1];
        lowPrice1 = lowPrice1[1];
        lowPrice0 = lowPrice0[1];
    }
    def lowPrev = lowPrev1[2];#if lowPrev1 != lowPrev1[1] then lowPrev1[1] else lowPrev[1];
    def lowPrice = lowPrice1[2];#if lowPrice1 != lowPrice1[1] then lowPrice1[1] else lowPrice[1];
    def bearSignal = TopCond and high[2] > highPrice and src[2] < highPrev;
    def bullSignal = BotCond and low[2] < lowPrice and src[2] > lowPrev;
    def bearDivHidden = TopCond and high[2] < highPrice and src[2] > highPrev;
    def bullDivHidden = BotCond and low[2] > lowPrice and src[2] < lowPrev;
    plot top = if IsNaN(TopCond) then 0 else TopCond;#fractalTop;
    plot bot = if IsNaN(BotCond) then 0 else BotCond;#fractalBot;
    plot lowP = lowPrev;
    plot sigBear = if IsNaN(bearSignal) then 0 else bearSignal;
    plot sigBull = if IsNaN(bullSignal) then 0 else bullSignal;
    plot hidBear = if IsNaN(bearDivHidden) then 0 else bearDivHidden;
    plot hidBull = if IsNaN(bullDivHidden) then 0 else bullDivHidden;
}
#// Stochastic RSI
script f_stochrsi {
    input _src = close;
    input _stochlen = 14;
    input _rsilen = 14;
    input _smoothk = 3;
    input _smoothd = 3;
    input _log = yes;
    input _avg = no;
    def src = if _log then Log(_src) else _src;
    def rsi = RSI(Price = src, Length = _rsilen);
    def stoch = 100 * (rsi - Lowest(rsi, _stochlen)) / (Highest(rsi, _stochlen) - Lowest(rsi, _stochlen));
    def kk = Average(stoch, _smoothk);
    def d1 = Average(kk, _smoothd);
    def avg_1 = (kk + d1) / 2;
    def k = if _avg then avg_1 else kk;
    plot stochK = k;
    plot stochD = d1;
}
#/ RSI+MFI
script f_rsimfi {
    input _period = 60;
    input _multiplier = 150;
    input rsiMFIPosY = 2.5;
    def c = close;
    def o = open;
    def h = high;
    def l = low;
    def dif = (c - o) / (h - l);
    def diff = if !IsNaN(dif) then dif else 0;
    def rsimfi = Average(diff * _multiplier, _period) - rsiMFIPosY;
    plot f_rsimfi = rsimfi;
}
#// WaveTrend
script f_wavetrend {
#def wt1 = f_wavetrend(wtMASource, wtChannelLen, wtAverageLen, wtMALen, obLevel, osLevel).wt_1;
    input wtMASource = close;
    input wtChannelLen = 9;
    input wtAverageLen = 12;
    input wtMALen = 3;
    input obLevel = 53;
    input osLevel = -53;
    def tfsrc = wtMASource;
    def esa = ExpAverage(tfsrc, wtChannelLen);
    def de = ExpAverage(AbsValue(tfsrc - esa), wtChannelLen);
    def ci = (tfsrc - esa) / (0.015 * de);
    def wt1 = ExpAverage(ci, wtAverageLen);
    def wt2 = Average(wt1, wtMALen);
    def wtVwap = wt1 - wt2;
    def wtOversold = wt2 <= osLevel;
    def wtOverbought = wt2 >= obLevel;
    def wtCross = Crosses(wt1, wt2, CrossingDirection.ANY);
    def wtCrossUp = (wt2 - wt1) <= 0;
    def wtCrossDown = (wt2 - wt1) >= 0;
    def wtCrosslast = Crosses(wt1[2], wt2[2], CrossingDirection.ANY);
    def wtCrossUplast = (wt2[2] - wt1[2]) <= 0;
    def wtCrossDownlast = (wt2[2] - wt1[2]) >= 0;
    plot wt_1 = wt1;
    def wt_2 = wt2;
    def wt_OS = wtOversold;
    def wt_OB = wtOverbought;
    def wt_cross = wtCross;
    def wt_CrossUp = wtCrossUp;
    def wt_CrossDn = wtCrossDown;
    def wt_Vwap = wtVwap;
}
#// CALCULATE INDICATORS {
#// RSI
def rsi = RSI(Price = rsiSRC, Length = rsiLen);
#// RSI + MFI Area
def rsiMFI = f_rsimfi(rsiMFIperiod, rsiMFIMultiplier, rsiMFIPosY);
#// Calculates WaveTrend
def wt1 = f_wavetrend(wtMASource, wtChannelLen, wtAverageLen, wtMALen, obLevel, osLevel).wt_1;
def wt2 = f_wavetrend(wtMASource, wtChannelLen, wtAverageLen, wtMALen, obLevel, osLevel).wt_2;
def wtOversold = f_wavetrend(wtMASource, wtChannelLen, wtAverageLen, wtMALen, obLevel, osLevel).wt_OS;
def wtOverbought = f_wavetrend(wtMASource, wtChannelLen, wtAverageLen, wtMALen, obLevel, osLevel).wt_OB;
def wtCross = f_wavetrend(wtMASource, wtChannelLen, wtAverageLen, wtMALen, obLevel, osLevel).wt_cross;
def wtCrossUp = f_wavetrend(wtMASource, wtChannelLen, wtAverageLen, wtMALen, obLevel, osLevel).wt_CrossUp;
def wtCrossDown = f_wavetrend(wtMASource, wtChannelLen, wtAverageLen, wtMALen, obLevel, osLevel).wt_CrossDn;
def wtVwap = f_wavetrend(wtMASource, wtChannelLen, wtAverageLen, wtMALen, obLevel, osLevel).wt_Vwap;


def shark0 = wt1 > 45 and wt1 <60;
def nshark0 = wt1 < -45 and wt1 > -60;
def shark1 = wt1 > 60 and wt1 < 80;
def shark2 = wt1 > 80;
def nshark1 = wt1 < -60 and wt1 > -80;
def nshark2 = wt1 < -80;
def crossup = wt1 crosses above wt2 and wt1 < -20;
def crossdn = wt1 crosses below wt2 and wt1 > 20;

#//KDJ indicator
def Length = 14;
def ll = Lowest(low, Length);
def hh = Highest(high, Length);
def rsv = (close - ll) / (hh - ll) * 100;

script xsa {
    input src = close;
    input len = 0;
    input wei = 0;
    def sumf;
    def ma;
    def out;
    sumf =  CompoundValue(1, sumf[1] - src[len] + src, src);
    ma   =  if IsNaN(src[len]) then Double.NaN else sumf / len;
    out  =  if IsNaN(out[1]) then ma else (src * wei + out[1] * (len - wei)) / len;
    plot return = out;
}

def k_ = xsa(rsv, 3, 1);
def d_ = xsa(k_, 3, 1);
def k = if k_ then k_ else na;
def d = if d_ then d_ else na;
def crossUp1 = Crosses(k, d, CrossingDirection.ABOVE);
def crossDn1 = Crosses(d, k, CrossingDirection.BELOW);
def buysig =  if d < 25 and crossUp1 then -103 else na;
def selsig =  if d > 75 and crossDn1 then 103 else na;

#//plot buy and sell signal
def ple = buysig;#,color=color.green, linewidth=1,style=plot.style_area, transp=0)
def pse = selsig;#,color=color.red, linewidth=2,style=plot.style_line, transp=0)
#ple.SetDefaultColor(Color.cyan);
#ple.SetPaintingStrategy(PaintingStrategy.POINTS);
#ple.setlineWeight(5);
#pse.SetDefaultColor(Color.magenta);
#pse.SetPaintingStrategy(PaintingStrategy.POINTS);
#pse.setlineWeight(5);

AddLabel(yes, if buysig then "LB" else if crossup then "UP" else if selsig then "LS" else if crossdn then "DOWN" else if shark1 then "sell" else if shark2 then "XSELL" else if nshark1 then "buy" else if nshark2 then "XBUY" else " ", if shark1 or crossdn then color.white else if NSHARK1 or shark2 or crossup then color.blue else Color.BLACK);

AssignBACKGROUNDColor( if shark0 then color.dark_red else if shark1 then color.red else  if nshark0 then color.dark_green else if nshark1 then color.green else if nshark2 then color.cyan else if shark2 then color.magenta else color.black);
 
Thank you chewie76, but I am embarrassed to say I don't know how to utilize that code
and make it into the watchlist - I did it okay creating the chart - but somehow It doesn't work
for me creating the watch list
 
Just wondering what the most popular time frames are for using this indicator set up, I was using
1m and 2m but then read you said it was designed for 5m so what is the best time frame in your opinion?
 
Just wondering what the most popular time frames are for using this indicator set up, I was using
1m and 2m but then read you said it was designed for 5m so what is the best time frame in your opinion?
The original indicator is not from this forum.
Use whatever the author states is optimum in his video.

How is the lower indicator used? Thanks!
Yes, this thread is dedicated to the use of the lower indicator.
You can read through the posts in these two pages, to find how it is being used.
Watch the video to get an idea of how it is getting applied to the Trader Oracle method.
Find out more about Trader Oracle:
https://usethinkscript.com/threads/traderoracle-method-for-thinkorswim.17127/

 
Last edited:
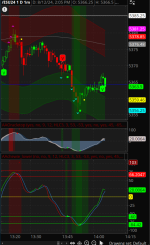
Okay, another question abut the candles shown on page one post one - some are green and solid or hollow and some are red solid or hollow, I though it had something to do about the value of the lower indicator >
< but only seems like that some times and why the solid?
Would very much appreciate if someone has know why this is happening?

as you can see in the attached
it seems the color of the candles are coordinated with the lower indicator -(is this correct?)
and as you can see some of the candles are solid - was wondering what makes some solid and some not?
This is compared to the indicator without the colored candles
 

Attachments

  • Capture a.PNG
    Capture a.PNG
    92 KB · Views: 119
  • Capture b.PNG
    Capture b.PNG
    112.1 KB · Views: 122
Last edited by a moderator:
as you can see in the attached
it seems the color of the candles are coordinated with the lower indicator -(is this correct?)
yes, the color of the candles are coordinated with the lower indicator.
To turn off the coordination:
input ColorBar = yes;
In the indicator settings, change ColorBar to no


some of the candles are solid - was wondering what makes some solid and some not?
In chart settings, you choose whether your candles are solid or not
What defines candles solid or not?
Answer is here:
https://toslc.thinkorswim.com/center/howToTos/thinkManual/charts/Chart-Modes/Chart-Types/candletrend
Still confused? You can google solid vs hollow candles on a stock chart, as this is a basic aspect of charting.

To turn off solid/hollow candles, you must choose a different chart type. Read more about the different chart types: https://toslc.thinkorswim.com/center/howToTos/thinkManual/charts/Chart-Modes/Chart-Types
 
Last edited:
yes, the color of the candles are coordinated with the lower indicator.
To turn off the coordination:

In the indicator settings, change ColorBar to no


In chart settings, you choose whether your candles are solid or not
What defines candles solid or not?
Answer is here:
https://toslc.thinkorswim.com/center/howToTos/thinkManual/charts/Chart-Modes/Chart-Types/candletrend
Still confused? You can google solid vs hollow candles on a stock chart, as this is a basic aspect of charting.

To turn off solid/hollow candles, you must choose a different chart type. Read more about the different chart types: https://toslc.thinkorswim.com/center/howToTos/thinkManual/charts/Chart-Modes/Chart-Types
Thank You for your prompt response, it's just that I know the difference of hollow candles (outlined) or
solid candles (filled) But I never heard of a combination of both on the same chart unless there is something making that happen? so my question is, is something making that happen? like one of the indicators?
So not just turning color off or on , but why a few of them are filled and the majority are not?
Sorry for the bother - I will not ask about this again....sorry
 
Last edited by a moderator:
You can use this code for a watchlist column. It is when the line is over 60-80.
Zuki6Fb.png

Code:
#study(title = 'SharkWaveTrend', shorttitle = 'SharkWaveTrend')
# Converted by Sam4Cok@Samer800 - 12/2023

input colorBars = no;
input vwapShow = no;#(true, title = 'Show Fast WT', type = input.bool)
input wtChannelLen = 9;#, title = 'WT Channel Length', type = input.integer)
input wtAverageLen = 12;#, title = 'WT Average Length', type = input.integer)
input wtMASource = hlc3;#, title = 'WT MA Source', type = input.source)
input wtMaLen = 3;#, title = 'WT MA Length', type = input.integer)
input obLevel = 53;#, title = 'WT Overbought Level 1', type = input.integer)
input osLevel = -53;#, title = 'WT Oversold Level 1', type = input.integer)
input wtShowDiv = yes;#(true, title = 'Show WT Regular Divergences', type = input.bool)
input wtShowHiddenDiv = no;#(false, title = 'Show WT Hidden Divergences', type = input.bool)
input showHiddenDiv_nl = yes;#(true, title = 'Not apply OB/OS Limits on Hidden Divergences', type = input.bool)
input wtDivOBLevel = 45;#, title = 'WT Bearish Divergence min', type = input.integer)
input wtDivOSLevel = -65;#, title = 'WT Bullish Divergence min', type = input.integer)
input wtDivOBLevel_addshow = yes;#(true, title = 'Show 2nd WT Regular Divergences', type = input.bool)
input wtDivOBLevel_add = 15;#, title = 'WT 2nd Bearish Divergence', type = input.integer)
input wtDivOSLevel_add = -40;#, title = 'WT 2nd Bullish Divergence 15 min', type = input.integer)
input rsiMFIShow = no;#(true, title = 'Show MFI', type = input.bool)
input rsiMFIperiod = 60;#,title = 'MFI Period', type = input.integer)
input rsiMFIMultiplier = 150;#, title = 'MFI Area multiplier', type = input.float)
input rsiMFIPosY = 2.5;#, title = 'MFI Area Y Pos', type = input.float)
input showRsiLine = no;    #(false, title = 'Show RSI', type = input.bool)
input rsiSRC = close;#(close, title = 'RSI Source', type = input.source)
input rsiLen = 12;#, title = 'RSI Length', type = input.integer)
#input rsiOversold = 30;#, title = 'RSI Oversold', minval = 50, maxval = 100, type = input.integer)
#input rsiOverbought = 60;#, title = 'RSI Overbought', minval = 0, maxval = 50, type = input.integer)
input rsiShowDiv = yes;#(false, title = 'Show RSI Regular Divergences', type = input.bool)
input rsiShowHiddenDiv = no;#(false, title = 'Show RSI Hidden Divergences', type = input.bool)
input rsiDivOBLevel = 60;#, title = 'RSI Bearish Divergence min', type = input.integer)
input rsiDivOSLevel = 30;#, title = 'RSI Bullish Divergence min', type = input.integer)

input stochShow = no;#(true, title = 'Show Stochastic RSI', type = input.bool)
input stochUseLog = yes;#(true, title=' Use Log?', type = input.bool)
input stochAvg = no;#(false, title='Use Average of both K & D', type = input.bool)
input stochSRC = close;#(close, title = 'Stochastic RSI Source', type = input.source)
input stochLen = 14;#, title = 'Stochastic RSI Length', type = input.integer)
input stochRsiLen = 14;#, title = 'RSI Length ', type = input.integer)
input stochKSmooth = 3;#, title = 'Stochastic RSI K Smooth', type = input.integer)
input stochDSmooth = 3;#, title = 'Stochastic RSI D Smooth', type = input.integer)
input stochShowDiv = yes;#(false, title = 'Show Stoch Regular Divergences', type = input.bool)
input stochShowHiddenDiv = no;#(false, title = 'Show Stoch Hidden Divergences', type = input.bool)
input rsiLengthInput = 12;#, minval=1, title="RSI Length", group="Shark")
input rsiSourceInput = close;#, "Source", group="Shark")
input length2 = 30;#, minval=1, group="Shark")
input src = close;#, title="Source", group="Shark")
input mult = 2.0;#, minval=0.001, maxval=50, title="StdDev", group="Shark")
input offset = 0;#, "Offset", minval = -500, maxval = 500, group="Shark")
input HighlightBreaches = yes;#, title="Highlight Oversold/Overbought", group="Shark")
input bApply25and75 = no;#, title="Apply 25/75 RSI rule", group="Shark")


def na = Double.NaN;
def last = IsNaN(close);
def pos = Double.POSITIVE_INFINITY;
def neg = Double.NEGATIVE_INFINITY;

DefineGlobalColor("intense_red", Color.RED);#CreateColor(255, 35, 35));
DefineGlobalColor("regular_red", Color.DARK_RED);#CreateColor(255, 82, 82));
DefineGlobalColor("intense_green", Color.GREEN);#CreateColor(0, 230, 118));
DefineGlobalColor("regular_green", Color.DARK_GREEN);#CreateColor(76, 175, 80));
#DefineGlobalColor("wt1", CreateColor(217,205,205));
DefineGlobalColor("wt1", Color.WHITE);
DefineGlobalColor("wt2", CreateColor(51, 102, 255));
#DefineGlobalColor("wt2", CreateColor(29, 63, 97));
#// } FUNCTIONS
#f_findDivs(src, topLimit, botLimit, useLimits) =>
script f_findDivs {
    input src = close;
    input topLimit = 70;
    input botLimit = 30;
    input useLimits = yes;
    def na = Double.NaN;
    def topfractal = src[4] < src[2] and src[3] < src[2] and src[2] > src[1] and src[2] > src[0];
    def botfractal = src[4] > src[2] and src[3] > src[2] and src[2] < src[1] and src[2] < src[0];
    def top_fractal = if IsNaN(topfractal) then 0 else topfractal;
    def bot_fractal = if IsNaN(botfractal) then 0 else botfractal;
    def fractalize  = if top_fractal then 1 else if bot_fractal then -1 else 0;
    def fractalTop = if fractalize > 0 and (if useLimits then src[2] >= topLimit else yes) then src[2] else na;
    def fractalBot = if fractalize < 0 and (if useLimits then src[2] <= botLimit else yes) then src[2] else na;
    def TopCond = if !IsNaN(fractalTop) and fractalTop then fractalTop else 0;
    def BotCond = if !IsNaN(fractalBot) and fractalBot then fractalBot else 0;
    def highPrev0;
    def highPrev1;
    def highPrice0;
    def highPrice1;
    if TopCond {
        highPrev1  = highPrev0[1];
        highPrev0  = src[2];
        highPrice1 = highPrice0[1];
        highPrice0 = high[2];
    } else {
        highPrev1  = highPrev1[1];
        highPrev0  = highPrev0[1];
        highPrice1 = highPrice1[1];
        highPrice0 = highPrice0[1];
    }
    def highPrev = highPrev1[2];#if highPrev1 != highPrev1[1] then highPrev1[1] else highPrev[1];
    def highPrice = highPrice1[2];#if highPrice1 != highPrice1[1] then highPrice1[1] else highPrice[1];
    def lowPrev0;
    def lowPrev1;
    def lowPrice0;
    def lowPrice1;
    if BotCond {
        lowPrev1  = lowPrev0[1];
        lowPrev0  = src[2];
        lowPrice1 = lowPrice0[1];
        lowPrice0 = low[2];
    } else {
        lowPrev1  = lowPrev1[1];
        lowPrev0  = lowPrev0[1];
        lowPrice1 = lowPrice1[1];
        lowPrice0 = lowPrice0[1];
    }
    def lowPrev = lowPrev1[2];#if lowPrev1 != lowPrev1[1] then lowPrev1[1] else lowPrev[1];
    def lowPrice = lowPrice1[2];#if lowPrice1 != lowPrice1[1] then lowPrice1[1] else lowPrice[1];
    def bearSignal = TopCond and high[2] > highPrice and src[2] < highPrev;
    def bullSignal = BotCond and low[2] < lowPrice and src[2] > lowPrev;
    def bearDivHidden = TopCond and high[2] < highPrice and src[2] > highPrev;
    def bullDivHidden = BotCond and low[2] > lowPrice and src[2] < lowPrev;
    plot top = if IsNaN(TopCond) then 0 else TopCond;#fractalTop;
    plot bot = if IsNaN(BotCond) then 0 else BotCond;#fractalBot;
    plot lowP = lowPrev;
    plot sigBear = if IsNaN(bearSignal) then 0 else bearSignal;
    plot sigBull = if IsNaN(bullSignal) then 0 else bullSignal;
    plot hidBear = if IsNaN(bearDivHidden) then 0 else bearDivHidden;
    plot hidBull = if IsNaN(bullDivHidden) then 0 else bullDivHidden;
}
#// Stochastic RSI
script f_stochrsi {
    input _src = close;
    input _stochlen = 14;
    input _rsilen = 14;
    input _smoothk = 3;
    input _smoothd = 3;
    input _log = yes;
    input _avg = no;
    def src = if _log then Log(_src) else _src;
    def rsi = RSI(Price = src, Length = _rsilen);
    def stoch = 100 * (rsi - Lowest(rsi, _stochlen)) / (Highest(rsi, _stochlen) - Lowest(rsi, _stochlen));
    def kk = Average(stoch, _smoothk);
    def d1 = Average(kk, _smoothd);
    def avg_1 = (kk + d1) / 2;
    def k = if _avg then avg_1 else kk;
    plot stochK = k;
    plot stochD = d1;
}
#/ RSI+MFI
script f_rsimfi {
    input _period = 60;
    input _multiplier = 150;
    input rsiMFIPosY = 2.5;
    def c = close;
    def o = open;
    def h = high;
    def l = low;
    def dif = (c - o) / (h - l);
    def diff = if !IsNaN(dif) then dif else 0;
    def rsimfi = Average(diff * _multiplier, _period) - rsiMFIPosY;
    plot f_rsimfi = rsimfi;
}
#// WaveTrend
script f_wavetrend {
#def wt1 = f_wavetrend(wtMASource, wtChannelLen, wtAverageLen, wtMALen, obLevel, osLevel).wt_1;
    input wtMASource = close;
    input wtChannelLen = 9;
    input wtAverageLen = 12;
    input wtMALen = 3;
    input obLevel = 53;
    input osLevel = -53;
    def tfsrc = wtMASource;
    def esa = ExpAverage(tfsrc, wtChannelLen);
    def de = ExpAverage(AbsValue(tfsrc - esa), wtChannelLen);
    def ci = (tfsrc - esa) / (0.015 * de);
    def wt1 = ExpAverage(ci, wtAverageLen);
    def wt2 = Average(wt1, wtMALen);
    def wtVwap = wt1 - wt2;
    def wtOversold = wt2 <= osLevel;
    def wtOverbought = wt2 >= obLevel;
    def wtCross = Crosses(wt1, wt2, CrossingDirection.ANY);
    def wtCrossUp = (wt2 - wt1) <= 0;
    def wtCrossDown = (wt2 - wt1) >= 0;
    def wtCrosslast = Crosses(wt1[2], wt2[2], CrossingDirection.ANY);
    def wtCrossUplast = (wt2[2] - wt1[2]) <= 0;
    def wtCrossDownlast = (wt2[2] - wt1[2]) >= 0;
    plot wt_1 = wt1;
    def wt_2 = wt2;
    def wt_OS = wtOversold;
    def wt_OB = wtOverbought;
    def wt_cross = wtCross;
    def wt_CrossUp = wtCrossUp;
    def wt_CrossDn = wtCrossDown;
    def wt_Vwap = wtVwap;
}
#// CALCULATE INDICATORS {
#// RSI
def rsi = RSI(Price = rsiSRC, Length = rsiLen);
#// RSI + MFI Area
def rsiMFI = f_rsimfi(rsiMFIperiod, rsiMFIMultiplier, rsiMFIPosY);
#// Calculates WaveTrend
def wt1 = f_wavetrend(wtMASource, wtChannelLen, wtAverageLen, wtMALen, obLevel, osLevel).wt_1;
def wt2 = f_wavetrend(wtMASource, wtChannelLen, wtAverageLen, wtMALen, obLevel, osLevel).wt_2;
def wtOversold = f_wavetrend(wtMASource, wtChannelLen, wtAverageLen, wtMALen, obLevel, osLevel).wt_OS;
def wtOverbought = f_wavetrend(wtMASource, wtChannelLen, wtAverageLen, wtMALen, obLevel, osLevel).wt_OB;
def wtCross = f_wavetrend(wtMASource, wtChannelLen, wtAverageLen, wtMALen, obLevel, osLevel).wt_cross;
def wtCrossUp = f_wavetrend(wtMASource, wtChannelLen, wtAverageLen, wtMALen, obLevel, osLevel).wt_CrossUp;
def wtCrossDown = f_wavetrend(wtMASource, wtChannelLen, wtAverageLen, wtMALen, obLevel, osLevel).wt_CrossDn;
def wtVwap = f_wavetrend(wtMASource, wtChannelLen, wtAverageLen, wtMALen, obLevel, osLevel).wt_Vwap;


def shark1 = wt1 > 60 and wt1 < 80;
def shark2 = wt1 > 80;
def nshark1 = wt1 < -60 and wt1 > -80;
def nshark2 = wt1 < -80;

AddLabel(yes, if shark1 then "sell" else if shark2 then "XSELL" else if nshark1 then "buy" else if nshark2 then "XBUY" else " ", if shark1 then color.white else if NSHARK1 or shark2 then color.YELLOW else Color.BLACK);

AssignBACKGROUNDColor(if shark1 then color.dark_red else if shark2 then color.red else if nshark1 then color.dark_green else if nshark2 then color.green else color.black);

Regarding the Watchlist and the 60 - 80 What time frame is that on?
 
Thank You for your prompt response, it's just that I know the difference of hollow candles (outlined) or
solid candles (filled) But I never heard of a combination of both on the same chart unless there is something making that happen? so my question is, is something making that happen? like one of the indicators?
I apologize that it wasn't clear.
Solid & hollow candles is a choice under chart settings.
And coordinating the candle color with the indicator color is a setting inside this indicator.
Yes, you can turn on these settings to have a combination of both on the same chart.

No, the ToS platform does not provide the ability to customize the solid and hollow candles.
Solid and hollow candles can only be turned on and off.
They can not have custom definitions.
The ToS platform allows only the one standard definition of solid and hollow that is found on all charting platforms.
solid candles indicate that the closing price is lower than the opening price, while hollow candles indicate that the closing price is higher than the opening price
Kw9HnF9.png

If you turn off, coordinating the candle with the indicator. Then you will see the default where the hollow candles are green bullish and the solid are red bearish.

However, if you are painting the candles with the indicator colors, it will still show the bearish solid and bullish hollow candles but it will over-ride the bearish/bullish colors and replace them with the indicator colors.

If you do not want solid and hollow candles because you do not feel that they are meaningful with the use of this indicator, you can choose a different chart type:
https://toslc.thinkorswim.com/center/howToTos/thinkManual/charts/Chart-Modes/Chart-Types


Sorry for the bother - I will not ask about this again....sorry

No apologies necessary. Think about it. If you have the question, probably do many of the 10,000 viewers of the forum.

If this is not clear, keep asking questions. (y)
 
Last edited by a moderator:

Similar threads

Not the exact question you're looking for?

Start a new thread and receive assistance from our community.

87k+ Posts
214 Online
Create Post

Similar threads

Similar threads

The Market Trading Game Changer

Join 2,500+ subscribers inside the useThinkScript VIP Membership Club
  • Exclusive indicators
  • Proven strategies & setups
  • Private Discord community
  • ‘Buy The Dip’ signal alerts
  • Exclusive members-only content
  • Add-ons and resources
  • 1 full year of unlimited support

Frequently Asked Questions

What is useThinkScript?

useThinkScript is the #1 community of stock market investors using indicators and other tools to power their trading strategies. Traders of all skill levels use our forums to learn about scripting and indicators, help each other, and discover new ways to gain an edge in the markets.

How do I get started?

We get it. Our forum can be intimidating, if not overwhelming. With thousands of topics, tens of thousands of posts, our community has created an incredibly deep knowledge base for stock traders. No one can ever exhaust every resource provided on our site.

If you are new, or just looking for guidance, here are some helpful links to get you started.

What are the benefits of VIP Membership?
VIP members get exclusive access to these proven and tested premium indicators: Buy the Dip, Advanced Market Moves 2.0, Take Profit, and Volatility Trading Range. In addition, VIP members get access to over 50 VIP-only custom indicators, add-ons, and strategies, private VIP-only forums, private Discord channel to discuss trades and strategies in real-time, customer support, trade alerts, and much more. Learn all about VIP membership here.
How can I access the premium indicators?
To access the premium indicators, which are plug and play ready, sign up for VIP membership here.
Back
Top