
The Author's states:
The 𝒮𝒸𝒶𝓁𝓅𝑒𝓇'𝓈 𝒱𝑜𝓁𝒶𝓉𝒾𝓁𝒾𝓉𝓎 𝐹𝒾𝓁𝓉𝑒𝓇 (𝒮𝒱𝐹) is a sophisticated technical indicator, designed to increase the profitability of lower timeframe trading.
Due to the inherent decrease in the signal-to-noise ratio when trading on lower timeframes, it is critical to develop analysis methods to inform traders of the optimal market periods to trade - and more importantly, when you shouldn’t trade.
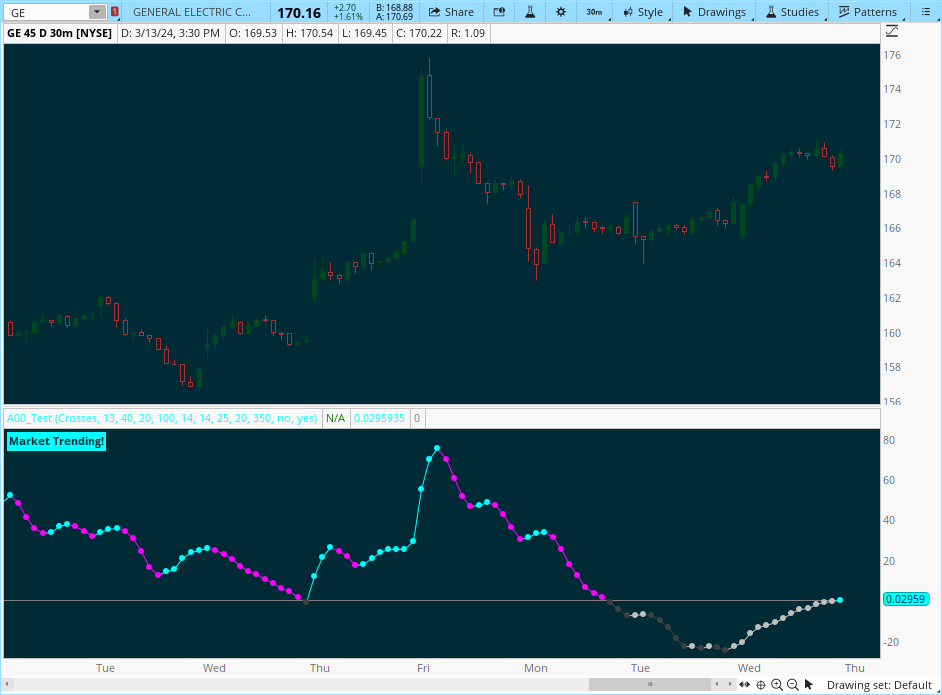
The 𝒮𝒱𝐹 uses a blend of volatility and momentum measurements, to signal the dominant market condition - trending or ranging.
The 𝒮𝒱𝐹 consists of a signal line that moves above and below a central zero line, serving as the indication of market regime.
https://www.tradingview.com/script/VpeVyX0N-Scalper-s-Volatility-Filter-QuantraAI/
The 𝒮𝒸𝒶𝓁𝓅𝑒𝓇'𝓈 𝒱𝑜𝓁𝒶𝓉𝒾𝓁𝒾𝓉𝓎 𝐹𝒾𝓁𝓉𝑒𝓇 (𝒮𝒱𝐹) is a sophisticated technical indicator, designed to increase the profitability of lower timeframe trading.
Due to the inherent decrease in the signal-to-noise ratio when trading on lower timeframes, it is critical to develop analysis methods to inform traders of the optimal market periods to trade - and more importantly, when you shouldn’t trade.
The 𝒮𝒱𝐹 uses a blend of volatility and momentum measurements, to signal the dominant market condition - trending or ranging.
The 𝒮𝒱𝐹 consists of a signal line that moves above and below a central zero line, serving as the indication of market regime.
- When the signal line is positioned above zero, it indicates a period of elevated volatility. These periods are more profitable for trading, as an asset will experience larger price swings, and by design, trend-following indicators will give less false signals.
- Conversely, when the signal line moves below zero, a low volatility or mean-reverting market regime dominates.
https://www.tradingview.com/script/VpeVyX0N-Scalper-s-Volatility-Filter-QuantraAI/
Last edited by a moderator: