#// Indicator forceIndex TOS
#// © QuantraAI
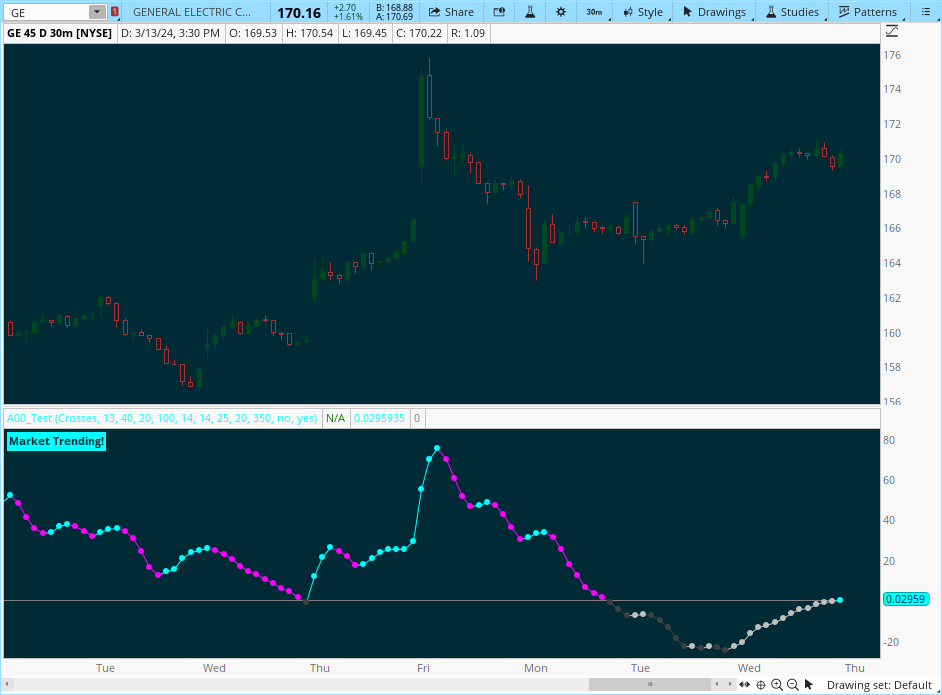
#indicator("Scalper's Volatility Filter", "SVF",
# Converted by Sam4Cok@Samer800 - 02/2024
# Updated by Sam4Cok@Samer800 - 07/2024 - Added MTF
declare lower;
input useChartTimeframe = {default "Yes", "No"};
input manualTimeframe = AggregationPeriod.FIFTEEN_MIN;
input displayType = {Default "Line", "Histogram", "Heikin-Ashi", "HA-Width"}; # "Display Type"
input Speed = 10; # "Speed"
input BaseAtrLength = 13; # "Base ATR Length"
input SecondAtrLength = 40; # "Second ATR Length"
input BaseStdDevLength = 20; # "Base StdDev"
input SecondStdDevLength = 100; # "Second StdDev"
input AdxSmoothingLength = 14; # "ADX Smoothing"
input adxThreshold = 25; # "ADX Baseline"
input diLength = 14; # "DI Length"
input RegressionLength = 20; # "Regression Length"
input RegressionSensitivity = 350; # "Regression Sensitivity"
input HistoricalVolatilityLookback = 50; # "Historical Volatility Lookback"
input colorBars = no; # "Bar Coloring"
input HollowCandles = yes; # "Hollow Candles"
input CompressedMode = no; # "Compressed Mode"
input showLabel = yes; # "Labels"
def na = Double.NaN;
def last = IsNaN(close);
#-- MTF
def cl; def hi; def lo;
Switch (useChartTimeframe) {
case "No" :
cl = close(Period=manualTimeframe);
hi = high(Period=manualTimeframe);
lo = low(Period=manualTimeframe);
Default :
cl = close;
hi = high;
lo = low;
}
#// Functions //
#// Modified Damiani Voltemter // Credit to @xinolia
script DV {
input src = close;
input vis_atr = 13;
input vis_std = 20;
input sed_atr = 40;
input sed_std = 100;
input h = high;
input c = close;
input l = low;
def tr = TrueRange(h, c, l);
def lag_s_K = 0.5;
def vol;
def visAtr = WildersAverage(tr, vis_atr);
def sedAtr = WildersAverage(tr, sed_atr);
def visStd = StDev(src, vis_std);
def sedStd = StDev(src, sed_std);
def anti_thres = visStd / sedStd;
def t1 = 1.4 - anti_thres;
def s1 = CompoundValue(1, vol[1], 0);
def s3 = CompoundValue(1, vol[3], 0);
vol = CompoundValue(1, visAtr / sedAtr + lag_s_K * (s1 - s3), t1);
def th = t1 - vol;
def DV = -th * 100;
plot out = if IsNaN(DV) then 0 else DV;
}
#// Average Directional Index
script nADX {
input dilen = 14;
input adxlen = 14;
input h = high;
input c = close;
input l = low;
def tr = TrueRange(h, c, l);
def hiDiff = h - h[1];
def loDiff = l[1] - l;
def plusDM = if hiDiff > loDiff and hiDiff > 0 then hiDiff else 0;
def minusDM = if loDiff > hiDiff and loDiff > 0 then loDiff else 0;
def ATR = WildersAverage(tr, dilen);
def "DI+" = 100 * WildersAverage(plusDM, dilen) / ATR;
def "DI-" = 100 * WildersAverage(minusDM, dilen) / ATR;
def DX = if ("DI+" + "DI-" > 0) then 100 * AbsValue("DI+" - "DI-") / ("DI+" + "DI-") else 0;
def nADX = WildersAverage(DX, adxlen);
plot out = nADX;
}
#// Linear Regression Dispersion
script dispersion {
input src = close;
input period = 20;
input TrSens = 350;
def linRegLine = Inertia(src, period);
def tes = StDev(src - linRegLine, period);
def median = Median(tes, TrSens);
def dispersion = (tes - median) / 2;
plot out = dispersion;
}
Script normalize {
input currentValue = close;
input targetMin = -100;
input targetMax = 100;
input window = 100;
def targetDiff = (targetMax - targetMin);
def dynCurrentVal = CompoundValue(1, currentValue, 0);
def minValue = lowest(dynCurrentVal, window);
def maxValue = highest(dynCurrentVal, window);
def minNew = min(dynCurrentVal, minValue);
def maxNew = max(dynCurrentVal, maxValue);
def newDiff = (maxNew - minNew);
def scale = targetMin + targetDiff * (dynCurrentVal - minNew) / newDiff;
def norm = if minValue!= maxValue then scale else dynCurrentVal;
plot out = if isNaN(norm) then 0 else norm;
}
#// ║ CALCULATE RAW VALUES ║ //
def dvmR = DV(cl , BaseAtrLength, BaseStdDevLength, SecondAtrLength, SecondStdDevLength, hi, cl, lo);
def sigR = (nADX(diLength, AdxSmoothingLength, hi, cl, lo) - adxThreshold) * 3;
def disR = dispersion(cl, RegressionLength, RegressionSensitivity);
#// ║ PREPROCESSING BY NORMALIZATION ║ //
def dvm = normalize(dvmR, -100, 100, Speed * 10);
def sig = normalize(sigR, -100, 100, Speed * 10);
def dis = normalize(disR, -100, 100, Speed * 10);
#// ║ CUSTOM 'MEAN' FUNCTION ║ //
def sumDVM = if !isNaN(dvm) then dvm else 0;
def sumSIG = if !isNaN(sig) then sig else 0;
def sumDIS = if !isNaN(dis) then dis else 0;
def cntDVM = if !isNaN(dvm) then 1 else 0;
def cntSIG = if !isNaN(sig) then 1 else 0;
def cntDIS = if !isNaN(dis) then 1 else 0;
def sum = sumDVM + sumSIG + sumDIS;
def cnt = cntDVM + cntSIG + cntDIS;
def av = if last then na else if cnt > 0 then sum / cnt else 0;
#// Function to calculate Heikin Ashi values
def o = if isNaN(av[1]) then av else av[1];
def h = Max(av, av[1]);
def l = Min(av, av[1]);
def c = av;
def xc = (o + h + l + c) / 4;
def xo = CompoundValue(1, if !xo[1] then (o + c) / 2 else (xo[1] + xc[1]) / 2, (o + c) / 2);
def xh = max(h, max(xo, xc));
def xl = min(l, min(xo, xc));
def hac = xc;
def hao = xo;
def hah = xh;
def hal = xl;
#// ║ HA WIDTH ║ //
def volatility = AbsValue(hac - hao);
def Hisotrical_Volatility = Average(volatility, HistoricalVolatilityLookback);
def col; def disp;
Switch (displayType) {
Case "Histogram" :
col = if av > 0 then if av > av[1] then 2 else 1 else
if av < 0 then if av < av[1] then -1 else -2 else 0;
disp = if last then na else 2;
Case "Heikin-Ashi" :
col = if hac > hao then 2 else 1;
disp = if last then na else 3;
Case "HA-Width" :
col = if volatility < Hisotrical_Volatility then -2 else
if hac > hao then 2 else 1;
disp = if last then na else 4;
Default :
col = if av > 0 then if av > av[1] then 2 else 1 else
if av < 0 then if av < av[1] then -1 else -2 else 0;
disp = if last then na else 1;
}
# Heikin Ashi Style
def up = !CompressedMode and disp==3 and col==2;
def dn = !CompressedMode and disp==3 and col==1;
def upO = if HollowCandles then hao else hac;
def upC = if HollowCandles then hac else hao;
def dnO = if HollowCandles then hac else hao;
def dnC = if HollowCandles then hao else hac;
# -- Display
plot CompressedLine = if CompressedMode and !last then 0 else na;
plot pavHist = if !CompressedMode and disp==2 then av else na; # "Average Volatility Hist"
plot pavLine = if !CompressedMode and disp==1 then av else na; # "Average Volatility Cross"
plot pavAvgHa = if !CompressedMode and disp==4 then Hisotrical_Volatility else na; # "Average HA Volatility
plot pavWidth = if !CompressedMode and disp==4 then volatility else na; # "HA Volatility Width"
plot zeroLine = if !CompressedMode and !last then 0 else na; # "Zero Line"
zeroLine.SetDefaultColor(Color.GRAY);
CompressedLine.SetLineWeight(5);
CompressedLine.SetPaintingStrategy(PaintingStrategy.SQUARES);
CompressedLine.AssignValueColor(if col== 2 then Color.CYAN else
if col== 1 then Color.MAGENTA else
if col==-2 then Color.DARK_GRAY else Color.LIGHT_GRAY);
pavHist.SetPaintingStrategy(PaintingStrategy.SQUARED_HISTOGRAM);
pavHist.AssignValueColor(if col== 2 then Color.CYAN else
if col== 1 then Color.MAGENTA else
if col==-2 then Color.DARK_GRAY else Color.LIGHT_GRAY);
pavLine.SetPaintingStrategy(PaintingStrategy.LINE_VS_POINTS);
pavLine.AssignValueColor(if col== 2 then Color.CYAN else
if col== 1 then Color.MAGENTA else
if col==-2 then Color.DARK_GRAY else Color.LIGHT_GRAY);
pavWidth.SetPaintingStrategy(PaintingStrategy.SQUARED_HISTOGRAM);
pavWidth.AssignValueColor(if col== 2 then Color.CYAN else
if col== 1 then Color.MAGENTA else
if col==-2 then Color.DARK_GRAY else Color.LIGHT_GRAY);
pavAvgHa.SetDefaultColor(Color.ORANGE);
pavAvgHa.SetLineWeight(2);
# Heikin Ashi Candles
AddChart(open = if up then upO else na, high = if up then hah else na , low = hal , close = upC,
type = ChartType.CANDLE, growcolor = Color.CYAN);
AddChart(open = if dn then dnO else na, high = if dn then hah else na , low = hal , close = dnC,
type = ChartType.CANDLE, growcolor = Color.MAGENTA);
#-- bar color
AssignPriceColor(if !colorBars then Color.CURRENT else
if col== 2 then Color.CYAN else
if col== 1 then Color.MAGENTA else
if col==-2 then Color.DARK_GRAY else Color.LIGHT_GRAY);
#-- Label
#// Output Stream (For Quantra's Trading Station)
AddLabel(showLabel and col == 2, "Volatility Up!", Color.CYAN);
AddLabel(showLabel and col == 1, "Volatility Dn!", Color.MAGENTA);
AddLabel(showLabel and col <= 0, "No Volatility!", if col < 1 then Color.DARK_GRAY else Color.LIGHT_GRAY);
#-- END of CODE