Relative Volatility Measure (RVM) For ThinkOrSwim

ddemann

New member
VIP
Author states:
The Relative Volatility Measure (RVM) is an innovative trading indicator developed for TradingView. It offers traders a detailed perspective on market volatility, effectively combining short-term and long-term volatility signals. By scaling the volatility on a 0-100 range, the RVM provides an easily interpretable and actionable measure of market volatility, tailored to both short-term and long-term trading strategies.

Key Features:

Integrated Volatility Analysis: The RVM blends short-term (3, 5, 8 days) and long-term (55, 89, 144 days) Average True Range (ATR) readings to deliver a comprehensive view of market volatility.
Customizable Lookback Period: Traders can set their preferred lookback period, allowing the RVM to be adapted to different trading approaches and market conditions.
Scaled Volatility Index: The RVM normalizes the volatility data, displaying it on a scale from 0 to 100. A score of 100 indicates the peak volatility within the selected timeframe, while a score of 0 shows the least volatility.
Visual Tools for Analysis: The indicator includes horizontal reference lines at significant levels (50, 20, and 10) and offers the option to highlight specific volatility ranges (0-10 and 10-20) with background coloring for easy identification.
Dynamic RVM Value Display: A real-time label showing the current RVM value is strategically positioned for quick viewing and decision-making.
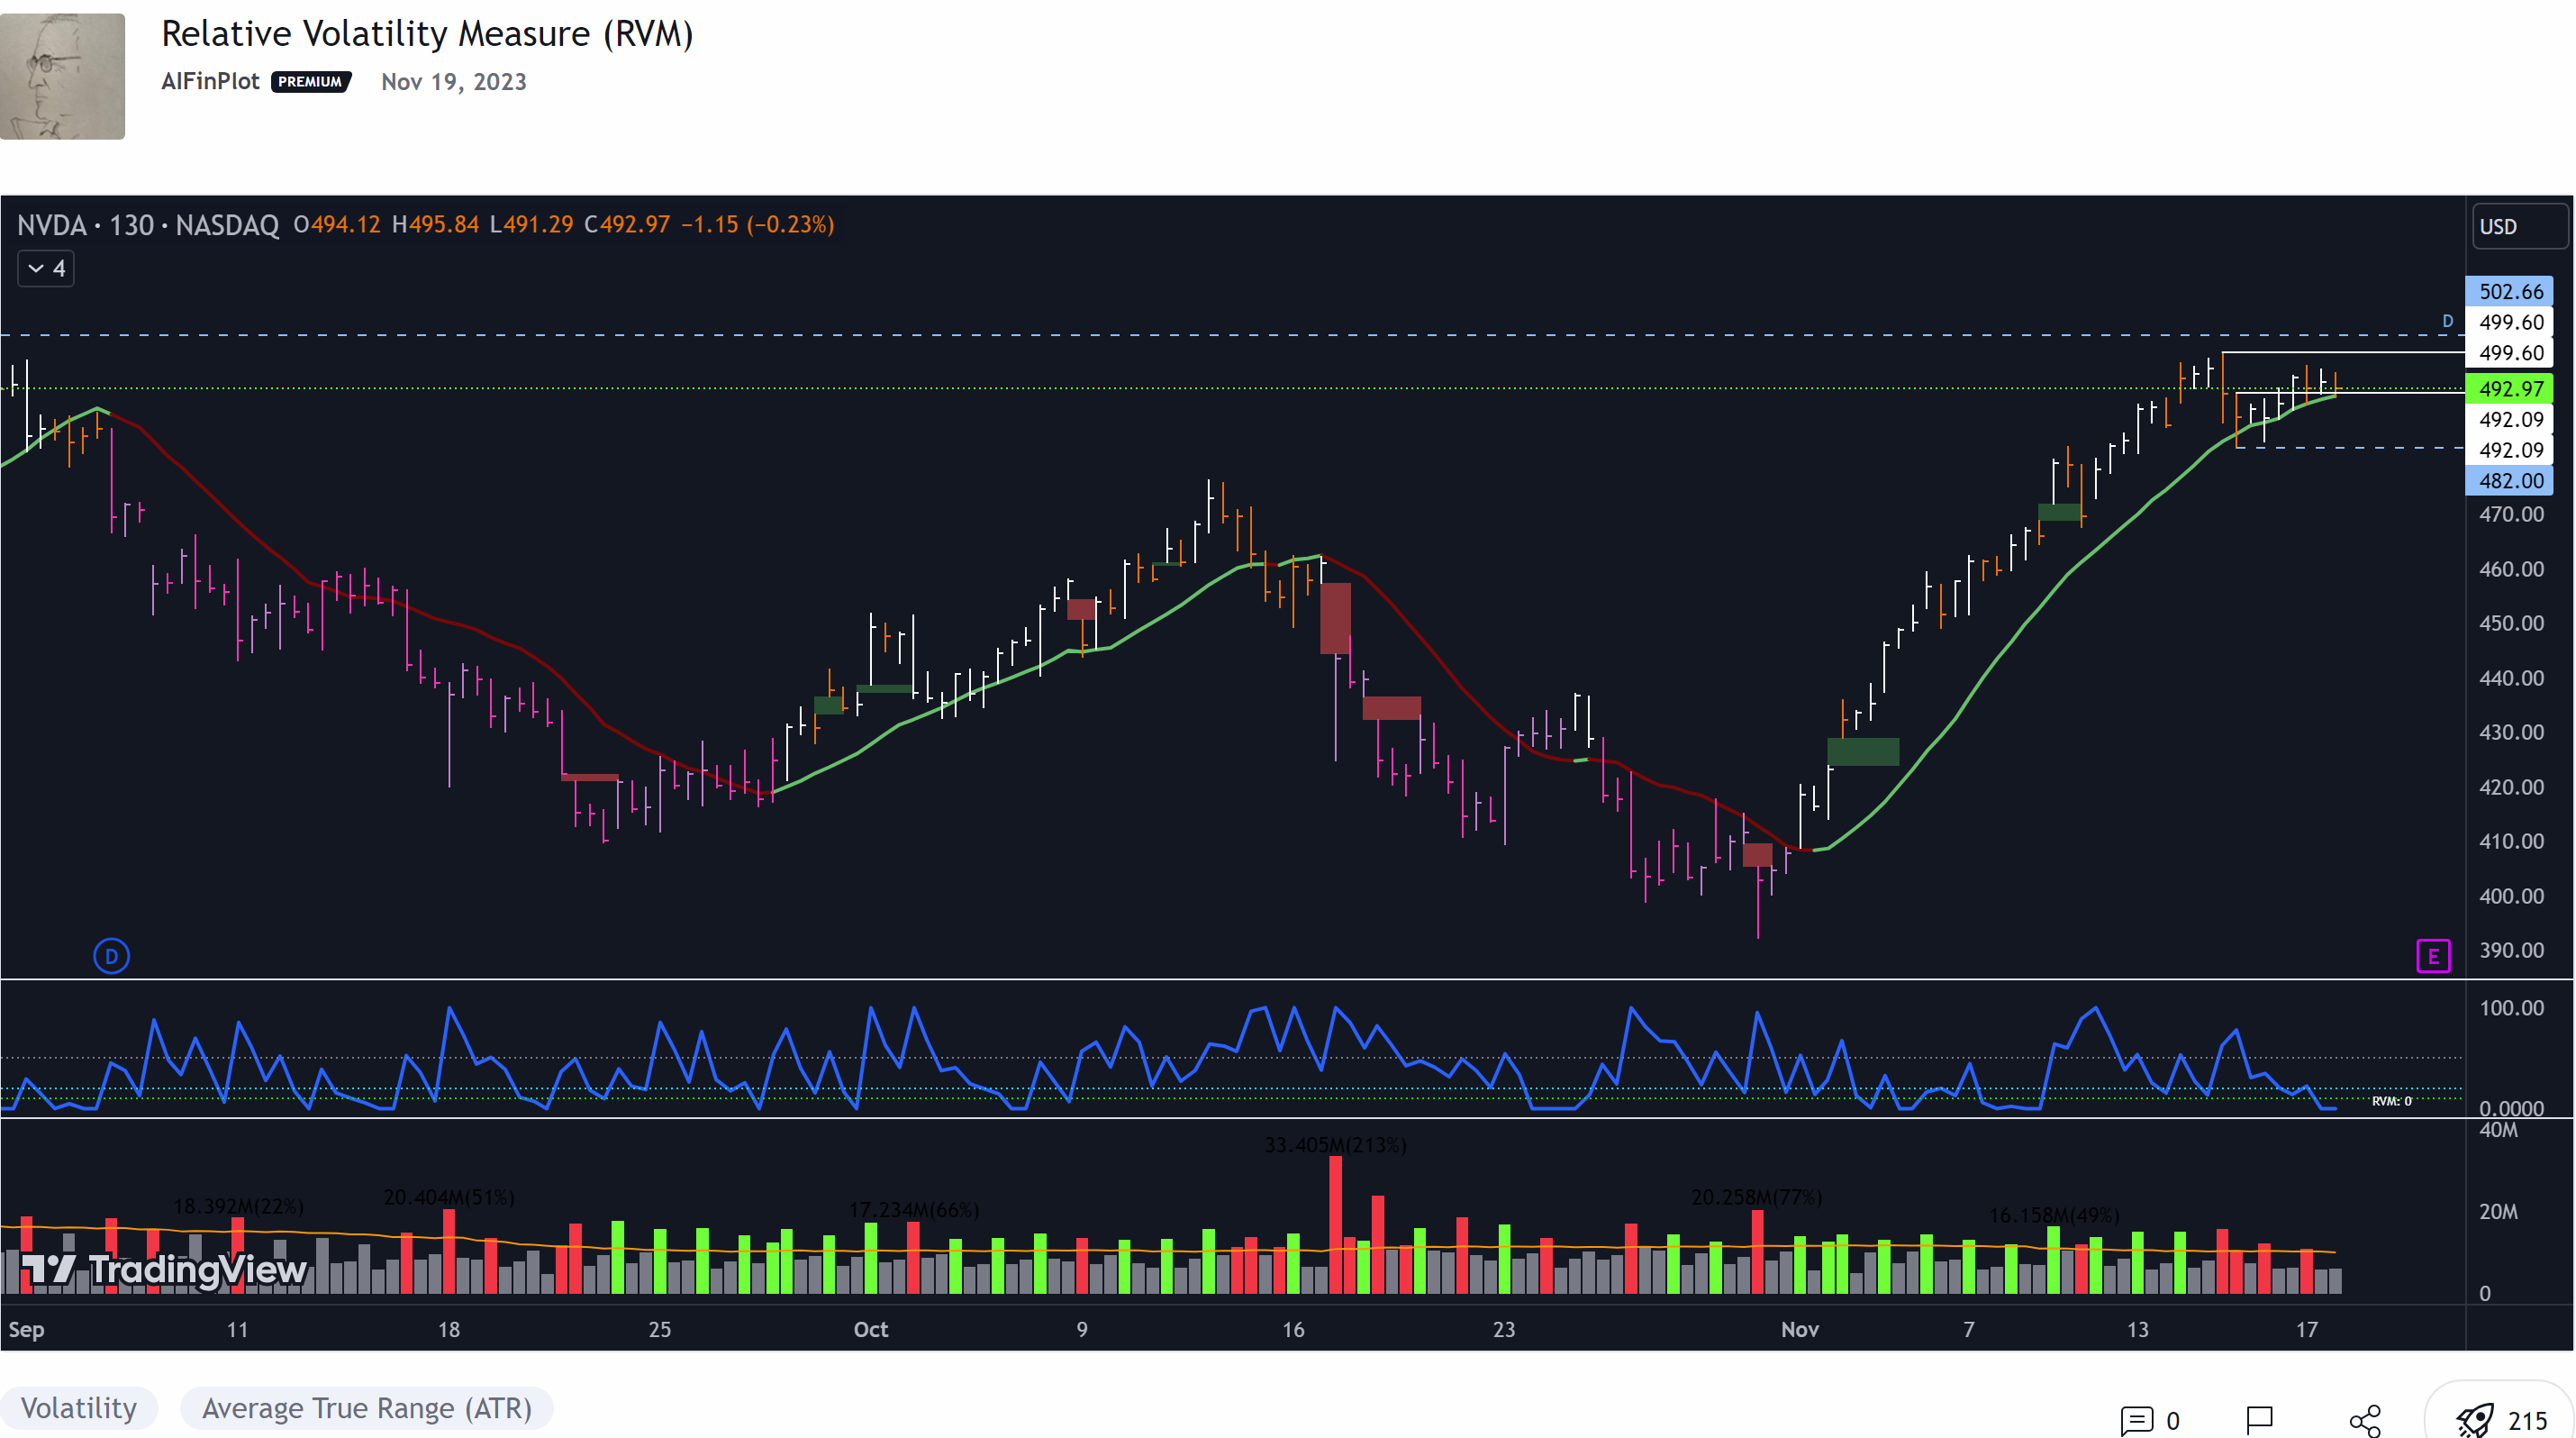
4UvY48G.png


I ran across what I believe is a ver useful indicator that helps visually identify areas of tight consolidation and low price volatility which often come right before bigger price movements. Something like the squeeze but much more flexible. Here is the TradingView Pine Script. I would love some help converting it to Thinkscript.

https://www.tradingview.com/script/Ae9cNmI4-Relative-Volatility-Measure-RVM/
 
Last edited by a moderator:

Join useThinkScript to post your question to a community of 21,000+ developers and traders.

I ran across what I believe is a ver useful indicator that helps visually identify areas of tight consolidation and low price volatility which often come right before bigger price movements. Something like the squeeze but much more flexible. Here is the TradingView Pine Script. I would love some help converting it to Thinkscript.

https://www.tradingview.com/script/Ae9cNmI4-Relative-Volatility-Measure-RVM/


indicator("Relative Volatility Measure (RVM)", shorttitle="RVM")
// Inputs
lookbackPeriod = input.int(15, minval=1, title="Lookback Period")
showBgColor = input.bool(true, title="Show Background Color")

// Short-term ATRs
short1 = ta.atr(3)
short2 = ta.atr(5)
short3 = ta.atr(8)
shortAvg = (short1 + short2 + short3) / 3
// Long-term ATRs
long1 = ta.atr(55)
long2 = ta.atr(89)
long3 = ta.atr(144)
longAvg = (long1 + long2 + long3) / 3
// Combined ATR value
combinedATR = (shortAvg + longAvg) / 2
// Highest and lowest combined ATR over lookback period
highestCombinedATR = ta.highest(combinedATR, lookbackPeriod)
lowestCombinedATR = ta.lowest(combinedATR, lookbackPeriod)
// RVM Calculation
rvm = (combinedATR - lowestCombinedATR) / math.max(highestCombinedATR - lowestCombinedATR, 0.001) * 100
// Plotting
plot(rvm, title="RVM", color=color.blue, linewidth=2)
hline(50, "Midpoint", color=color.gray, linestyle=hline.style_dotted)
hline(20, "Midpoint", color=color.rgb(37, 214, 238), linestyle=hline.style_dotted)
hline(10, "Midpoint", color=color.rgb(21, 216, 34), linestyle=hline.style_dotted)

// Background color conditions
bgcolor(showBgColor and rvm >= 0 and rvm <= 10 ? color.rgb(21, 216, 34) : na)
bgcolor(showBgColor and rvm > 10 and rvm <= 20 ? color.rgb(37, 214, 238) : na)
// Label Logic
var label myLabel = na
if barstate.islast
myLabel := label.new(bar_index + 4, rvm, text="RVM: " + str.tostring(rvm, '#.##'), style=label.style_none, color=color.blue, textcolor=color.white, size=size.tiny, yloc=yloc.price)
// Update the label position and text on each bar
if not na(myLabel)
label.set_xy(myLabel, bar_index + 4, rvm)
label.set_text(myLabel, "RVM: " + str.tostring(rvm, '#.##'))


This is what I have so far....


# Relative Volatility Measure (RVM)
declare lower;

# Inputs
input lookbackPeriod = 15;
input showBgColor = yes;

# Short-term ATRs
def short1 = MovingAverage(AverageType.SIMPLE, TrueRange(high, close, low), 3);
def short2 = MovingAverage(AverageType.SIMPLE, TrueRange(high, close, low), 5);
def short3 = MovingAverage(AverageType.SIMPLE, TrueRange(high, close, low), 8);
def shortAvg = (short1 + short2 + short3) / 3;

# Long-term ATRs
def long1 = MovingAverage(AverageType.SIMPLE, TrueRange(high, close, low), 55);
def long2 = MovingAverage(AverageType.SIMPLE, TrueRange(high, close, low), 89);
def long3 = MovingAverage(AverageType.SIMPLE, TrueRange(high, close, low), 144);
def longAvg = (long1 + long2 + long3) / 3;

# Combined ATR value
def combinedATR = (shortAvg + longAvg) / 2;

# Highest and lowest combined ATR over lookback period
def highestCombinedATR = Highest(combinedATR, lookbackPeriod);
def lowestCombinedATR = Lowest(combinedATR, lookbackPeriod);

# RVM Calculation
def rvm = ((combinedATR - lowestCombinedATR) / Max(highestCombinedATR - lowestCombinedATR, 0.001)) * 100;

# Plotting
plot RVM = rvm;
RVM.AssignValueColor(if RVM >= 0 and RVM <= 10 then Color.GREEN else if RVM > 10 and RVM <= 20 then Color.CYAN else Color.BLUE);
RVM.SetLineWeight(2);

# Background color conditions
AddChartBubble(showBgColor and RVM >= 0 and RVM <= 10, low, "RVM: " + Round(rvm, 2), Color.GREEN, yes);
AddChartBubble(showBgColor and RVM > 10 and RVM <= 20, low, "RVM: " + Round(rvm, 2), Color.CYAN, yes);
find below:

CSS:
#// This source code is subject to the terms of the Mozilla Public License 2.0 at https://mozilla.org/MPL/2.0/
#// © AIFinPlot
#indicator("Relative Volatility Measure (RVM)", shorttitle="RVM")
# Converted by Sam4Cok@Samer800    - 02/2024
Declare lower;

input lookbackPeriod = 15; #, minval=1, title="Lookback Period")
input smootheing = no;
input smoothingLength = 3;
input showLabel = yes;
input ShowBackgroundColor = yes; #(true, title="Show Background Color")

def na = Double.NaN;
def pos = Double.POSITIVE_INFINITY;
def neg = Double.NEGATIVE_INFINITY;
def last = isNaN(close);

#// Short-term ATRs
def short1    = atr(Length = 3);
def short2    = atr(Length = 5);
def short3    = atr(Length = 8);
def shortAvg  = (short1 + short2 + short3) / 3;

#// Long-term ATRs
def long1   = atr(Length = 55);
def long2   = atr(Length = 89);
def long3   = atr(Length = 144);
def longAvg = (long1 + long2 + long3) / 3;

#// Combined ATR value
def combinedATR = (shortAvg + longAvg) / 2;

#// Highest and lowest combined ATR over lookback period
def highestCombinedATR = highest(combinedATR, lookbackPeriod);
def lowestCombinedATR = lowest(combinedATR, lookbackPeriod);

#// RVM Calculation
def maxx = MAX(highestCombinedATR - lowestCombinedATR, 0.0001);
def normRVM = (combinedATR - lowestCombinedATR) / maxx * 100;
def smoothRVM = WildersSmoothing(normRVM, smoothingLength);
def RVM =  if smootheing then smoothRVM else normRVM;
def col = if RVM >= 90 then 255 else
          if RVM <= 10 then 25 else RVM * 2.55;

AddLabel(showLabel,"RVM(" + ROUnd(RVM, 2) + "%)", CreateColor(col,255- col,255- col));
#// Plotting
plot rvmLine = RVM; #, title="RVM", color=color.blue, linewidth=2)
plot hline1 = if last then na else 50; #, "Midpoint", color=color.gray, linestyle=hline.style_dotted)
plot hline2 = if last then na else 20; #, "Midpoint", color=color.rgb(37, 214, 238), linestyle=hline.style_dotted)
plot hline3 = if last then na else 10; #, "Midpoint", color=color.rgb(21, 216, 34), linestyle=hline.style_dotted)

rvmLine.SetLineWeight(2);
rvmLine.AssignValueColor(CreateColor(col,255- col,255- col));
hline1.SetPaintingStrategy(PaintingStrategy.DASHES);
hline2.SetPaintingStrategy(PaintingStrategy.DASHES);
hline3.SetPaintingStrategy(PaintingStrategy.DASHES);
hline1.SetDefaultColor(Color.DARK_RED);
hline2.SetDefaultColor(Color.VIOLET);
hline3.SetDefaultColor(Color.GREEN);

#-- Extend Line
def extend = if !last then RVM else extend[1];

plot extendLine = if extend[3] and (last and !last[3]) then extend else na;
extendLine.SetLineWeight(2);
extendLine.AssignValueColor(CreateColor(col[3],255- col[3],255- col[3]));

AddCloud(if !last[3] and last then 101 else na, 50, Color.DARK_RED);
AddCloud(if !last[3] and last then 50 else na, 20, Color.VIOLET);
AddCloud(if !last[3] and last then 20 else na, -1, Color.DARK_GREEN);

#// Background color conditions
def lvl2 = rvm > 10 and rvm <= 20;
def lvl3 = rvm <= 10;

AddCloud(if ShowBackgroundColor and (lvl2 or lvl2[1])then pos else na, neg, Color.VIOLET);
AddCloud(if ShowBackgroundColor and (lvl3 or lvl3[1]) then pos else na, neg, Color.DARK_GREEN);

#-- END of CODE
 
Hello everyone! Would you guys mind sharing a way that we can scan for stocks in a consolidation period according to that indicator? Thank you in advance.
 

Similar threads

Not the exact question you're looking for?

Start a new thread and receive assistance from our community.

87k+ Posts
402 Online
Create Post

Similar threads

Similar threads

The Market Trading Game Changer

Join 2,500+ subscribers inside the useThinkScript VIP Membership Club
  • Exclusive indicators
  • Proven strategies & setups
  • Private Discord community
  • ‘Buy The Dip’ signal alerts
  • Exclusive members-only content
  • Add-ons and resources
  • 1 full year of unlimited support

Frequently Asked Questions

What is useThinkScript?

useThinkScript is the #1 community of stock market investors using indicators and other tools to power their trading strategies. Traders of all skill levels use our forums to learn about scripting and indicators, help each other, and discover new ways to gain an edge in the markets.

How do I get started?

We get it. Our forum can be intimidating, if not overwhelming. With thousands of topics, tens of thousands of posts, our community has created an incredibly deep knowledge base for stock traders. No one can ever exhaust every resource provided on our site.

If you are new, or just looking for guidance, here are some helpful links to get you started.

What are the benefits of VIP Membership?
VIP members get exclusive access to these proven and tested premium indicators: Buy the Dip, Advanced Market Moves 2.0, Take Profit, and Volatility Trading Range. In addition, VIP members get access to over 50 VIP-only custom indicators, add-ons, and strategies, private VIP-only forums, private Discord channel to discuss trades and strategies in real-time, customer support, trade alerts, and much more. Learn all about VIP membership here.
How can I access the premium indicators?
To access the premium indicators, which are plug and play ready, sign up for VIP membership here.
Back
Top