
Author states:
The Relative Volatility Measure (RVM) is an innovative trading indicator developed for TradingView. It offers traders a detailed perspective on market volatility, effectively combining short-term and long-term volatility signals. By scaling the volatility on a 0-100 range, the RVM provides an easily interpretable and actionable measure of market volatility, tailored to both short-term and long-term trading strategies.
Key Features:
Integrated Volatility Analysis: The RVM blends short-term (3, 5, 8 days) and long-term (55, 89, 144 days) Average True Range (ATR) readings to deliver a comprehensive view of market volatility.
Customizable Lookback Period: Traders can set their preferred lookback period, allowing the RVM to be adapted to different trading approaches and market conditions.
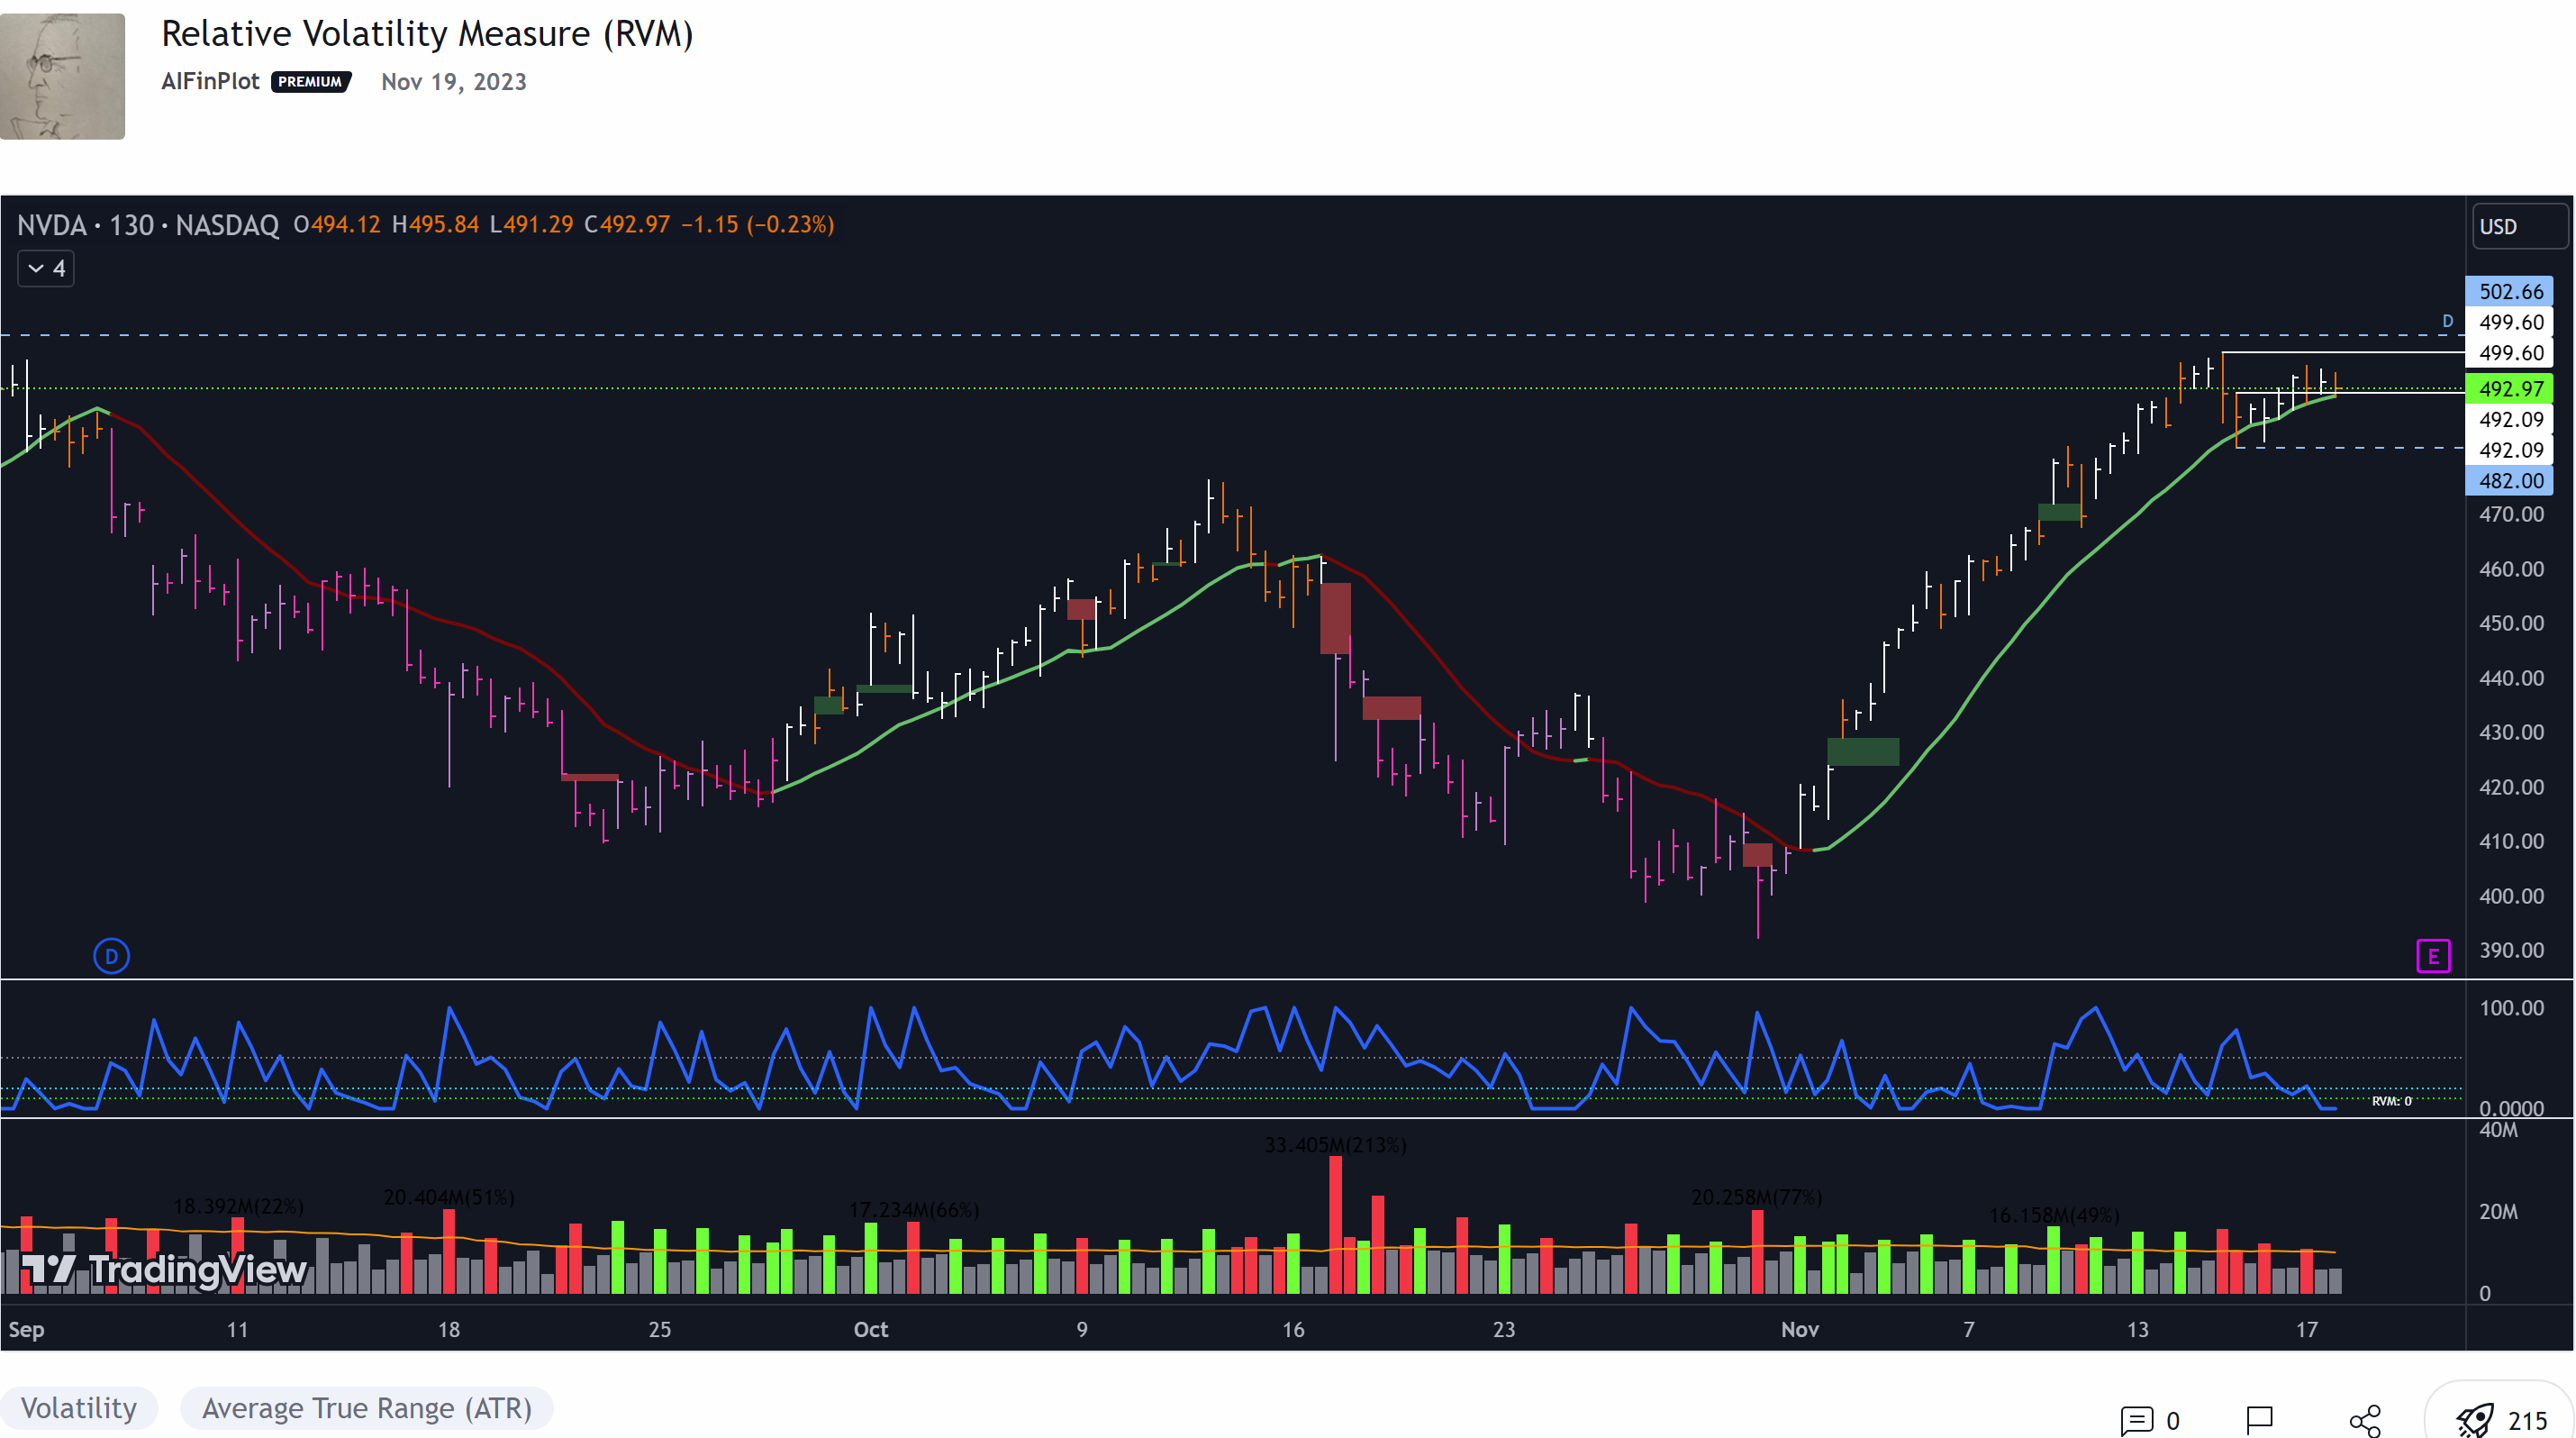
Scaled Volatility Index: The RVM normalizes the volatility data, displaying it on a scale from 0 to 100. A score of 100 indicates the peak volatility within the selected timeframe, while a score of 0 shows the least volatility.
Visual Tools for Analysis: The indicator includes horizontal reference lines at significant levels (50, 20, and 10) and offers the option to highlight specific volatility ranges (0-10 and 10-20) with background coloring for easy identification.
Dynamic RVM Value Display: A real-time label showing the current RVM value is strategically positioned for quick viewing and decision-making.
I ran across what I believe is a ver useful indicator that helps visually identify areas of tight consolidation and low price volatility which often come right before bigger price movements. Something like the squeeze but much more flexible. Here is the TradingView Pine Script. I would love some help converting it to Thinkscript.
https://www.tradingview.com/script/Ae9cNmI4-Relative-Volatility-Measure-RVM/
The Relative Volatility Measure (RVM) is an innovative trading indicator developed for TradingView. It offers traders a detailed perspective on market volatility, effectively combining short-term and long-term volatility signals. By scaling the volatility on a 0-100 range, the RVM provides an easily interpretable and actionable measure of market volatility, tailored to both short-term and long-term trading strategies.
Key Features:
Integrated Volatility Analysis: The RVM blends short-term (3, 5, 8 days) and long-term (55, 89, 144 days) Average True Range (ATR) readings to deliver a comprehensive view of market volatility.
Customizable Lookback Period: Traders can set their preferred lookback period, allowing the RVM to be adapted to different trading approaches and market conditions.
Scaled Volatility Index: The RVM normalizes the volatility data, displaying it on a scale from 0 to 100. A score of 100 indicates the peak volatility within the selected timeframe, while a score of 0 shows the least volatility.
Visual Tools for Analysis: The indicator includes horizontal reference lines at significant levels (50, 20, and 10) and offers the option to highlight specific volatility ranges (0-10 and 10-20) with background coloring for easy identification.
Dynamic RVM Value Display: A real-time label showing the current RVM value is strategically positioned for quick viewing and decision-making.
I ran across what I believe is a ver useful indicator that helps visually identify areas of tight consolidation and low price volatility which often come right before bigger price movements. Something like the squeeze but much more flexible. Here is the TradingView Pine Script. I would love some help converting it to Thinkscript.
https://www.tradingview.com/script/Ae9cNmI4-Relative-Volatility-Measure-RVM/
Last edited by a moderator: