
Author Message:
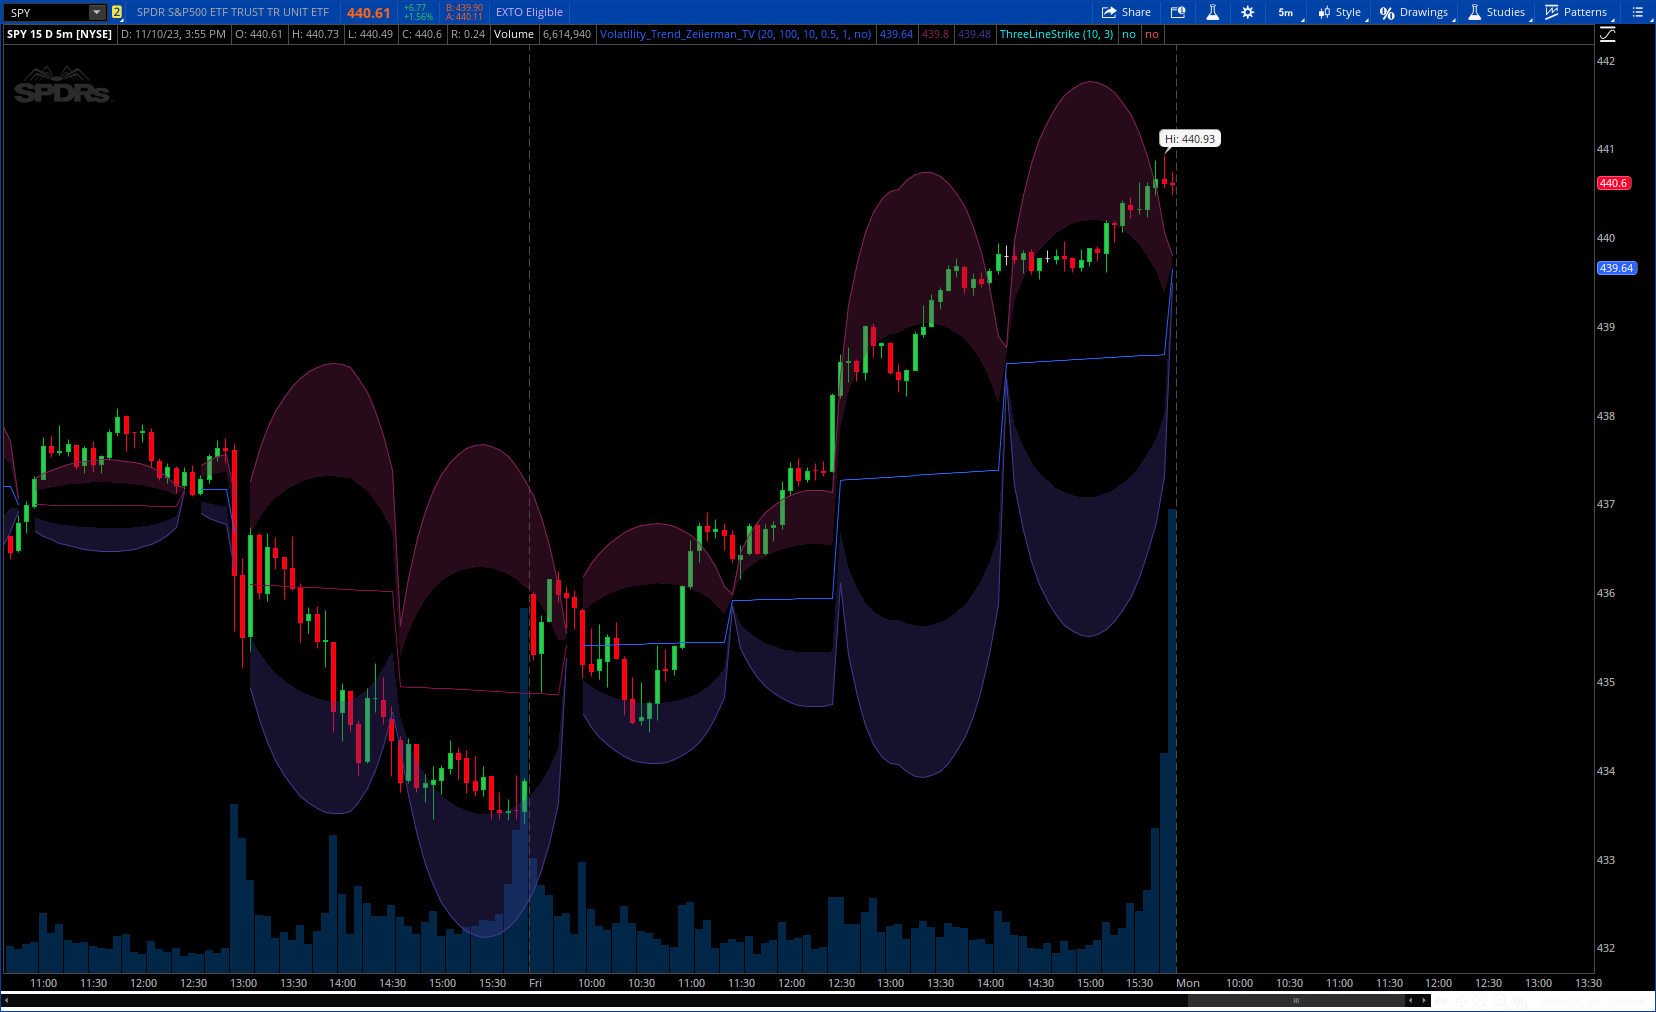
The Volatility Trend (Zeiierman) is an indicator designed to help traders identify and analyze market trends based on price volatility. By calculating a dynamic trend line and volatility-adjusted bands, the indicator provides visual cues to understand the current market direction, potential reversal points and volatility.
More Details : https://www.tradingview.com/v/ZrEdJ42P/
CODE:
CSS:
# https://www.tradingview.com/v/ZrEdJ42P/
#// This work is licensed under a Attribution-NonCommercial-ShareAlike 4.0
#indicator("Volatility Trend (Zeiierman)", overlay = true)
# Converted by Sam4Cok@Samer800    - 11/2023

input trendLength        = 20;      # "Trend Control"
input trendDynamicLength = 100;     # "Trend Dynamic"
input volatilityControl  = 10;      # "Volatility"
input volatilitySensitivity  = 0.5;  # "Sensitivity"
input squeezeControl         = 1;    # "Squeeze Control"
input ScalpingMode         = no;     # "Enable Scalping Trend (For BTC)"

def na = Double.NaN;

DefineGlobalColor("Up", CreateColor(41, 98, 255));
DefineGlobalColor("Dn", CreateColor(136, 14, 79));
DefineGlobalColor("dup", CreateColor(73, 56, 147));
DefineGlobalColor("ddn", CreateColor(134, 36, 88));

#trendDirectionFunction(dir) =>
script trendDirectionFunction {
    input trendir = close;
    def diff = trendir - trendir[1];
    def dir = if diff > 0 then 1 else
             (if diff < 0 then -1 else 0);
    plot out = dir;
}
#// Function to calculate standard deviation
script stddev_function {
    input src_ = close;
    input p = 20;
    input squeezeControl = 1;
    input shorttermtrend = yes;
    def bar_index = BarNumber();
    def mean = Average(src_, p);
    def sum_diff_sq;
    if bar_index < p {
        sum_diff_sq = 0.0;
    } else {
        sum_diff_sq = fold i = 0 to p with q do
                      q + Power(src_[i] - mean, 2);
    }
    def stdev = if shorttermtrend then Sqrt(sum_diff_sq / close * p * squeezeControl) else
                                       Sqrt(sum_diff_sq / p * squeezeControl);
    plot out = stdev;
}
#/ Var
def trend;
#// Call Trend Direction
def trendDirection = trendDirectionFunction(trend[1]);
#// Call Scaled StdDev
def scaledStdDev = stddev_function(trend[1], trendLength, squeezeControl, ScalpingMode) * volatilityControl;
def priceTrend   = AbsValue(close - trend[1]);

#// Calculate the Trend
def trendAdjustment = if priceTrend > scaledStdDev then (close + trend[1]) / 2 else
                 trendDirection * (scaledStdDev * (1 / volatilityControl) * (1 / trendDynamicLength)) + trend[1];
trend = trendAdjustment;

#// Get Upper and Lower Bands
def upper = trend + (volatilitySensitivity * scaledStdDev);
def lower = trend - (volatilitySensitivity * scaledStdDev);

#/Plot
def col = trendDirection == 1;
def trueTrend = trendDirection == trendDirection[1];

plot trend_ = if trueTrend then trend else na;    # "Trend Line"
plot upper_ = if trueTrend then upper else na;    # "Upper Circle Line"
plot lower_ = if trueTrend then lower else na;    # "Lower Circle Line"

trend_.AssignValueColor(if col then GlobalColor("Up") else GlobalColor("Dn"));
upper_.AssignValueColor(if col then GlobalColor("dDn") else GlobalColor("dDn"));
lower_.AssignValueColor(if col then GlobalColor("dUp") else GlobalColor("dUp"));


def halfUp = upper_ - (upper_ - trend_) / 2;
def haldDn = trend_ - (trend_ - lower_) / 2;

AddCloud(upper,  halfUp,  GlobalColor("dDn"));
AddCloud(haldDn,  lower,  GlobalColor("dUp"));

# END OF CODE