# RSI-Laguerre Self Adjusting With Fractal Energy Gaussian Price Filter
# Mobius
# V01.12.2016
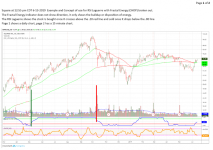
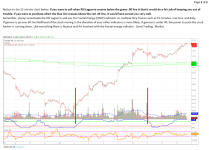
# Both Fractal Energy and RSI are plotted. RSI in cyan and FE in yellow. Look for trend exhaustion in the FE and a reversal of RSI or Price compression in FE and an RSI reversal.
declare lower;
#Inputs:
input nFE = 8;#hint nFE: length for Fractal Energy calculation.
input AlertOn = yes;
input Glength = 13;
input betaDev = 8;
input data = close;
def w = (2 * Double.Pi / Glength);
def beta = (1 - Cos(w)) / (Power(1.414, 2.0 / betaDev) - 1 );
def alpha = (-beta + Sqrt(beta * beta + 2 * beta));
def Go = Power(alpha, 4) * open +
4 * (1 – alpha) * Go[1] – 6 * Power( 1 - alpha, 2 ) * Go[2] +
4 * Power( 1 - alpha, 3 ) * Go[3] - Power( 1 - alpha, 4 ) * Go[4];
def Gh = Power(alpha, 4) * high +
4 * (1 – alpha) * Gh[1] – 6 * Power( 1 - alpha, 2 ) * Gh[2] +
4 * Power( 1 - alpha, 3 ) * Gh[3] - Power( 1 - alpha, 4 ) * Gh[4];
def Gl = Power(alpha, 4) * low +
4 * (1 – alpha) * Gl[1] – 6 * Power( 1 - alpha, 2 ) * Gl[2] +
4 * Power( 1 - alpha, 3 ) * Gl[3] - Power( 1 - alpha, 4 ) * Gl[4];
def Gc = Power(alpha, 4) * data +
4 * (1 – alpha) * Gc[1] – 6 * Power( 1 - alpha, 2 ) * Gc[2] +
4 * Power( 1 - alpha, 3 ) * Gc[3] - Power( 1 - alpha, 4 ) * Gc[4];
# Variables:
def o;
def h;
def l;
def c;
def CU1;
def CU2;
def CU;
def CD1;
def CD2;
def CD;
def L0;
def L1;
def L2;
def L3;
plot RSI;
plot OS;
plot OB;
#plot M;
# Calculations
o = (Go + Gc[1]) / 2;
h = Max(Gh, Gc[1]);
l = Min(Gl, Gc[1]);
c = (o + h + l + Gc) / 4;
plot gamma = Log(Sum((Max(Gh, Gc[1]) - Min(Gl, Gc[1])), nFE) /
(Highest(gh, nFE) - Lowest(Gl, nFE)))
/ Log(nFE);
gamma.SetDefaultColor(Color.BLUE);
gamma.SetLineWeight(1);
gamma.SetPaintingStrategy(PaintingStrategy.LINE_VS_POINTS);
L0 = (1 – gamma) * Gc + gamma * L0[1];
L1 = -gamma * L0 + L0[1] + gamma * L1[1];
L2 = -gamma * L1 + L1[1] + gamma * L2[1];
L3 = -gamma * L2 + L2[1] + gamma * L3[1];
if L0 >= L1
then {
CU1 = L0 - L1;
CD1 = 0;
} else {
CD1 = L1 - L0;
CU1 = 0;
}
if L1 >= L2
then {
CU2 = CU1 + L1 - L2;
CD2 = CD1;
} else {
CD2 = CD1 + L2 - L1;
CU2 = CU1;
}
if L2 >= L3
then {
CU = CU2 + L2 - L3;
CD = CD2;
} else {
CU = CU2;
CD = CD2 + L3 - L2;
}
RSI = if CU + CD <> 0 then CU / (CU + CD) else 0;
RSI.SetDefaultColor(Color.Cyan);
OS = if IsNaN(c) then Double.NaN else 0.2;
OS.SetDefaultColor(Color.Gray);
OS.HideBubble();
OS.HideTitle();
OB = if IsNaN(c) then Double.NaN else 0.8;
OB.SetDefaultColor(Color.Gray);
OB.HideBubble();
OB.HideTitle();
#M = if IsNaN(c) then Double.NaN else 0.5;
#M.SetStyle(Curve.Points);
#M.SetDefaultColor(Color.Gray);
#M.HideBubble();
#M.HideTitle();
plot FEh = if isNaN(c) then double.nan else .618;
FEh.SetStyle(Curve.Long_Dash);
FEh.HideBubble();
FEh.SetDefaultColor(Color.Dark_Gray);
FEh.HideTitle();
plot FEl = if isNaN(c) then double.nan else .382;
FEl.SetStyle(Curve.Long_Dash);
FEl.SetDefaultColor(Color.Dark_Gray);
FEl.HideBubble();
FEl.HideTitle();
AddCloud(0, OS, Color.GRAY, Color.GRAY);
AddCloud(OB, 1, Color.GRAY, Color.GRAY);
#Alert(AlertOn and RSI crosses below .9, "", Alert.BAR, Sound.Bell);
#Alert(AlertOn and RSI crosses above .1, "", Alert.BAR, Sound.Bell);
# End Code RSI_Laguerre Self Adjusting with Fractal Energy
# Trade Management
def ATR = Average(TrueRange(h,c,l), 20);
def longCond = if RSI crosses above .2
then c
else if RSI < .8
then double.nan
else longCond[1];
def shortCond = if RSI crosses below .8
then c
else if RSI > .2
then double.nan
else shortCond[1];
def upperTarget = if !isNaN(longCond) and ((RSI > RSI[1]) or (RSI > .8))
then Round((longCond + (1.5 * ATR)) / TickSize(), 0) * TickSize()
else if !isNaN(shortCond) or ((RSI < RSI[1]) or (RSI crosses below .2))
then double.nan
else upperTarget[1];
def upperBreached = if close crosses above upperTarget
then 1
else if close crosses below .5
then 0
else upperBreached[1];
def lowerTarget = if !isNaN(shortCond)
then Round((shortCond - (1.5 * ATR)) / TickSize(), 0) * TickSize()
else if !isNaN(longCond)
then double.nan
else lowerTarget[1];
def LTbreach = if close crosses below lowerTarget
then 1
else if RSI crosses above .5
then 0
else LTbreach[1];
#addLabel(upperTarget, if upperBreached
#then "Target Breached " + AsDollars(upperTarget)
#else "Target = " + AsDollars(Round(upperTarget, 2)), color.green);
#addLabel(lowerTarget, if LTbreach
#then "Target Breached " + AsDollars(LowerTarget)
# else "Target = " + AsDollars(Round(lowerTarget, 2)), color.red);
def FE_Consolidation = gamma > .62 and gamma[1] < .62;
#AddLabel(FE_Consolidation, " Fractal Energy Consolidation ", Color.YELLOW);
def FE_Exhaustion = gamma < .38 and gamma[1] > .38;
#AddLabel(FE_Exhaustion, " Fractal Energy Exhaustion ", Color.YELLOW);
AddChartBubble(FE_Consolidation, gamma, "C", COLOR.WHITE);
AddChartBubble(FE_Exhaustion, gamma, "E", COLOR.WHITE);
#Vertical Lines
def short = RSI crosses below .80;
def long = RSI crosses above .20;
AddVerticalLine(short, close, Color.RED, Curve.SHORT_DASH);
AddVerticalLine(long, close, Color.GREEN, Curve.SHORT_DASH);
RSI.DefineColor("Up", CreateColor( 0, 220, 0));
RSI.DefineColor("Down", Color.MAGENTA);
RSI.SetLineWeight(4);
RSI.AssignValueColor(if RSI > RSI[1] and RSI[1] > RSI [2] then RSI.Color("Up") else if RSI < RSI[1] and RSI[1] < RSI [2] then RSI.Color("Down") else color.YELLOW);
#Gamma Line Color
gamma.DefineColor("Con", CreateColor( 153, 153, 153));
gamma.DefineColor("EX", CreateColor( 153, 153, 153));
gamma.AssignValueColor(if gamma > .62 then gamma.Color("Con") else if gamma < .38 then gamma.Color("EX") else color.LIME);
AddCloud(gamma, .62, Color.GRAY, Color.Current);
AddCloud(gamma, .38, Color.Current, Color.GRAY);