RSI Format, Label, Watchlist, Scan For ThinkOrSwim

MerryDay

Administrative
Staff member
Staff
VIP
Lifetime
#Basic RSI Indicator With Arrows, Label, & Alerts
cCnrv0g.png

Shared Link: http://tos.mx/vYwKbJ5
Click here for --> Easiest way to load shared links
Ruby:
#Basic RSI Indicator w/ arrows, label, & alerts
input OB = 70;
input OS = 30;
input rsi_length = 14 ;
input showLabel = yes ;

def rsi = reference RSI("length" = 14)."RSI" ;

# ########################################
# charting & formatting

plot UpArrow = if  rsi crosses above OS  then low else double.NaN ;
UpArrow .SetPaintingStrategy(PaintingStrategy.ARROW_up);
UpArrow .SetLineWeight(1);
UpArrow .SetDefaultColor(color.blue) ;

plot DownArrow = if  rsi crosses below OB then high else double.NaN ;
DownArrow  .SetPaintingStrategy(PaintingStrategy.ARROW_down);
DownArrow  .SetLineWeight(1);
DownArrow  .SetDefaultColor(color.magenta) ;

AddLabel(showLabel,
      if rsi crosses above OS then "Buy"  else
      if rsi crosses below OB then "Sell" else "RSI: " +round(rsi,1),
      if rsi crosses above OS then color.green else
      if rsi crosses below OB then color.red   else color.gray);

Alert( rsi crosses above OS, "Buy" , Alert.Bar, Sound.Bell);
Alert( rsi crosses below OB , "Sell" , Alert.Bar, Sound.Bell);
 
Last edited:
Adding Color to Plots and Labels
A frequent request is for coloring plots, labels, watch lists: green for upticks, red for down.
This example can be applied to a plot of any type of oscillator.
HKzCEeY.png

Ruby:
# TOS RSI
declare lower ;
input show_label = yes ;
input price = close ;
input OB = 75 ;
input OS = 35 ;
input rsi_length = 14 ;
# ########################################################
#Using GlobalColors makes the colors modifiable
DefineGlobalColor("maxxed", CreateColor(50, 200, 255)) ;
DefineGlobalColor("rising",  CreateColor(0, 165, 0)) ;
DefineGlobalColor("bear",  CreateColor(225, 0, 0)) ;
DefineGlobalColor("pretrend", CreateColor (200, 125, 255)) ;
# ########################################################

Plot RSI = reference RSI("price" = PRICE, "length" = rsi_length);
# ########################################################
#RSI> RSI[1] this statement is saying if the current candle is greater than the previous candle
#that is what [1] denotes. Thus defining uptick. The same is then done for downticks.
RSI.AssignValueColor(
if RSI> OB then GlobalColor("maxxed") else
if RSI< OS then GlobalColor("pretrend") else
if RSI> RSI[1] then GlobalColor("rising")
     else GlobalColor("bear"));
RSI.SetLineWeight(3);
# ########################################################

plot OverBought = OB;
plot OverSold = OS;
plot UpArrow = if RSI crosses above OverSold then OverSold else Double.NaN;
plot DownArrow = if RSI crosses below OverBought then OverBought else Double.NaN;

DefineGlobalColor("OBcolor", CreateColor(171, 171, 225)) ;
DefineGlobalColor("OScolor", CreateColor(220, 220, 128)) ;
OverBought.SetDefaultColor(GlobalColor("OBcolor"));
OverSold.SetDefaultColor(GlobalColor("OScolor"));
UpArrow.SetPaintingStrategy(PaintingStrategy.ARROW_UP);
DownArrow.SetPaintingStrategy(PaintingStrategy.ARROW_DOWN);
UpArrow.SetDefaultColor(color.dark_green);
DownArrow.SetDefaultColor(color.dark_red);
# ########################################################
# The same logic that was used in coloring the plot can be used in labels
AddLabel(show_label,
         if RSI> OB then "RSI maxxed" else
         if RSI< OS then "RSI pre-trend" else
         if RSI> RSI[1] then "RSI Trending " +round(RSI,2)
              else "RSI Bear " +round(RSI,2) ,
         if RSI> OB then GlobalColor("maxxed") else
         if RSI< OS and RSI>RSI[1] then GlobalColor("pretrend") else
         if RSI> RSI[1] then GlobalColor("rising")
              else GlobalColor("bear"));
AddCloud(if RSI >= OB then RSI else Double.NaN, OB,
GlobalColor("maxxed"), GlobalColor("maxxed"));
AddCloud(if RSI <= OS then OS else Double.NaN, RSI,
GlobalColor("pretrend"), GlobalColor("pretrend"));
# ########################################################
 
Hi, I'm struggling to find and create an alert for RSI crossing 30 (Oversold), and 70(Overbought). Is their a way to set an alert for a security when it's RSI behaves like this?

Thanks!
 
Last edited:
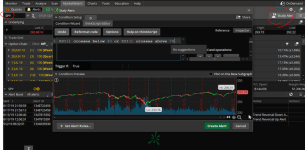
Navigate to Marketwatch -> Alerts

Type the security you are interested in and click on Study Alert.

Go to thinkscript editor and enter the following

Code:
RSI() crosses above 30 or RSI() crosses below 70

You can edit it as you need it. There should be an RSI Crossover as well.
Below screenshot.

5qTVWv5.png
 

Attachments

  • 5qTVWv5.png
    5qTVWv5.png
    253.2 KB · Views: 297
Last edited by a moderator:
Can anyone create an indicator that chimes an alert when RSI becomes oversold or overbought? I would appreciate it.
 
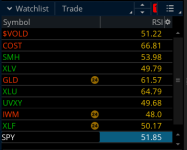
Hi does anyone know how to add a watchlist column to ThinkorSwim that just show the current RSI value on a 5 min chart?

Code:
# RSI Watchlist Column
# Mobius

def c = if isNaN(close) then c[1] else close;
def NetChgAvg = Average(c - c[1], 14);
def TotChgAvg = Average(AbsValue(c - c[1]), 14);
def ChgRatio = if TotChgAvg != 0 then NetChgAvg / TotChgAvg else 0;
plot RSI = 50 * (ChgRatio + 1);
 
@Steve2286 That's already built into ToS. You just have to add it to your watchlist. By default it will show RSI on the daily chart. Be sure to change it if you can to use other timeframe.

v4SOYsi.png
 

Attachments

  • v4SOYsi.png
    v4SOYsi.png
    25.9 KB · Views: 260
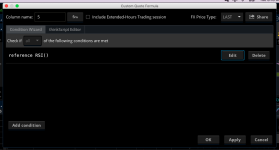
@Steve2286 I see. You can add a new Custom Quote, add a new condition > pick RSI as value and then select your timeframe.

7M2KGlM.png
 

Attachments

  • 7M2KGlM.png
    7M2KGlM.png
    66.4 KB · Views: 277
Give this a try:

Code:
def rsi = RSIWilder("over bought" = 95, "over sold" = 5, price = close(period = AggregationPeriod.FOUR_DAYS));
AddLabel(yes, rsi, if rsi >= 95 or rsi <= 5 then Color.RED else Color.WHITE);

Source
 
Just a small black box. not sure how to fix it

Code:
# beginning of code ———————- –
# current ADX as a label at top of the chart
#
# Label color changes according to value of ADX:
# . Green if >25
# . Gray if 20 to 25
# . Red if < 20
# . Red if < 20 # input length = 14; plot currentADX = ADX(length); currentADX.hide();
input length = 14;
plot currentADX = ADX(length);
currentADX.hide();
DefineGlobalColor(“ADXHigh”, CreateColor(50, 205, 50));

DefineGlobalColor(“ADXLow”, Color.RED);
DefineGlobalColor(“ADXMid”, Color.GRAY);
AddLabel (yes, (Concat(“ADX = “, Round(currentADX,1))),if currentADX > 25 then GlobalColor(“ADXHigh”) else if currentADX < 20 then GlobalColor("ADXLow") else GlobalColor("ADXMid")); # end of code ——————————-
 
Code:
# SimpleMovingAvg RSI label by Horsrider 10/10/2019

input length = 14;
input over_Bought = 70;
input over_Sold = 30;
input price = close;
input averageType = AverageType.WILDERS;

def NetChgAvg = MovingAverage(averageType, price - price[1], length);
def TotChgAvg = MovingAverage(averageType, AbsValue(price - price[1]), length);
def ChgRatio = if TotChgAvg != 0 then NetChgAvg / TotChgAvg else 0;

plot RSI = 50 * (ChgRatio + 1);

AddLabel(yes, rsi, if rsi >= over_Bought  or rsi <= over_Sold then Color.RED else Color.GREEN);
 

Join useThinkScript to post your question to a community of 21,000+ developers and traders.

Similar threads

Not the exact question you're looking for?

Start a new thread and receive assistance from our community.

87k+ Posts
371 Online
Create Post

Similar threads

Similar threads

The Market Trading Game Changer

Join 2,500+ subscribers inside the useThinkScript VIP Membership Club
  • Exclusive indicators
  • Proven strategies & setups
  • Private Discord community
  • ‘Buy The Dip’ signal alerts
  • Exclusive members-only content
  • Add-ons and resources
  • 1 full year of unlimited support

Frequently Asked Questions

What is useThinkScript?

useThinkScript is the #1 community of stock market investors using indicators and other tools to power their trading strategies. Traders of all skill levels use our forums to learn about scripting and indicators, help each other, and discover new ways to gain an edge in the markets.

How do I get started?

We get it. Our forum can be intimidating, if not overwhelming. With thousands of topics, tens of thousands of posts, our community has created an incredibly deep knowledge base for stock traders. No one can ever exhaust every resource provided on our site.

If you are new, or just looking for guidance, here are some helpful links to get you started.

What are the benefits of VIP Membership?
VIP members get exclusive access to these proven and tested premium indicators: Buy the Dip, Advanced Market Moves 2.0, Take Profit, and Volatility Trading Range. In addition, VIP members get access to over 50 VIP-only custom indicators, add-ons, and strategies, private VIP-only forums, private Discord channel to discuss trades and strategies in real-time, customer support, trade alerts, and much more. Learn all about VIP membership here.
How can I access the premium indicators?
To access the premium indicators, which are plug and play ready, sign up for VIP membership here.
Back
Top