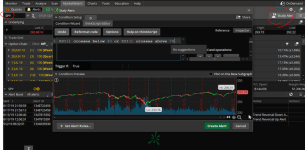
#Basic RSI Indicator With Arrows, Label, & Alerts

Shared Link: http://tos.mx/vYwKbJ5
Click here for --> Easiest way to load shared links
Shared Link: http://tos.mx/vYwKbJ5
Click here for --> Easiest way to load shared links
Ruby:
#Basic RSI Indicator w/ arrows, label, & alerts
input OB = 70;
input OS = 30;
input rsi_length = 14 ;
input showLabel = yes ;
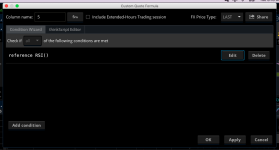
def rsi = reference RSI("length" = 14)."RSI" ;
# ########################################
# charting & formatting
plot UpArrow = if rsi crosses above OS then low else double.NaN ;
UpArrow .SetPaintingStrategy(PaintingStrategy.ARROW_up);
UpArrow .SetLineWeight(1);
UpArrow .SetDefaultColor(color.blue) ;
plot DownArrow = if rsi crosses below OB then high else double.NaN ;
DownArrow .SetPaintingStrategy(PaintingStrategy.ARROW_down);
DownArrow .SetLineWeight(1);
DownArrow .SetDefaultColor(color.magenta) ;
AddLabel(showLabel,
if rsi crosses above OS then "Buy" else
if rsi crosses below OB then "Sell" else "RSI: " +round(rsi,1),
if rsi crosses above OS then color.green else
if rsi crosses below OB then color.red else color.gray);
Alert( rsi crosses above OS, "Buy" , Alert.Bar, Sound.Bell);
Alert( rsi crosses below OB , "Sell" , Alert.Bar, Sound.Bell);
Last edited: