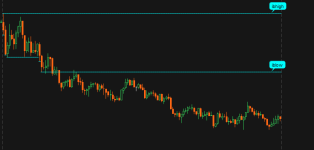
I wrote a script to plot the high and low of the first hour of trading in RTH, aka the Initial Balance. The script currently draws a line at the high and low of each candle leading to the end of the first hour, similar to a stair-stepping eventually leading to the final result of the high and low (see image). I'd like to redraw the line when a new high/low is established in that first hour.
Here's a snippit of the code that plots the lines.
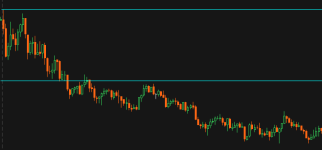
Is there a way to adjust the code to get the plots to resemble the second image? This line will be used on intraday charts and would be expected to change as prices change.
Thank you
Here's a snippit of the code that plots the lines.
Ruby:
def isIB = GetTime() >= RegularTradingStart(GetYYYYMMDD()) and GetTime() < RegularTradingStart(GetYYYYMMDD()) + 3600000;
#3600000 milliseconds = 1 hour.

#Get the High of the first 1 Hour of RTH session
def ibHigh = if isIB then high else if isIB and high > ibHigh[1] then high else ibHigh[1];

plot pltIbHigh = if isRTH and isIntraday then ibHigh else Double.NaN;
Is there a way to adjust the code to get the plots to resemble the second image? This line will be used on intraday charts and would be expected to change as prices change.
Thank you