Relative Volume Strategy and Momentum Scanner for ThinkorSwim

I just use regular EMAs myself. 18/50. Thats it. I watch them on the 1 and 5 minute charts side by side. If 18EMA holds strong I consider it to be in a strong up momentum. If we dip to the 50EMA I look to see how its reacting to that level. Most times when it fails the 50EMA momentum is heading south.
For me when it goes under the Fib 34 ema and is heading to the Fib55 ema it is "heading south".
 

New Indicator: Buy the Dip

Check out our Buy the Dip indicator and see how it can help you find profitable swing trading ideas. Scanner, watchlist columns, and add-ons are included.

Download the indicator

After a nearly a month of using this scan the ones that are about to run just jump out to you. This morning while IGC was still running wild I was focused on NTN. It ticked all my boxes. News, positive momentum, substantial volume, and pull back.

For those struggling to make sense of this scan remember that you can adjust the scan any which way you like. Experiment, try different variations, make it work for you.

1st post on this thread

This is another great thread after swingarm @BenTen, thank you.

Per @Sonny 's pre-market scanner guidelines posted on "color coded indicators" I was able get FAT NTN & I can't remember the 1st one. Anywho, I wasn't avaiable to check 930am est to 10am est. Being back now, I look NTN chart, it had peaked in the early phase of pre market & around 920am est it was around lows ( I always looked at pre market runners from a diff angle, if they remain consistent after a spike going into 930 rth session, they usually tend to run after open & vice versa).

Running rv1 rth scan, NTN is 140-150, so the question I have is, did you get in after the 1st bounce breaking vwap upward, cause it did plunge for few mins below vwap (this is all on 1m chart) & the second spike at 10:10am est broke vwap and was gone until 11:35am est, consolidated, spiked again.

I need methodology at this stage

@BenTen, what would you suggest regarding z score column that was discussed on swingarm thread, I am seeing zs >4 & rv1 > 100 as a sign to buy in. But I can't draw any conclusions at this point, with your experience, care to shed some light on these 2 values & can they be used as numbers/indicators for buy signal simultanesouly?

Thanks!
 
Yes absolutely brother! That one i can share no issue the other one i can't cuz it's still in the works I don't want to share something i'm not confident about yet lol! Thats all!

Code:
def c = close;
plot ema50 = movavgExponential(c,50);

def up = if c > ema50 then 1 else 0;
def dn = if c < ema50 then 1 else 0;

def upcount = if up==1 and up[1]==0 then 1 else if up then upcount[1]+1 else 0;
def dncount = if dn==1 and dn[1]==0 then 1 else if dn then dncount[1]+1 else 0;

addlabel(1,if upcount then upcount+" Days ↑ 50ema " else if dncount then dncount+" Days ↓ 50ema " else "Nah", if upcount then color.magenta else if dncount then color.red else color.white);

@axlerod lol I am a female lol. Thanks for sharing the code. If I tweak it I will share the tweaked version.
 
This is another great thread after swingarm @BenTen, thank you.

Per @Sonny 's pre-market scanner guidelines posted on "color coded indicators" I was able get FAT NTN & I can't remember the 1st one. Anywho, I wasn't avaiable to check 930am est to 10am est. Being back now, I look NTN chart, it had peaked in the early phase of pre market & around 920am est it was around lows ( I always looked at pre market runners from a diff angle, if they remain consistent after a spike going into 930 rth session, they usually tend to run after open & vice versa).

Running rv1 rth scan, NTN is 140-150, so the question I have is, did you get in after the 1st bounce breaking vwap upward, cause it did plunge for few mins below vwap (this is all on 1m chart) & the second spike at 10:10am est broke vwap and was gone until 11:35am est, consolidated, spiked again.

I need methodology at this stage

@BenTen, what would you suggest regarding z score column that was discussed on swingarm thread, I am seeing zs >4 & rv1 > 100 as a sign to buy in. But I can't draw any conclusions at this point, with your experience, care to shed some light on these 2 values & can they be used as numbers/indicators for buy signal simultanesouly?

Thanks!


NTN I entered around 1006am when price was consolidating around $3.35ish. I dont use vwap. It works for some people but not for me.
 
@axlerod This will give me analysis paralysis lol. Do you really use all of that information on the scan? If you had to pick top 3-4 useful columns in that picture what would it be?

Also, does anyone know how to create a watchlist from stocks that were removed from a watchlist/scanner? Because currently stocks join and leave the watchlist because it's connected to the scanner. However, if I start a trade in a stock and then it disappears from the watchlist I lose all the important information that the watchlist populates for me.

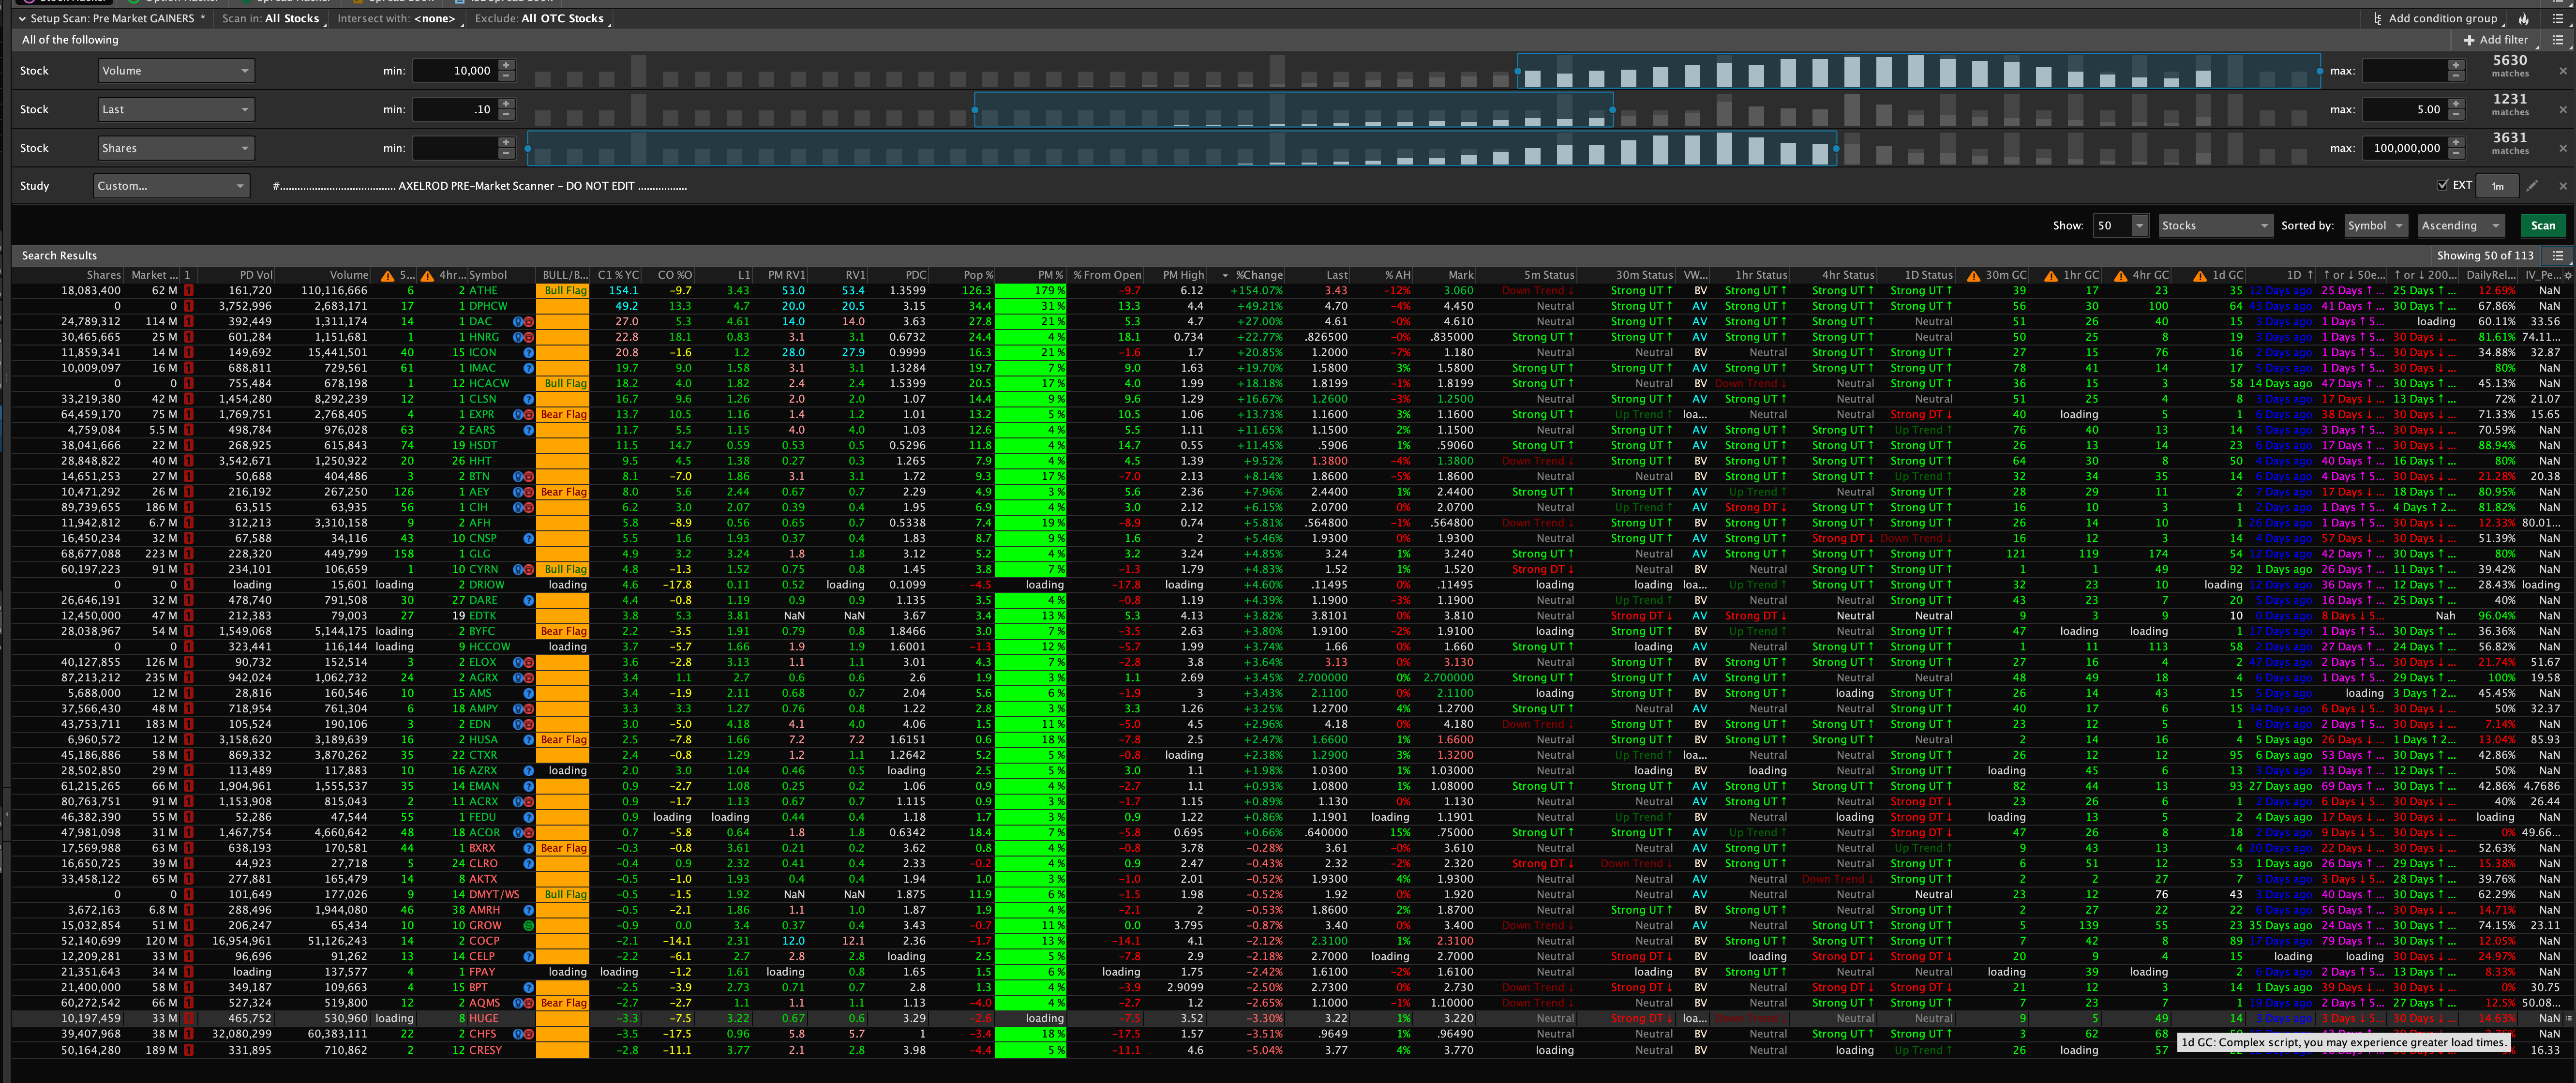
Try this may help as this gives a nice view of everything my pre-market scan

CURRENT PIC is today at 10pm so showing all the stocks it would of picked up but at 8am -9:30 am there are only 3-10 options on it.

From there I add different custom studies I have done or variables to narrow it down from volume change to average volume or golden cross recently etc.

here is what it looks like

Scan Link - http://tos.mx/wH4xQQH
Column Links

Too much code to paste each snippet sorry but can do if people will like. Figure link be easier.

E3nNiyR.png
 
Last edited:
@BonBon I notice you follow "shares" and "volume" on your watchlist. I'm new to this momentum trading. Can you explain why its important to keep track of those numbers?

@Gabrielx77
As you can see DTSS had the highest RVI on my scan. This is the scan's watchlist. DTSS was one of the main movers in the premarket with a high RVI but it opened lower than the premarket price. The down arrow shows that the stock has started to retrace. As this stock gapped up tremendously from its previous day's close I assumed it would retrace to the 78% levels. As you can see it retraced throughout the day. It can reach the 78% retracement levels (or near it) and then gap up once again. However in this scenario I would not take the trade but wait until it retraces and look for a buy signal (the up arrow after the retracement to the previous day's levels. This arrow is part of the trendpainter courtesy of @BenTen). To the right there are also support and resistance lines as well. This code was obtained in this forum as well.

Example-DTSS.jpg


This is the second example

MARA also had a high RVI. It was the 5th highest on my scan/watchlist. However, based on the buy signal (arrow on the chart), VWAP and the strong buy trend this was a better trade. It only retraced to the 38% level and went as high as $4.79. (reminder, the fib retracement was done at the opening. I would have to re-draw the fib retracement reflecting the $4.79 price to get an accurate retracement level.


Example-Mara.jpg
 
@BonBon I notice you follow "shares" and "volume" on your watchlist. I'm new to this momentum trading. Can you explain why its important to keep track of those numbers?
@murkr its ok. I too was a novice when it came to trading, technical analysis etc. However, it has always my goal to become involved in trading and after I completed my Ph.D. I began researching and learning about technical analysis, best trading platforms etc. If you type "shares' and "volume" into the search at the top right you should find discussions based on these topics. Additionally, there are many videos on youtube that will help you understand these trading concepts, terms and their importance in regards to trading. I hope this help.
 
@murkr its ok. I too was a novice when it came to trading, technical analysis etc. However, it has always my goal to become involved in trading and after I completed my Ph.D. I began researching and learning about technical analysis, best trading platforms etc. If you type "shares' and "volume" into the search at the top right you should find discussions based on these topics. Additionally, there are many videos on youtube that will help you understand these trading concepts, terms and their importance in regards to trading. I hope this help.
We had the same journey!
 
@BonBon I just signed on this morning and checked the watchlist with your code and it seems to not be working properly.
My chart and the watchlist code is set to 1min. So I dont know what to do to fix it.

gg.jpg

tt.jpg


Here is the code Im using for the arrow.
Code:
input ThermoLookBackBars = 50;
input PlotType = {default AdaptiveMovingAverages, Standard};

def HighLowScore = 1000 * ((high - high[1]) / (high[1]) +
(low - low[1]) / low[1]);

#ATR TrailingStop Code
input trailType = {default modified, unmodified};
input ATRPeriod = 5;
input ATRFactor = 3.5;
input firstTrade = {default long, short};

def HiLo = Min(high - low, 1.5 * Average(high - low, ATRPeriod));
def HRef = if low <= high[1]
    then high - close[1]
    else (high - close[1]) - 0.5 * (low - high[1]);
def LRef = if high >= low[1]
    then close[1] - low
    else (close[1] - low) - 0.5 * (low[1] - high);
def ATRMod = ExpAverage(Max(HiLo, Max(HRef, LRef)), 2 * ATRPeriod - 1);

def loss;
switch (trailType) {
case modified:
    loss = ATRFactor * ATRMod;
case unmodified:
    loss = ATRFactor * Average(TrueRange(high,  close,  low),  ATRPeriod);
}

rec state = {default init, long, short};
rec trail;
switch (state[1]) {
case init:
    if (!IsNaN(loss)) {
        switch (firstTrade) {
        case long:
            state = state.long;
            trail =  close - loss;
        case short:
            state = state.short;
            trail = close + loss;
    }
    } else {
        state = state.init;
        trail = Double.NaN;
    }
case long:
    if (close > trail[1]) {
        state = state.long;
        trail = Max(trail[1], close - loss);
    }
    else {
        state = state.short;
        trail = close + loss;
    }
case short:
    if (close < trail[1]) {
        state = state.short;
        trail = Min(trail[1], close + loss);
    }
    else {
        state = state.long;
        trail =  close - loss;
    }
}

def BuySignal = Crosses(state == state.long, 0, CrossingDirection.ABOVE);
def SellSignal = Crosses(state == state.short, 0, CrossingDirection.ABOVE);

plot TrailingStop = trail;
TrailingStop.Hide();
#End ATR Trailing Stop Code

def A = Highest(high[1], ThermoLookBackBars);
def B = Lowest(low[1], ThermoLookBackBars);

def FiftyTwoWeekHigh = A;

def FiftyTwoWeekLow = B;

def FiftyTwoWeekScore = 10 * (((high
- FiftyTwoWeekHigh) / FiftyTwoWeekHigh) +
((low - FiftyTwoWeekLow) / FiftyTwoWeekLow));

def ThermoScore = ExpAverage(HighLowScore + FiftyTwoWeekScore, ThermoLookBackBars);

input FastLengthShort = 5;
input SlowLengthShort = 15;
input EffRatioShort = 10;
input FastLengthLong = 10;
input SlowLengthLong = 25;
input EffRatioLong = 5;

def AMA = MovAvgAdaptive(ThermoScore, FastLengthShort, SlowLengthShort, EffRatioShort);
def AMA2 = MovAvgAdaptive(ThermoScore, FastLengthLong, SlowLengthLong, EffRatioLong);

plot Line1;
Line1.Hide();
plot Line2;
Line2.Hide();

switch (PlotType) {
case AdaptiveMovingAverages:
    Line1 = AMA;
    Line2 = AMA2;
case Standard:
    Line1 = ThermoScore;
    Line2 = ThermoScore;
}

def InvisibleLine = close * 0;
plot Line3 = InvisibleLine;
Line3.Hide();

def Buy = Line1 > 0 and Line2 < 0 and state == state.long;
def StrongBuy = Line1 > 0 and Line2 >= 0 and state == state.long;
def Sell = Line1 < 0 and Line2 > 0 and state == state.short;
def StrongSell = Line1 < 0 and Line2 <= 0 and state == state.short;

plot GU = BuySignal;
GU.SetPaintingStrategy(PaintingStrategy.BOOLEAN_ARROW_UP);
GU.SetDefaultColor(GetColor(8));
GU.SetLineWeight(2);

plot GX = SellSignal;
GX.SetPaintingStrategy(PaintingStrategy.BOOLEAN_ARROW_DOWN);
GX.SetDefaultColor(GetColor(8));
GX.SetLineWeight(2);


def uptrend = buy;
def Stronguptrend = strongbuy;
def downtrend = sell;
def Strongdowntrend = strongsell;

def arrowup = buysignal;
def arrowdown = sellsignal;

def trigger = if arrowup then 100 else if arrowdown then -100 else trigger [1];

AddLabel(yes,(if trigger == 100 then "👍" else if trigger == -100 then "👎" else "NA"));

AssignbackgroundColor(if trigger == 100 then Color.dark_Green else if arrowdown == -100 then Color.dark_Red else Color.black);
 
@murkr The thermolookbackbars are set to "9" instead of '50" (both the watchlist and the chart).

My timeframe on the chart is 5D 3m. Did you set your chart timeframe to 5D 1m? If you did make sure the the timeframe for the watchlist is 1m.
 
What was everyone watching pre-market before looking at the intraday scanner? Was MTP the highest RV in the premarket?
MTP wrecked me today. I bought the breakout instead of the dip and ended up basically buying at the top. Learning lessons the hard way lol.
 
What was everyone watching pre-market before looking at the intraday scanner? Was MTP the highest RV in the premarket?

KMDA had highest RV using sonny's pre market scanner, MTP was around 10-15 rv value range in pm scanner, after 930am est, only 2 or 3 tickers showed up on rth rv1 scanner: mtp was the best of them. It was consolidating around 3.5x range & around 10am it spiked & I just could not see that spike coming & initially I thought it would go downward below vwap at 3.42, is there an indicator/scanner to anticipate big volume influx? I use time & sales along side, but it gives selective information (depending on the size of screen) you could see tons of red prices & get an impression that it's tanking but just when you think actually tanking, green prices start popping up afterwards, it's like chasing in the dark.
 
@BenTen, @markos, @horserider You all seem to be very knowledgeable about different indicators so I was wondering what can you recommend I use with this a strategy to help decide when the trend will start reversing or losing momentum.

Right now I'm trading using a Fibonacci retracement but sometimes price flies right past a zone and I was wondering if there was a way to see that the trend was exhausted and is ready to turn.

Things that come to mind are RSI, MACD, factual energy, ADX. But I was wondering if there is anything else or one that works the best at helping me determine if there is about to be a reversal at one of the fib zones.

EG: I want to see price approaching a fib retracement level and look at another indicator to determine if the price will bounce from that zone or fly through it.
 
Last edited:
Is anyone else having problems with TOS's desktop platform today? I couldn't log onto two computers at home, and while I'm able to access it from my work computer, it's taking at least a minute to pull up each chart.

The phone works, but I'm not keen on trading momentum stocks on a 2x5 screen.
 

Join useThinkScript to post your question to a community of 21,000+ developers and traders.

Not the exact question you're looking for?

Start a new thread and receive assistance from our community.

87k+ Posts
272 Online
Create Post

The Market Trading Game Changer

Join 2,500+ subscribers inside the useThinkScript VIP Membership Club
  • Exclusive indicators
  • Proven strategies & setups
  • Private Discord community
  • ‘Buy The Dip’ signal alerts
  • Exclusive members-only content
  • Add-ons and resources
  • 1 full year of unlimited support

Frequently Asked Questions

What is useThinkScript?

useThinkScript is the #1 community of stock market investors using indicators and other tools to power their trading strategies. Traders of all skill levels use our forums to learn about scripting and indicators, help each other, and discover new ways to gain an edge in the markets.

How do I get started?

We get it. Our forum can be intimidating, if not overwhelming. With thousands of topics, tens of thousands of posts, our community has created an incredibly deep knowledge base for stock traders. No one can ever exhaust every resource provided on our site.

If you are new, or just looking for guidance, here are some helpful links to get you started.

What are the benefits of VIP Membership?
VIP members get exclusive access to these proven and tested premium indicators: Buy the Dip, Advanced Market Moves 2.0, Take Profit, and Volatility Trading Range. In addition, VIP members get access to over 50 VIP-only custom indicators, add-ons, and strategies, private VIP-only forums, private Discord channel to discuss trades and strategies in real-time, customer support, trade alerts, and much more. Learn all about VIP membership here.
How can I access the premium indicators?
To access the premium indicators, which are plug and play ready, sign up for VIP membership here.
Back
Top