Rahul Mohindar Oscillator (RMO) Indicator for ThinkorSwim

BenTen

Administrative
Staff member
Staff
VIP
Lifetime
The Rahul Mohindar Oscillator spots potential reversal zones and identifies slowing of momentum.
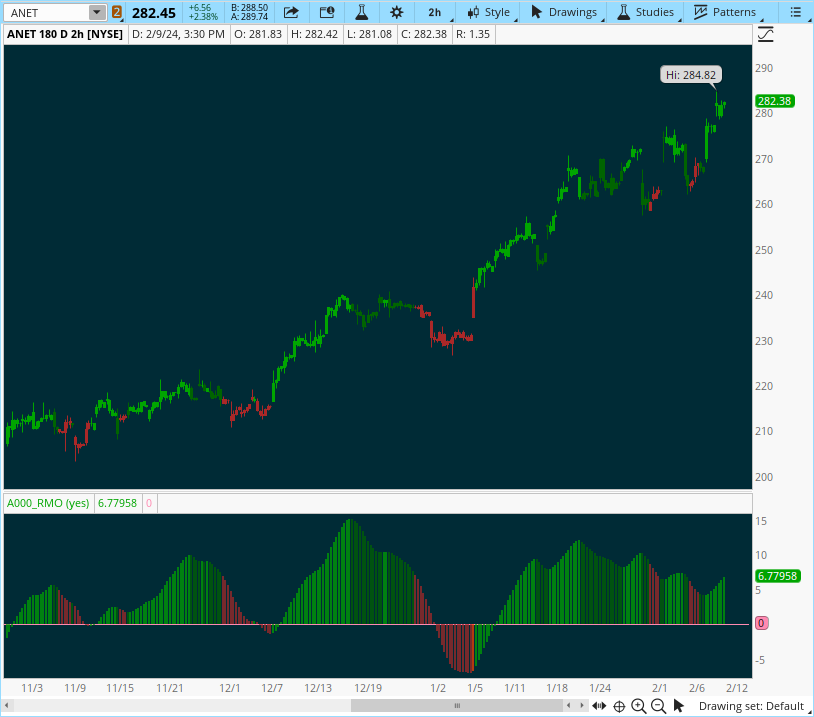
  • Red candles are the reversal zone. Look for your favorite study to trigger in this area.
  • Darker Green candles are a slowing of momentum.
    • Could just be a pullback before continuing its upward trajectory.
    • Or could be signaling the end of the trend.
    • Combine with your favorite candlestick pattern for more insight.

HgWTW2s.png

Rich (BB code):
# Rahul Mohindar Oscillator (RMO) Indicator for ThinkorSwim
# from TOS Yahoo Groups

declare lower;
def RMOSW2 = ExpAverage(100 *
(Close - ((SimplemovingAvg(Close, 2) +
SimplemovingAvg(SimplemovingAvg(Close, 2), 2) +
SimplemovingAvg(SimplemovingAvg(SimplemovingAvg(Close, 2), 2), 2) +
SimplemovingAvg(SimplemovingAvg(SimplemovingAvg(SimplemovingAvg(Close, 2), 2), 2), 2) +
SimplemovingAvg(SimplemovingAvg(SimplemovingAvg(SimplemovingAvg(SimplemovingAvg(Close, 2), 2), 2), 2), 2) +
SimplemovingAvg(SimplemovingAvg(SimplemovingAvg(SimplemovingAvg(SimplemovingAvg(SimplemovingAvg(Close, 2), 2), 2), 2), 2), 2) +
SimplemovingAvg(SimplemovingAvg(SimplemovingAvg(SimplemovingAvg(SimplemovingAvg(SimplemovingAvg(SimplemovingAvg(Close, 2), 2), 2), 2), 2), 2), 2) +
SimplemovingAvg(SimplemovingAvg(SimplemovingAvg(SimplemovingAvg(SimplemovingAvg(SimplemovingAvg(SimplemovingAvg(SimplemovingAvg(Close, 2), 2), 2), 2), 2), 2), 2), 2) +
SimplemovingAvg(SimplemovingAvg(SimplemovingAvg(SimplemovingAvg(SimplemovingAvg(SimplemovingAvg(SimplemovingAvg(SimplemovingAvg(SimplemovingAvg(Close, 2), 2), 2), 2), 2), 2), 2), 2), 2) +
SimplemovingAvg(SimplemovingAvg(SimplemovingAvg(SimplemovingAvg(SimplemovingAvg(SimplemovingAvg(SimplemovingAvg(SimplemovingAvg(SimplemovingAvg(SimplemovingAvg(Close, 2), 2), 2), 2), 2), 2), 2), 2), 2), 2)) / 10)) /
(Highest(Close, 10) - Lowest(Close, 10)), 30);

plot RMOSW3 = ExpAverage(RMOSW2, 30);
Plot Zeroline = 0;

DefineGlobalColor("bull",  CreateColor(0, 165, 0)); #green
DefineGlobalColor("bear", CreateColor(170, 40, 40));#red
DefineGlobalColor("pullback", color.dark_green);    #dark_green
DefineGlobalColor("zone", color.light_red);         #light_red
RMOSW3.setpaintingStrategy(PaintingStrategy.SQUARED_HISTOGRAM);
RMOSW3.assignValueColor(
if RMOSW2<0 and RMOSW3<=RMOSW3[1]  then GlobalColor("bear") else
if RMOSW2<0 and RMOSW3>RMOSW3[1]  then GlobalColor("zone") else
if RMOSW3>=RMOSW3[1] then GlobalColor("bull") else GlobalColor("pullback"));

input paintCandles = yes ;
AssignPriceColor(
if !paintCandles then color.current else
if RMOSW2<0 and RMOSW3<=RMOSW3[1]  then GlobalColor("bear") else
if RMOSW2<0 and RMOSW3>RMOSW3[1]  then GlobalColor("zone") else
if RMOSW3>=RMOSW3[1] then GlobalColor("bull") else GlobalColor("pullback"));
 
Last edited by a moderator:
Code:
#==============

# Long term wave - This shows the trend

declare lower;

def RMO = 100*(CLOSE - ((Average(close,2) +

Average(Average(close,2),2) +

Average(Average(Average(close,2),2),2) +

Average(Average(Average(Average(close,2),2),2),2) +

Average(Average(Average(Average(Average(close,2),2),2),2),2) +

Average(Average(Average(Average(Average(Average(close,2),2),2),2),2),2) +

Average(Average(Average(Average(Average(Average(Average(close,2),2),2),2),2),2),2) +

Average(Average(Average(Average(Average(Average(Average(Average(close,2),2),2),2),2),2),2),2) +

Average(Average(Average(Average(Average(Average(Average(Average(Average(close,2),2),2),2),2),2),2),2),2) +

Average(Average(Average(Average(Average(Average(Average(Average(Average(Average(close,2),2),2),2),2),2),2),2),2),2)) / 10)) /

(Highest(close,10) - Lowest(close,10));

plot swingtrade = expaverage(RMO,81);

swingtrade.SetPaintingStrategy(paintingStrategy.HISTOGRAM);

swingtrade.SetLineWeight(3);

swingtrade.AssignValueColor(if swingtrade > 0 then color.CYAN else color.red);

#==============
 
Last edited by a moderator:
Code:
#==============
# Mid and Short term waves - They create buy and sell signals
# translated from a Metastock script by rhouser
# set show RMO = no
declare lower;

input length = 2;
input rmoLength = 81;
input swingTrdLen = 30;
input showRMO = no;

def mva01 = MovingAverage( AverageType.SIMPLE, close, length );
def mva02 = MovingAverage( AverageType.SIMPLE, mva01, length );
def mva03 = MovingAverage( AverageType.SIMPLE, mva02, length );
def mva04 = MovingAverage( AverageType.SIMPLE, mva03, length );
def mva05 = MovingAverage( AverageType.SIMPLE, mva04, length );
def mva06 = MovingAverage( AverageType.SIMPLE, mva05, length );
def mva07 = MovingAverage( AverageType.SIMPLE, mva06, length );
def mva08 = MovingAverage( AverageType.SIMPLE, mva07, length );
def mva09 = MovingAverage( AverageType.SIMPLE, mva08, length );
def mva10 = MovingAverage( AverageType.SIMPLE, mva09, length );

def RMO = ( close - ( ( mva01 + mva02 + mva03 + mva04 + mva05 + mva06 + mva07 + mva08 + mva09 + mva10 ) / 10 ) ) / ( Highest( close, 10 ) - Lowest( close, 10 ) );

plot Swingtrade = MovingAverage( AverageType.EXPONENTIAL, RMO, rmoLength );
plot SwingTrd2 = MovingAverage( AverageType.EXPONENTIAL, RMO, swingTrdLen );
plot SwingTrd3 = MovingAverage( AverageType.EXPONENTIAL, SwingTrd2, swingTrdLen );
plot ZeroLine = 0;

#===============================[ Look & Feel ]================================
Swingtrade.SetPaintingStrategy( PaintingStrategy.HISTOGRAM );
Swingtrade.SetDefaultColor( Color.GREEN );
Swingtrade.SetLineWeight( 3 );
Swingtrade.SetHiding( !showRMO );
SwingTrd2.SetPaintingStrategy( PaintingStrategy.HISTOGRAM );
SwingTrd2.SetDefaultColor( Color.MAGENTA );
SwingTrd2.SetLineWeight( 3 );
SwingTrd2.SetHiding( showRMO );
SwingTrd3.SetPaintingStrategy( PaintingStrategy.LINE );
SwingTrd3.SetDefaultColor( Color.CYAN );
SwingTrd3.SetLineWeight( 1 );
SwingTrd3.SetHiding( showRMO );
SwingTrd3.AssignValueColor(if SwingTrd3 > 0 then Color.CYAN else Color.RED);
ZeroLine.SetDefaultColor( Color.BLACK );

# buy and sell conditions
def buy = if SwingTrd2 crosses above SwingTrd3 and SwingTrd3[0] > SwingTrd3[1] and SwingTrd3 > 0 then 1
else if SwingTrd3 crosses above 0 and SwingTrd3[0] > SwingTrd3[1] and SwingTrd3 > 0 then 1
else if SwingTrd2 crosses above 0 and SwingTrd3[0] > SwingTrd3[1] and SwingTrd3 > 0 then 1
else double.Nan;

def sell = if SwingTrd2 crosses below SwingTrd3 and swingtrade < 0 and swingtrade[0] < swingtrade[1] and low[0] < low[1] then 1
else if SwingTrd3 crosses below 0 and swingtrade < 0 and swingtrade[0] < swingtrade[1] and low[0] < low[1] then 1
else if SwingTrd2 crosses below 0 and swingtrade < 0 and swingtrade[0] < swingtrade[1] and low[0] < low[1] then 1
else double.Nan;

# def Bull = SwingTrd2 crosses above SwingTrd3 and RMO > 0;
# def Bear = SwingTrd3 crosses above SwingTrd2 and RMO < 0;
AddVerticalLine(Buy , "Up", Color.UPTICK);
AddVerticalLine(Sell, "Down", Color.LIGHT_RED);
#==============
 
Last edited by a moderator:
Just wanted comment of those kind of oscillators: The best thing about them compared to standard RSI/MACD etc is multiple timeframe confluence. By using multiple length on single main timeframe you get MTF signal. - The trick is fine tuning length to your criteria and setups. Especially tricky is the understanding the state of market (chop/trend/washout) and how these indicators behave in those.
Simple MTF rsi is more powerful than single timeframe RSI, but at same time much harder to use effectively.

The worst part about them is it is very hard to determine what exactly they measure. For example I have hard time figuring out what exactly is the point of this RMO calculations? (smoothing? decycling?)
 
Last edited:
How would I go about removing the up/down signals from the code?
Just wanted comment of those kind of oscillators: The best thing about them compared to standard RSI/MACD etc is multiple timeframe confluence. By using multiple length on single main timeframe you get MTF signal. - The trick is fine tuning length to your criteria and setups. Especially tricky is the understanding the state of market (chop/trend/washout) and how these indicators behave in those.
Simple MTF rsi is more powerful than single timeframe RSI, but at same time much harder to use effectively.

The worst part about them is it is very hard to determine what exactly they measure. For example I have hard time figuring out what exactly is the point of this RMO calculations? (smoothing? decycling?)
I use this to give me sense of market direction and momentum. The entries and exits depends highly on price action.
 
Took the two RMO indicators provided by @Camelotnite and integrated them into the "impulse" format to be used as a trend painter for the candlesticks while not clogging the chart and allowing more indicators to be used
Code:
#Impulse modified to use RMO Short Term and Long Term in confluence
#ImpulseRMOLST by Tradebyday

#==============
# Mid and Short term waves - They create buy and sell signals
# translated from a Metastock script by rhouser
# set show RMO = no

input length = 2;
input rmoLength = 81;
input swingTrdLen = 30;
input showRMO = no;

def mva01 = MovingAverage( AverageType.SIMPLE, close, length );
def mva02 = MovingAverage( AverageType.SIMPLE, mva01, length );
def mva03 = MovingAverage( AverageType.SIMPLE, mva02, length );
def mva04 = MovingAverage( AverageType.SIMPLE, mva03, length );
def mva05 = MovingAverage( AverageType.SIMPLE, mva04, length );
def mva06 = MovingAverage( AverageType.SIMPLE, mva05, length );
def mva07 = MovingAverage( AverageType.SIMPLE, mva06, length );
def mva08 = MovingAverage( AverageType.SIMPLE, mva07, length );
def mva09 = MovingAverage( AverageType.SIMPLE, mva08, length );
def mva10 = MovingAverage( AverageType.SIMPLE, mva09, length );

def RMO = ( close - ( ( mva01 + mva02 + mva03 + mva04 + mva05 + mva06 + mva07 + mva08 + mva09 + mva10 ) / 10 ) ) / ( Highest( close, 10 ) - Lowest( close, 10 ) );

def Swingtrade = MovingAverage( AverageType.EXPONENTIAL, RMO, rmoLength );
def SwingTrd2 = MovingAverage( AverageType.EXPONENTIAL, RMO, swingTrdLen );
def SwingTrd3 = MovingAverage( AverageType.EXPONENTIAL, SwingTrd2, swingTrdLen );
def ZeroLine = 0;


# buy and sell conditions
def buy = if SwingTrd2 crosses above SwingTrd3 and SwingTrd3[0] > SwingTrd3[1] and SwingTrd3 > 0 then 1
else if SwingTrd3 crosses above 0 and SwingTrd3[0] > SwingTrd3[1] and SwingTrd3 > 0 then 1
else if SwingTrd2 crosses above 0 and SwingTrd3[0] > SwingTrd3[1] and SwingTrd3 > 0 then 1
else Double.NaN;

def sell = if SwingTrd2 crosses below SwingTrd3 and Swingtrade < 0 and Swingtrade[0] < Swingtrade[1] and low[0] < low[1] then 1
else if SwingTrd3 crosses below 0 and Swingtrade < 0 and Swingtrade[0] < Swingtrade[1] and low[0] < low[1] then 1
else if SwingTrd2 crosses below 0 and Swingtrade < 0 and Swingtrade[0] < Swingtrade[1] and low[0] < low[1] then 1
else Double.NaN;

#==============

#==============

# Long term wave - This shows the trend


def RMO2 = 100 * (close - ((Average(close, 2) +

Average(Average(close, 2), 2) +

Average(Average(Average(close, 2), 2), 2) +

Average(Average(Average(Average(close, 2), 2), 2), 2) +

Average(Average(Average(Average(Average(close, 2), 2), 2), 2), 2) +

Average(Average(Average(Average(Average(Average(close, 2), 2), 2), 2), 2), 2) +

Average(Average(Average(Average(Average(Average(Average(close, 2), 2), 2), 2), 2), 2), 2) +

Average(Average(Average(Average(Average(Average(Average(Average(close, 2), 2), 2), 2), 2), 2), 2), 2) +

Average(Average(Average(Average(Average(Average(Average(Average(Average(close, 2), 2), 2), 2), 2), 2), 2), 2), 2) +

Average(Average(Average(Average(Average(Average(Average(Average(Average(Average(close, 2), 2), 2), 2), 2), 2), 2), 2), 2), 2)) / 10)) /

(Highest(close, 10) - Lowest(close, 10));

def swingtrade4 = ExpAverage(RMO, 81);

#==============


def GreenPrice = Swingtrd2 > 0 and swingtrade4 > 0;
def RedPrice = Swingtrd2 < 0 and swingtrade4 < 0;

plot Bullish = GreenPrice;
plot Neutral = !GreenPrice and !RedPrice;
plot Bearish = RedPrice;

Bullish.SetDefaultColor(Color.UPTICK);
Bullish.SetPaintingStrategy(PaintingStrategy.BOOLEAN_POINTS);
Bullish.SetLineWeight(3);
Bullish.Hide();
Neutral.SetDefaultColor(Color.BLUE);
Neutral.SetPaintingStrategy(PaintingStrategy.BOOLEAN_POINTS);
Neutral.SetLineWeight(3);
Neutral.Hide();
Bearish.SetDefaultColor(Color.DOWNTICK);
Bearish.SetPaintingStrategy(PaintingStrategy.BOOLEAN_POINTS);
Bearish.SetLineWeight(3);
Bearish.Hide();

DefineGlobalColor("Bullish", Color.UPTICK);
DefineGlobalColor("Neutral", Color.BLUE);
DefineGlobalColor("Bearish", Color.DOWNTICK);
AssignPriceColor(if GreenPrice then GlobalColor("Bullish") else if RedPrice then GlobalColor("Bearish") else GlobalColor("Neutral"));
 
@lowtrade The green bullish candle appears (if you have both of the RMO's shared by camelotnite on screen as reference) when both histograms are above 0. then bearish red candles when both histograms are under 0. Blue occurs when they are not in agreement with each other. I forgot to do this before I uploaded the code, but if you edit the source code for the indicator I shared, third line from the bottom you can replace the word "BLUE" with "GRAY" for a much better visual representation of neutral. Also, I am not too familiar with making scans as I mostly day trade /ES, but maybe someone else could make it happen
 
Hi Do you guys have latest code for above one?
There isn't a single "current" version of the above indicator. Instead, members have shared several variations customized to suit different trading styles.

To become proficient in reading these scripts, the most effective method is to experiment with it firsthand. Nothing compares to hands-on experience, so add the indicator to your chart and observe how it operates in conjunction with your other indicators.
 
@Camelotnite Thanks for your contribution. I like it. I added some color to the histogram, noticed that 0.1 and 0.2 are interesting levels, so I added a line and changed color of histogram if over .2/-.2. I also added divergence. Overall, it's one of my favorite indicators! Thanks!!
http://tos.mx/2AwNtzB

Code:
#==============
# Mid and Short term waves - They create buy and sell signals
# translated from a Metastock script by rhouser
# set show RMO = no
declare lower;

input length = 2;
input rmoLength = 81;
input swingTrdLen = 30;
input showRMO = no;
input colorbar = yes;

def mva01 = MovingAverage( AverageType.SIMPLE, close, length );
def mva02 = MovingAverage( AverageType.SIMPLE, mva01, length );
def mva03 = MovingAverage( AverageType.SIMPLE, mva02, length );
def mva04 = MovingAverage( AverageType.SIMPLE, mva03, length );
def mva05 = MovingAverage( AverageType.SIMPLE, mva04, length );
def mva06 = MovingAverage( AverageType.SIMPLE, mva05, length );
def mva07 = MovingAverage( AverageType.SIMPLE, mva06, length );
def mva08 = MovingAverage( AverageType.SIMPLE, mva07, length );
def mva09 = MovingAverage( AverageType.SIMPLE, mva08, length );
def mva10 = MovingAverage( AverageType.SIMPLE, mva09, length );

def RMO = ( close - ( ( mva01 + mva02 + mva03 + mva04 + mva05 + mva06 + mva07 + mva08 + mva09 + mva10 ) / 10 ) ) / ( Highest( close, 10 ) - Lowest( close, 10 ) );

plot up = 0.1;
plot dn = -0.1;
up.setdefaultColor(color.red);
dn.setdefaultColor(color.green);
plot Swingtrade = MovingAverage( AverageType.EXPONENTIAL, RMO, rmoLength );
plot SwingTrd2 = MovingAverage( AverageType.EXPONENTIAL, RMO, swingTrdLen );
plot SwingTrd3 = MovingAverage( AverageType.EXPONENTIAL, SwingTrd2, swingTrdLen );
plot ZeroLine = 0;

#===============================[ Look & Feel ]================================
Swingtrade.SetPaintingStrategy( PaintingStrategy.HISTOGRAM );
Swingtrade.SetDefaultColor( Color.GREEN );
Swingtrade.SetLineWeight(5);
Swingtrade.SetHiding( !showRMO );
SwingTrd2.SetPaintingStrategy( PaintingStrategy.HISTOGRAM );
#SwingTrd2.SetDefaultColor( Color.MAGENTA );
SwingTrd2.AssignValueColor(if SwingTrd2 > SwingTrd2[1] and SwingTrd2 > 0.2
                             then Color.magenta else if SwingTrd2 > SwingTrd2[1] and SwingTrd2 > 0
                             then Color.green
                             else if SwingTrd2 > 0 and SwingTrd2 < SwingTrd2[1]
                             then createColor(51,102,255)
                             else if SwingTrd2 < -0.2 and SwingTrd2 < SwingTrd2[1]
                             then Color.cyan else if SwingTrd2 < 0 and SwingTrd2 < SwingTrd2[1]
                             then Color.RED
                             else Color.YELLOW);

AssignPriceColor(if !ColorBar then Color.CURRENT else if SwingTrd2 > SwingTrd2[1] and SwingTrd2 > 0.2 then color.magenta else if SwingTrd2 > SwingTrd2[1] and SwingTrd2 > 0  then color.green else if SwingTrd2 > 0 and SwingTrd2 < SwingTrd2[1] then createColor(51,102,255) else if SwingTrd2 < -0.2 and SwingTrd2 < SwingTrd2[1] then Color.cyan else if SwingTrd2 < 0 and SwingTrd2 < SwingTrd2[1] then color.red else if SwingTrd2 < 0 and SwingTrd2 > SwingTrd2[1] then color.yellow  else Color.CURRENT);


SwingTrd2.SetLineWeight(5);
SwingTrd2.SetHiding( showRMO );
SwingTrd3.SetPaintingStrategy( PaintingStrategy.LINE );
#SwingTrd3.SetDefaultColor( Color.green);
SwingTrd3.SetLineWeight( 4 );
SwingTrd3.SetHiding( showRMO );
SwingTrd3.AssignValueColor(if SwingTrd3 > 0 then Color.cyan else Color.magenta);
ZeroLine.SetDefaultColor( Color.BLACK );


# buy and sell conditions
def buy = if SwingTrd2 crosses above SwingTrd3 and SwingTrd3[0] > SwingTrd3[1] and SwingTrd3 > 0 then 1
else if SwingTrd3 crosses above 0 and SwingTrd3[0] > SwingTrd3[1] and SwingTrd3 > 0 then 1
else if SwingTrd2 crosses above 0 and SwingTrd3[0] > SwingTrd3[1] and SwingTrd3 > 0 then 1
else double.Nan;

def sell = if SwingTrd2 crosses below SwingTrd3 and swingtrade < 0 and swingtrade[0] < swingtrade[1] and low[0] < low[1] then 1
else if SwingTrd3 crosses below 0 and swingtrade < 0 and swingtrade[0] < swingtrade[1] and low[0] < low[1] then 1
else if SwingTrd2 crosses below 0 and swingtrade < 0 and swingtrade[0] < swingtrade[1] and low[0] < low[1] then 1
else double.Nan;

# def Bull = SwingTrd2 crosses above SwingTrd3 and RMO > 0;
# def Bear = SwingTrd3 crosses above SwingTrd2 and RMO < 0;
#AddVerticalLine(Buy , "Up", Color.UPTICK);
#AddVerticalLine(Sell, "Down", Color.LIGHT_RED);
#==============


# DIVERGENCE

input divergenceLength = 5; #hint divergenceLength: The number of bars used to calculate divergences.

input divergenceType = {default regular, reverse}; #hint divergenceType: The type of divergence. A regular divergence is when price is making higher highs (or lower lows), while the indicator is making lower highs (or higher lows). A reverse divergence (also called a hidden divergence) is when the indicator is making higher highs (or lower lows), while price is making lower highs (or higher lows).
#Hint: The output of this indicator is for informational and educational use only, is not an investment recommendation or advice, and should not be relied upon in making the decision to buy or sell a security or pursue a particular investment strategy.

def xDownBars;
def xUpBars;
def xDowns;
def xUps;
def hiBars;
def loBars;
def pivotTop;
def pivotBottom;
def hiInd;
def loInd;
def hiPrice;
def loPrice;
plot bearishd;
plot bullishd;

def K = SwingTrd2;
def Over_Boughta = 0.1;
def Over_Solda = -0.1;

#K.SetDefaultColor(color.white);
#K.SetLineWeight(2);

def ind;
ind = k;

# Bearish
pivotTop =
if
    divergenceType == divergenceType.regular
then
    ind[1] > over_Boughta and ind[1] == Highest(ind, divergenceLength + 1)
else
    ind[1] >= 50 and
    ind[1] == highest(ind, divergenceLength + 1) and
    ind[1] == highest(ind, divergenceLength+1)[-divergenceLength+1];

if pivotTop
then {
    hiBars = 1;
    hiInd = ind[1];
    hiPrice = max(high[2], max(high[1], high[0]));
}
else {
    hiBars = hiBars[1] + 1;
    hiInd = hiInd[1];
    hiPrice = hiPrice[1];
}

if ind[1] crosses below  Over_Boughta
then {
    xDownBars = 1;
    xDowns = xDowns[1] + 1;
}
else {
    xDownBars = xDownBars[1] + 1;
    xDowns = if pivotTop[1] then 0 else xDowns[1];
}

def bearCond;
switch (divergenceType) {
case regular:
bearCond =
    ind[1] >= ZeroLine and
    ind < ind[1] and
    high[1] == Highest(high, divergenceLength + 1) and
    hiBars[1] > xDownBars[1] and
    xDowns == 1 and
    close < close[1] and
    hiPrice[1] < high[1] and
    hiInd[1] > ind[1];
case reverse:
bearCond =
    ind[1] >= ZeroLine and
    ind < ind[1] and
#    high[1] == Highest(high, divergenceLength) and
#    hiBars[1] > xDownBars[1] and
#    xDowns == 1 and
    close < close[1] and
    hiPrice[1] > high[1] and hiPrice[1] > high and
    hiInd[1] < ind[1];}

bearishd =
    if
        bearCond
    then
        ind[1]
    else
        Double.NaN;;

bearishd.SetPaintingStrategy(PaintingStrategy.ARROW_DOWN);
bearishd.SetDefaultColor(Color.CYAN);
bearishd.setLineWeight(2);
bearishd.hideTitle();
bearishd.hideBubble();

def countBear = if bearCond[-1] then countBear[1] + 1 else countBear[1];
def recentBear = countBear == HighestAll(countBear);
def secHigh = highestAll(if bearCond[-1] and recentBear then ind else Double.NaN);
#def firstHigh = highestAll(if bearCond and recentBear and ind[1] == secHigh then hiInd[1] else double.NaN);
def FH_bar = highestAll(if recentBear and bearCond[-1] and ind == secHigh then getvalue(barNumber(), hibars) else double.NaN);

plot bearTrendline =
if
    recentBear and bearCond[-1] and ind == secHigh
then
    max(ind[1], ind[0])
else
#    if pivotTop and hiInd == firstHigh
    if
        FH_bar == barNumber()
    then
        ind
    else
        double.NaN;
bearTrendline.EnableApproximation();
bearTrendline.setDefaultColor(color.RED);
bearTrendline.setLineWeight(4);
bearTrendline.hideBubble();
bearTrendline.hideTitle();

#Bullish
pivotBottom =
if
    divergenceType == divergenceType.regular
then
    ind[1] < over_Solda and ind[1] == lowest(ind, divergenceLength + 1)
else
    ind[1] <= 50 and
    ind[1] == lowest(ind, divergenceLength+1) and
    ind[1] == lowest(ind, divergenceLength+1)[-divergenceLength+1];

if pivotBottom
then {
    loBars = 1;
    loInd = ind[1];
    loPrice = min(low[2], min(low[1], low[0]));
}
else {
    loBars = loBars[1] + 1;
    loInd = loInd[1];
    loPrice = loPrice[1];
}

if ind[1] crosses above over_Solda
then {
    xUpBars = 1;
    xUps = xUps[1] + 1;
}
else {
    xUpBars = xUpBars[1] + 1;
    xUps = if pivotBottom[1] then 0 else xUps[1];
}

def bullCond;
switch (divergenceType){
case regular:
bullCond =
    ind[1] <= ZeroLine and
    ind > ind[1] and     
    low[1] == Lowest(low, divergenceLength + 1) and
    loBars[1] > xUpBars[1] and
    xUps == 1 and
    close > close[1] and
    loPrice[1] > low[1] and
    loInd[1] < ind[1];
case reverse:
bullCond =
    ind[1] <= ZeroLine and
    ind > ind[1] and     
#    low[1] == Lowest(low, divergenceLength) and
#    loBars[1] > xUpBars[1] and
#    xUps == 1 and
    close > close[1] and
    loPrice[1] < low[1] and loPrice[1] < low and
    loInd[1] > ind[1];}

bullishd =
    if
        bullCond
    then
        ind[1]
    else
        Double.NaN;

bullishd.SetPaintingStrategy(PaintingStrategy.ARROW_UP);
bullishd.SetDefaultColor(Color.CYAN);
bullishd.setLineWeight(2);
bullishd.HideTitle();
bullishd.HideBubble();

def countBull = if bullCond[-1] then countBull[1] + 1 else countBull[1];
def recentBull = countBull == HighestAll(countBull);
def secLow = highestAll(if bullCond[-1] and recentBull then ind else Double.NaN);
#def firstLow = highestAll(if bullCond and recentBull and ind[1] == secLow then loInd[1] else double.NaN);
def FL_bar = highestAll(if recentBull and bullCond[-1] and ind == secLow then getvalue(barNumber(), lobars) else double.NaN);

plot bullTrendline =
    if
        recentBull and bullCond[-1] and ind == secLow
    then
        min(ind[1], ind[0])
    else
        if
#            pivotBottom and loInd == firstLow
            FL_bar == barNumber()
        then
            ind[0]
        else
            double.NaN;
bullTrendline.EnableApproximation();
bullTrendline.setDefaultColor(color.GREEN);
bullTrendline.setLineWeight(4);
bullTrendline.hideBubble();
bullTrendline.hideTitle();
 
@chewie76 , Thank you for the updated indicator. Can you please let me know if you are just using RMO as lower study indicator or combining with other indicators too. I wanted to use it for 5 mins for /ES .
 

Join useThinkScript to post your question to a community of 21,000+ developers and traders.

Similar threads

Not the exact question you're looking for?

Start a new thread and receive assistance from our community.

87k+ Posts
299 Online
Create Post

Similar threads

Similar threads

The Market Trading Game Changer

Join 2,500+ subscribers inside the useThinkScript VIP Membership Club
  • Exclusive indicators
  • Proven strategies & setups
  • Private Discord community
  • ‘Buy The Dip’ signal alerts
  • Exclusive members-only content
  • Add-ons and resources
  • 1 full year of unlimited support

Frequently Asked Questions

What is useThinkScript?

useThinkScript is the #1 community of stock market investors using indicators and other tools to power their trading strategies. Traders of all skill levels use our forums to learn about scripting and indicators, help each other, and discover new ways to gain an edge in the markets.

How do I get started?

We get it. Our forum can be intimidating, if not overwhelming. With thousands of topics, tens of thousands of posts, our community has created an incredibly deep knowledge base for stock traders. No one can ever exhaust every resource provided on our site.

If you are new, or just looking for guidance, here are some helpful links to get you started.

What are the benefits of VIP Membership?
VIP members get exclusive access to these proven and tested premium indicators: Buy the Dip, Advanced Market Moves 2.0, Take Profit, and Volatility Trading Range. In addition, VIP members get access to over 50 VIP-only custom indicators, add-ons, and strategies, private VIP-only forums, private Discord channel to discuss trades and strategies in real-time, customer support, trade alerts, and much more. Learn all about VIP membership here.
How can I access the premium indicators?
To access the premium indicators, which are plug and play ready, sign up for VIP membership here.
Back
Top