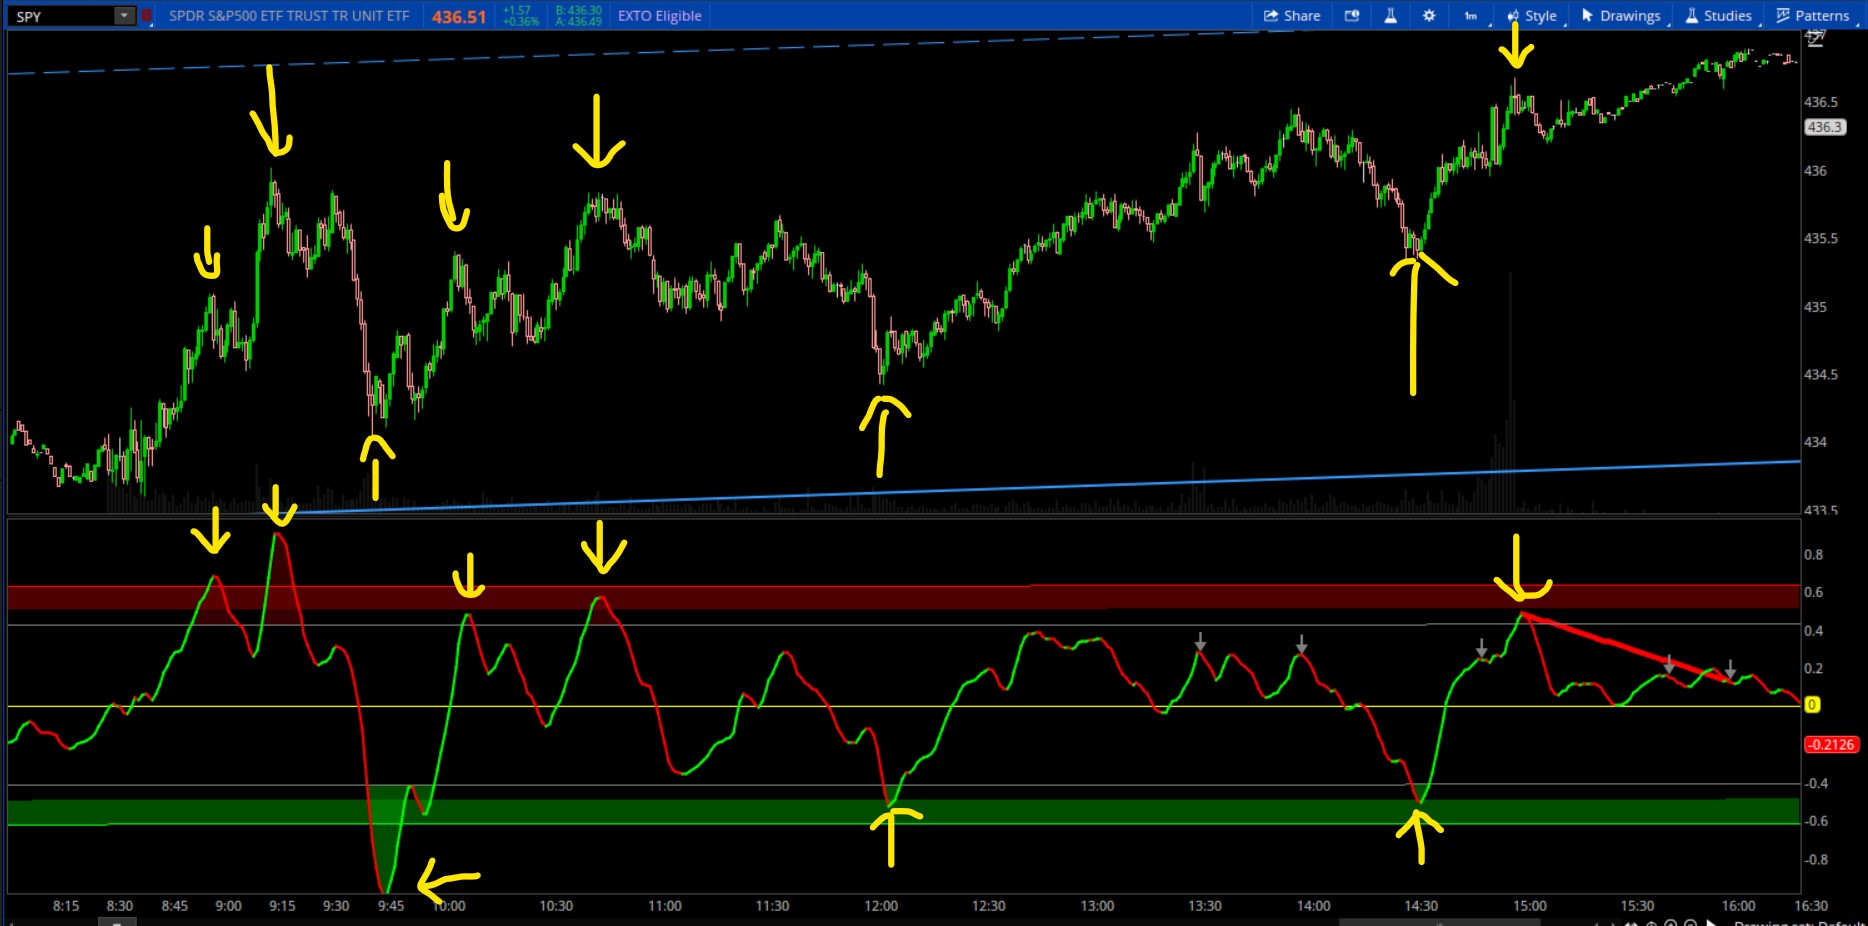
This is the standard "Awesome Oscillator" but formatted into a line. I added standard deviation levels that can be used as Overbought/Oversold areas. I also added a divergence plot as well. Upper chart can also turn on candle colors in the settings. This example is SPY on the 1 min chart.
Shareable Link:
http://tos.mx/er3g0T8
Shareable Link:
http://tos.mx/er3g0T8
Code:
#Awesome Line Oscillator with standard deviation levels and divergence plot
#Formatted by Chewie 6-21-2023

declare lower;
declare zerobase;

input ColorBar = no;
plot AO = Average(hl2, 5) - Average(hl2, 34);
plot Zero = 0;

#AO.SetPaintingStrategy(PaintingStrategy.HISTOGRAM);
AO.SetLineWeight(2);
AO.DefineColor("Up", Color.GREEN);
AO.DefineColor("Down", Color.RED);
AO.AssignValueColor(if AO > AO[1] then AO.color("Up") else if AO < AO[1] then AO.color("Down") else GetColor(1));
Zero.SetDefaultColor(COLOR.YELLOW);

# 2 Standard Deviation Full

input deviation = 1.68;
input deviations = 2.0;
input deviations2 = 2.5;
input fullRange = Yes;
input length = 21;

def regression;
def stdDeviation;
if (fullRange) {
    regression = InertiaAll(AO);
    stdDeviation = StDevAll(AO);
} else {
    regression = InertiaAll(AO, length);
    stdDeviation = StDevAll(AO, length);
}

def UpperLine = regression + deviations * stdDeviation;
def LowerLine = regression - deviations * stdDeviation;
plot Caution = regression - deviation * stdDeviation;
plot CautionH = regression + deviation * stdDeviation;

#UpperLine.SetDefaultColor(Color.RED);
#LowerLine.SetDefaultColor(Color.GREEN);
#UpperLine.SetLineWeight(1);
#LowerLine.SetLineWeight(1);
#Upperline.HideBubble();
#Upperline.Hidetitle();
#Lowerline.HideBubble();
#Lowerline.Hidetitle();
Caution.SetDefaultColor(Color.gray);
Caution.SetLineWeight(1);
Caution.HideBubble();
Caution.Hidetitle();
CautionH.SetDefaultColor(Color.gray);
CautionH.SetLineWeight(1);
CautionH.HideBubble();
CautionH.Hidetitle();


plot UpperLine2 = regression + deviations2 * stdDeviation;
plot LowerLine2 = regression - deviations2 * stdDeviation;

UpperLine2.SetDefaultColor(Color.RED);
LowerLine2.SetDefaultColor(Color.GREEN);
UpperLine2.SetLineWeight(1);
LowerLine2.SetLineWeight(1);
UpperLine2.HideBubble();
UpperLine2.Hidetitle();
LowerLine2.HideBubble();
LowerLine2.Hidetitle();

AddCloud(UpperLine2, UpperLine, Color.RED, Color.CURRENT);
AddCloud(LowerLine, LowerLine2, color.green, Color.CURRENT);
AddCloud(AO, CautionH, Color.RED, Color.CURRENT);
AddCloud(Caution, AO, color.green, Color.CURRENT);

#ColorBar
AssignPriceColor(if !ColorBar then Color.CURRENT else
                 if AO > AO[1] then AO.color("Up") else if AO < AO[1] then AO.color("Down") else GetColor(1));

# DIVERGENCE

input divergenceLength = 30; #hint divergenceLength: The number of bars used to calculate divergences.

input divergenceType = {default regular, reverse}; #hint divergenceType: The type of divergence. A regular divergence is when price is making higher highs (or lower lows), while the indicator is making lower highs (or higher lows). A reverse divergence (also called a hidden divergence) is when the indicator is making higher highs (or lower lows), while price is making lower highs (or higher lows).
#Hint: The output of this indicator is for informational and educational use only, is not an investment recommendation or advice, and should not be relied upon in making the decision to buy or sell a security or pursue a particular investment strategy.

def xDownBars;
def xUpBars;
def xDowns;
def xUps;
def hiBars;
def loBars;
def pivotTop;
def pivotBottom;
def hiInd;
def loInd;
def hiPrice;
def loPrice;
plot bearishd;
plot bullishd;

def K = AO;
def Over_Boughta = cautionh;
def Over_Solda = caution;

#K.SetDefaultColor(color.white);
#K.SetLineWeight(2);

def ind;
ind = K;

# Bearish
pivotTop =
if
    divergenceType == divergenceType.regular
then
    ind[1] > Over_Boughta and ind[1] == Highest(ind, divergenceLength + 1)
else
    ind[1] >= 50 and
    ind[1] == Highest(ind, divergenceLength + 1) and
    ind[1] == Highest(ind, divergenceLength + 1)[-divergenceLength + 1];

if pivotTop
then {
    hiBars = 1;
    hiInd = ind[1];
    hiPrice = Max(high[2], Max(high[1], high[0]));
}
else {
    hiBars = hiBars[1] + 1;
    hiInd = hiInd[1];
    hiPrice = hiPrice[1];
}

if ind[1] crosses below  Over_Boughta
then {
    xDownBars = 1;
    xDowns = xDowns[1] + 1;
}
else {
    xDownBars = xDownBars[1] + 1;
    xDowns = if pivotTop[1] then 0 else xDowns[1];
}

def bearCond;
switch (divergenceType) {
case regular:
    bearCond =
    ind[1] >= zero and
    ind < ind[1] and
    high[1] == Highest(high, divergenceLength + 1) and
    hiBars[1] > xDownBars[1] and
    xDowns == 1 and
    close < close[1] and
    hiPrice[1] < high[1] and
    hiInd[1] > ind[1];
case reverse:
    bearCond =
    ind[1] >= zero and
    ind < ind[1] and
#    high[1] == Highest(high, divergenceLength) and
#    hiBars[1] > xDownBars[1] and
#    xDowns == 1 and
    close < close[1] and
    hiPrice[1] > high[1] and hiPrice[1] > high and
    hiInd[1] < ind[1];
}

bearishd =
    if
        bearCond
    then
        ind[1]
    else
        Double.NaN;
;

bearishd.SetPaintingStrategy(PaintingStrategy.ARROW_DOWN);
bearishd.SetDefaultColor(Color.gray);
bearishd.SetLineWeight(2);
bearishd.HideTitle();
bearishd.HideBubble();

def countBear = if bearCond[-1] then countBear[1] + 1 else countBear[1];
def recentBear = countBear == HighestAll(countBear);
def secHigh = HighestAll(if bearCond[-1] and recentBear then ind else Double.NaN);
#def firstHigh = highestAll(if bearCond and recentBear and ind[1] == secHigh then hiInd[1] else double.NaN);
def FH_bar = HighestAll(if recentBear and bearCond[-1] and ind == secHigh then GetValue(BarNumber(), hiBars) else Double.NaN);

plot bearTrendline =
if
    recentBear and bearCond[-1] and ind == secHigh
then
    Max(ind[1], ind[0])
else
#    if pivotTop and hiInd == firstHigh
    if
        FH_bar == BarNumber()
    then
        ind
    else
        Double.NaN;
bearTrendline.EnableApproximation();
bearTrendline.SetDefaultColor(Color.RED);
bearTrendline.SetLineWeight(4);
bearTrendline.HideBubble();
bearTrendline.HideTitle();

#Bullish
pivotBottom =
if
    divergenceType == divergenceType.regular
then
    ind[1] < Over_Solda and ind[1] == Lowest(ind, divergenceLength + 1)
else
    ind[1] <= 50 and
    ind[1] == Lowest(ind, divergenceLength + 1) and
    ind[1] == Lowest(ind, divergenceLength + 1)[-divergenceLength + 1];

if pivotBottom
then {
    loBars = 1;
    loInd = ind[1];
    loPrice = Min(low[2], Min(low[1], low[0]));
}
else {
    loBars = loBars[1] + 1;
    loInd = loInd[1];
    loPrice = loPrice[1];
}

if ind[1] crosses above Over_Solda
then {
    xUpBars = 1;
    xUps = xUps[1] + 1;
}
else {
    xUpBars = xUpBars[1] + 1;
    xUps = if pivotBottom[1] then 0 else xUps[1];
}

def bullCond;
switch (divergenceType){
case regular:
    bullCond =
    ind[1] <= zero and
    ind > ind[1] and
    low[1] == Lowest(low, divergenceLength + 1) and
    loBars[1] > xUpBars[1] and
    xUps == 1 and
    close > close[1] and
    loPrice[1] > low[1] and
    loInd[1] < ind[1];
case reverse:
    bullCond =
    ind[1] <= zero and
    ind > ind[1] and
#    low[1] == Lowest(low, divergenceLength) and
#    loBars[1] > xUpBars[1] and
#    xUps == 1 and
    close > close[1] and
    loPrice[1] < low[1] and loPrice[1] < low and
    loInd[1] > ind[1];
}

bullishd =
    if
        bullCond
    then
        ind[1]
    else
        Double.NaN;

bullishd.SetPaintingStrategy(PaintingStrategy.ARROW_UP);
bullishd.SetDefaultColor(Color.gray);
bullishd.SetLineWeight(2);
bullishd.HideTitle();
bullishd.HideBubble();

def countBull = if bullCond[-1] then countBull[1] + 1 else countBull[1];
def recentBull = countBull == HighestAll(countBull);
def secLow = HighestAll(if bullCond[-1] and recentBull then ind else Double.NaN);
#def firstLow = highestAll(if bullCond and recentBull and ind[1] == secLow then loInd[1] else double.NaN);
def FL_bar = HighestAll(if recentBull and bullCond[-1] and ind == secLow then GetValue(BarNumber(), loBars) else Double.NaN);

plot bullTrendline =
    if
        recentBull and bullCond[-1] and ind == secLow
    then
        Min(ind[1], ind[0])
    else
        if
#            pivotBottom and loInd == firstLow
            FL_bar == BarNumber()
        then
            ind[0]
        else
            Double.NaN;
bullTrendline.EnableApproximation();
bullTrendline.SetDefaultColor(Color.GREEN);
bullTrendline.SetLineWeight(4);
bullTrendline.HideBubble();
bullTrendline.HideTitle();
Last edited: