
The Rahul Mohindar Oscillator spots potential reversal zones and identifies slowing of momentum.
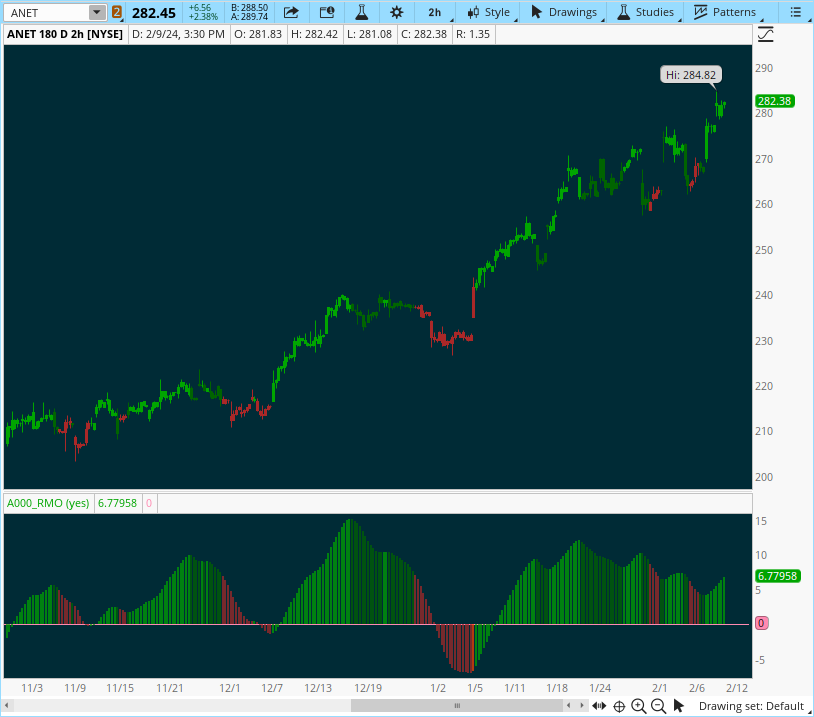
- Red candles are the reversal zone. Look for your favorite study to trigger in this area.
- Darker Green candles are a slowing of momentum.
- Could just be a pullback before continuing its upward trajectory.
- Or could be signaling the end of the trend.
- Combine with your favorite candlestick pattern for more insight.
Rich (BB code):
# Rahul Mohindar Oscillator (RMO) Indicator for ThinkorSwim
# from TOS Yahoo Groups

declare lower;
def RMOSW2 = ExpAverage(100 *
(Close - ((SimplemovingAvg(Close, 2) +
SimplemovingAvg(SimplemovingAvg(Close, 2), 2) +
SimplemovingAvg(SimplemovingAvg(SimplemovingAvg(Close, 2), 2), 2) +
SimplemovingAvg(SimplemovingAvg(SimplemovingAvg(SimplemovingAvg(Close, 2), 2), 2), 2) +
SimplemovingAvg(SimplemovingAvg(SimplemovingAvg(SimplemovingAvg(SimplemovingAvg(Close, 2), 2), 2), 2), 2) +
SimplemovingAvg(SimplemovingAvg(SimplemovingAvg(SimplemovingAvg(SimplemovingAvg(SimplemovingAvg(Close, 2), 2), 2), 2), 2), 2) +
SimplemovingAvg(SimplemovingAvg(SimplemovingAvg(SimplemovingAvg(SimplemovingAvg(SimplemovingAvg(SimplemovingAvg(Close, 2), 2), 2), 2), 2), 2), 2) +
SimplemovingAvg(SimplemovingAvg(SimplemovingAvg(SimplemovingAvg(SimplemovingAvg(SimplemovingAvg(SimplemovingAvg(SimplemovingAvg(Close, 2), 2), 2), 2), 2), 2), 2), 2) +
SimplemovingAvg(SimplemovingAvg(SimplemovingAvg(SimplemovingAvg(SimplemovingAvg(SimplemovingAvg(SimplemovingAvg(SimplemovingAvg(SimplemovingAvg(Close, 2), 2), 2), 2), 2), 2), 2), 2), 2) +
SimplemovingAvg(SimplemovingAvg(SimplemovingAvg(SimplemovingAvg(SimplemovingAvg(SimplemovingAvg(SimplemovingAvg(SimplemovingAvg(SimplemovingAvg(SimplemovingAvg(Close, 2), 2), 2), 2), 2), 2), 2), 2), 2), 2)) / 10)) /
(Highest(Close, 10) - Lowest(Close, 10)), 30);

plot RMOSW3 = ExpAverage(RMOSW2, 30);
Plot Zeroline = 0;

DefineGlobalColor("bull",  CreateColor(0, 165, 0)); #green
DefineGlobalColor("bear", CreateColor(170, 40, 40));#red
DefineGlobalColor("pullback", color.dark_green);    #dark_green
DefineGlobalColor("zone", color.light_red);         #light_red
RMOSW3.setpaintingStrategy(PaintingStrategy.SQUARED_HISTOGRAM);
RMOSW3.assignValueColor(
if RMOSW2<0 and RMOSW3<=RMOSW3[1]  then GlobalColor("bear") else
if RMOSW2<0 and RMOSW3>RMOSW3[1]  then GlobalColor("zone") else
if RMOSW3>=RMOSW3[1] then GlobalColor("bull") else GlobalColor("pullback"));

input paintCandles = yes ;
AssignPriceColor(
if !paintCandles then color.current else
if RMOSW2<0 and RMOSW3<=RMOSW3[1]  then GlobalColor("bear") else
if RMOSW2<0 and RMOSW3>RMOSW3[1]  then GlobalColor("zone") else
if RMOSW3>=RMOSW3[1] then GlobalColor("bull") else GlobalColor("pullback"));
Last edited by a moderator: