Premarket After-market For ThinkOrSwim

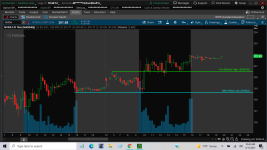
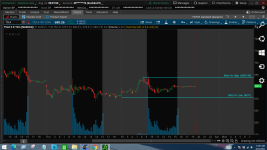
I did post a screen shot of what im trying to do but my post was moved from one location and i guess it was lost somehow . This is what I am looking for all of after hours trading High and low jus a line for the High and a line for the low . Ive done searches here and all I was able to find was Pre Market High and Low. Thanks for the Response
0PYMXO3.png
pxgUnp1.png
And Last one
Dli6R9c.png
 

Attachments

  • 0PYMXO3.png
    0PYMXO3.png
    142.4 KB · Views: 658
  • pxgUnp1.png
    pxgUnp1.png
    412.5 KB · Views: 499
Last edited by a moderator:

Join useThinkScript to post your question to a community of 21,000+ developers and traders.

I did post a screen shot of what im trying to do but my post was moved from one location and i guess it was lost somehow . This is what I am looking for all of after hours trading High and low jus a line for the High and a line for the low . Ive done searches here and all I was able to find was Pre Market High and Low. Thanks for the Response
0PYMXO3.png
And Last one

See if this works

Screenshot-2021-08-21-221612.jpg
Ruby:
input openingTime = 1600;
input closingTime = 0930;

def sec1    = SecondsFromTime(openingTime);
def sec2    = SecondsFromTime(closingTime);
def isTime1 = (sec1 >= 0 and sec1[1] < 0) or (sec1 < sec1[1] and sec1 >= 0);
def isTime2 = (sec2 >= 0 and sec2[1] < 0) or (sec2 < sec2[1] and sec2 >= 0);
def inRange = CompoundValue(1, if isTime1 then 1 else if isTime2 then 0 else inRange[1], 0);

def rhi        = if inRange and !inRange[1]
                 then high
                 else if inRange[1] and high > rhi[1]
                 then high else rhi[1];
def rHighBar   = if inRange and high == rhi then BarNumber() else Double.NaN;
def rHighest   = if BarNumber() == HighestAll(rHighBar)  then rhi else rHighest[1];

plot rangehigh = if (rHighest > 0) then rHighest else Double.NaN;
rangehigh.setpaintingStrategy(paintingStrategy.HORIZONTAL);
rangehigh.setlineWeight(2);

def rlow       = if inRange and !inRange[1]
                 then low
                 else if inRange[1] and low < rlow[1]
                 then low else rlow[1];
def rLowBar    = if inRange and low == rlow then BarNumber() else Double.NaN;
def rlowest    = if BarNumber() == HighestAll(rLowBar) then rlow else rlowest[1];

plot rangelow  = if (rlowest > 0) then rlowest else Double.NaN;
rangelow.setpaintingStrategy(paintingStrategy.HORIZONTAL);
rangelow.setlineWeight(2);
 
Can someone please help with a watch list script that shows

via green for above pre market high red below

alerts (ring bell) when the stock crosses above PM high
 
So like this?

Code:
##HighOfYear
def High52Week = Highest(High(period = "Day"), 252);
AddLabel(1, (High52Week), Color.Cyan);
plot HighofYear=High52Week;
Can we get this to mark pre market or after market highs? I think that has something to do with Globex? I have a theory about highs made in after market or premarket and not returning to them in the open market has a high success rate of return to that point...eventually. More than IMO open market high then returning.
 
This is what i have and it works except it is giving me a channel that plots on every bar on a 1 minute chart and i just want a horizontal line based off opening price.

Thank you


Code:
input daysToPlot = 10;

input symbol = "/es";


plot Data = open(symbol);


plot a = Data + 3;

plot b = Data - 3;
 
Ruby:
def Time =
    GetTime()
;
def Start =
    RegularTradingStart(GetyYYYMMDD())
;
def First =
    Time == Start + 1
;
def Opening =
    if First then Open
    else Opening[1]
;
plot Line = Opening;
Line.setPaintingStrategy(paintingStrategy.HORIZONTAL);
 
@earlyinout:
How can i def and plot the open price for rth only. maybe should have mentioned I was trying to use on a renko bar chart. Does that require something else in the script?

This might fix it... but meme bars are just not well suited to time sensitive code.

Ruby:
def Time =
    GetTime()
;
def Start =
    RegularTradingStart(GetyYYYMMDD())
;
def First =
    Time > Start and Time[1] <= Start
;
def Opening =
    if First then Open
    else Opening[1]
;
plot Line = Opening;
Line.setPaintingStrategy(paintingStrategy.HORIZONTAL);
 
Thanks so much Joshua! Works great except for renko....beginning to think it just can't be done, thank you again it is much appreciated!
 
Thanks so much Joshua! Works great except for renko....beginning to think it just can't be done, thank you again it is much appreciated!

See if this helps for your renko open

Capture.jpg
Ruby:
input time = 0930;

AddVerticalLine(SecondsFromTime(time)[1] < 0 and SecondsFromTime(time) > 0, stroke = Curve.FIRM, color = Color.WHITE);

def o = if SecondsFromTime(time)[1] < 0 and SecondsFromTime(time) > 0
        then open
        else o[1];
plot o1 = o;
o1.setpaintingStrategy(paintingStrategy.HORIZONTAL);
 
I am trying to figure out how to plot the RTH open for /es on my charts for four days with no success. Can someone please share with me how I can accomplish this??

Thank you!
 
checking for a different value of dayoftheweek() seems to work. it changes values on a different trading day. if /ES closes at 4pm and reopens at 5pm, it is during the same day, but dayoftheweek() will have a different value at 5pm.

Code:
def dow = GetDayofWeek( GetYYYYMMDD() );
def esopen = if (dow[1] <> dow) then open else esopen[1];

plot z = esopen;
z.setdefaultcolor(color.cyan);
z.SetPaintingStrategy(PaintingStrategy.HORIZONTAL);

input test1 = no;
addchartbubble(test1, low, dow, color.cyan, no);

often when creating a study, i will add bubbles to display variable values. this can help when a study isn't doing what you think it should.

https://tlc.thinkorswim.com/center/reference/thinkScript/Functions/Date---Time/GetDayOfWeek
Returns the day of week based on the given YYYYMMDD parameter.
The return value ranges from from 1 (Monday) to 7 (Sunday).


https://www.tdameritrade.com/futures/products-to-trade.html
Product E-mini S&P 500
Symbol /ES
Trading hours 6 p.m. to 5 p.m. ET

https://www.cmegroup.com/trading-hours.html

https://www.thebalance.com/profile-of-the-sandp-500-es-futures-market-1031271
 
Last edited:
I'm trying to capture the High, Low, and Close of the Futures Market at 1600 versus 1645 (after hours) for the previous day. In addition to that I'd like to display a horizontal line for the HLC levels with the ability to change the coloring.

In summary:
1. Horizontal Line to capture Futures High, Low, Close
2. Expectation is to capture the Close at 1600 (4pm ET)
3. Ability to modify the horizontal lines (color, weight)
 
Last edited:
Does anybody have a code for a column watchlist that would display after-hours percent change for each stock in a portfolio?
 
In your watchlist settings there is an option called Mark % change. If you add that to your watchlist it should display pre and after market % change. You can also do a comparison between % change and Mark % change side by side.
 
I'm trying to capture the High, Low, and Close of the Futures Market at 1600 versus 1645 (after hours) for the previous day. In addition to that I'd like to display a horizontal line for the HLC levels with the ability to change the coloring.

In summary:
1. Horizontal Line to capture Futures High, Low, Close
2. Expectation is to capture the Close at 1600 (4pm ET)
3. Ability to modify the horizontal lines (color, weight)
@bsdvs23 Try post#1 https://usethinkscript.com/threads/pre-market-after-market-for-thinkorswim.75/#post-330
Otherwise, the 8 pages in this thread are chock-full of ideas. Have fun. (y)
 
Last edited by a moderator:

Similar threads

Not the exact question you're looking for?

Start a new thread and receive assistance from our community.

87k+ Posts
321 Online
Create Post

Similar threads

Similar threads

The Market Trading Game Changer

Join 2,500+ subscribers inside the useThinkScript VIP Membership Club
  • Exclusive indicators
  • Proven strategies & setups
  • Private Discord community
  • ‘Buy The Dip’ signal alerts
  • Exclusive members-only content
  • Add-ons and resources
  • 1 full year of unlimited support

Frequently Asked Questions

What is useThinkScript?

useThinkScript is the #1 community of stock market investors using indicators and other tools to power their trading strategies. Traders of all skill levels use our forums to learn about scripting and indicators, help each other, and discover new ways to gain an edge in the markets.

How do I get started?

We get it. Our forum can be intimidating, if not overwhelming. With thousands of topics, tens of thousands of posts, our community has created an incredibly deep knowledge base for stock traders. No one can ever exhaust every resource provided on our site.

If you are new, or just looking for guidance, here are some helpful links to get you started.

What are the benefits of VIP Membership?
VIP members get exclusive access to these proven and tested premium indicators: Buy the Dip, Advanced Market Moves 2.0, Take Profit, and Volatility Trading Range. In addition, VIP members get access to over 50 VIP-only custom indicators, add-ons, and strategies, private VIP-only forums, private Discord channel to discuss trades and strategies in real-time, customer support, trade alerts, and much more. Learn all about VIP membership here.
How can I access the premium indicators?
To access the premium indicators, which are plug and play ready, sign up for VIP membership here.
Back
Top