Plot Previous Day Close in ThinkorSwim

BenTen

Administrative
Staff member
Staff
VIP
Lifetime
A thinkscript code to help you plot previous close to your ThinkorSwim chart. The previous day's close level is important to determine intraday directional bias.

Code:
# Previous Day Closing Price (PCL)
input aggregationPeriod = AggregationPeriod.DAY;
def close = close(period = aggregationPeriod)[1];
plot previous_close = close;
 
This is a really simple indicator code by me, Playstation, using Mr Yen's aka realBrianWatt method of trading within the zones of 40 handles on /ES.
Warning: Only use this on /ES, not for any other products. Change deviation according to what you want. 20 each side is the suggested value.

Code:
# Previous Day Close Made By Playstation using MrYen aka realBrianWatt method.
# This remains free for all to use.

input aggregationPeriod = AggregationPeriod.DAY;
input length = 1;
input displace = -1;
input showOnlyLastPeriod = no;
input deviation = 20;

plot PreviousDayClose;
if showOnlyLastPeriod and !IsNaN(close(period = aggregationPeriod)[-1]) { PreviousDayClose = Double.NaN;}
else { PreviousDayClose = Highest(close(period = aggregationPeriod)[-displace], length);}

PreviousDayClose.SetLineWeight(3);
PreviousDayClose.SetDefaultColor(Color.GREEN);


def TC = PreviousDayClose + deviation;
def BC = PreviousDayClose - deviation;

def TC2 = TC+40;
def BC2 = BC-40;

AddCloud(TC, TC2, Color.RED, Color.RED);
AddCloud(BC, BC2, Color.GREEN, Color.GREEN);

Totally forgot about the Discord and here. Yes, please follow Mr Yen, aka realbrianwatt on twitter for understanding of his method. He does have a youtube channel where he does his live sessions, so it would be good to learn there on his methods of trading.

**fair warning, he cusses and rants alot...but what he teaches is golden.
 
Last edited:
@lrc11239 Here's the chart bubble. Just add it to the end of your script.

Code:
input showBubble = yes;
def SR = showBubble and !IsNaN(close) and IsNaN(close [-1] ) && HighestAll(BarNumber());
AddChartBubble(SR, PreviousDayClose, "PrevClose", Color.Dark_Orange);
 
Daily Bias Statistics (Notes by JQ)

Code:
# Daily Bias Statistics
# Mobius
# Study tracks the open vs previous close and current days closing bias
# V01.07.2015

def RTHopen = open(period = AggregationPeriod.Day);  #    Today's Open     RTH is Regular Trading Hours 
def prevRTHclose = close(period = AggregationPeriod.Day)[1];    # Previous Day's close of regular trading hours
def RTHclose = close(period = AggregationPeriod.Day);    #    Today's Close     RTH is Regular Trading Hours

def countUp = if RTHopen < prevRTHclose and
                 RTHclose < RTHopen
              then countUp[1] + 1
              else countUp[1];

def countDn = if RTHopen > prevRTHclose and
                 RTHclose > RTHopen
              then countDn[1] + 1
              else countDn[1];

def barCount = compoundValue(1, barCount[1] + 1, 0);
def Pup = (barCount - countUp) / barNumber();
def Pdn = (barCount - countDn) / barNumber();
AddLabel(1, "%O < PC and C < O = " + AsPercent(Pup) +
          "  %O > PC and C > O = " + AsPercent(Pdn),
            if RTHopen < prevRTHclose and RTHclose < RTHopen
            then color.red
            else if RTHopen < prevRTHclose and RTHclose > RTHopen
                 then color.yellow
                 else color.white);
# End Code Daily Bias
 
I think this give you what you need, I'm guessing it's not exactly what you think you want. It took a bit of analysis of the Gap Zone Map before I understood that the zones aren't plotted, only the previous day's close. The gap analysis is watching how the next day's price open moves vis-a-vis the previous day's close. The Gap Zone Map delineates the probably of movement when the previous day's close is a down day or an up day. That can't be plotted, if you're going to trade this system, 1) print out the Gap Zone Map and stick it up somewhere close to your trading station so you see it every time you look up, 2) memorize the Gap Zone Map so you understand the probabilities of moving from the current day's open based on the previous day's close, and 3) buy the $14.95 book so you learn everything you can about gap analysis in the Master The Gap system. Why so harsh? I'm seeing a trend that folks, for whatever reason, aren't putting much effort into helping themselves before posting a request to the forum. So for instance, the real chart study here was the previous day close plot, I wouldn't hazard a guess as to how many requests we've gotten here for a previous day close study.

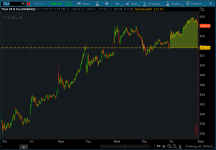
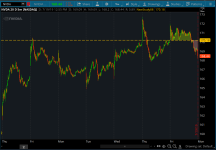
So following time honored tradition I offer yet another previous day's close study. In order to give this some value above and beyond previous such studies this one plot's the previous day's close in a big, bold orange, medium dashed line. It will plot correctly on any timeframe day or less, in other words it won't plot on weekly or monthly charts. Additionally, on intraday charts it will also plot a cloud between the previous day's close and the current price, that way you can see the progress of the gap fade, if any. This doesn't work on daily charts as the AddCloud function needs more than two days, yesterdays and today's bars to paint a cloud. But I'm betting that you're not looking to use this on daily charts. The cloud makes it easy to see the gap fade, if it occurs.

Link http://www.masterthegap.com/public/...b0ac90c5bf1f704b888f23d3fc48da92eaf9c2dfbb87a

Richard Houser

5ratG8M.png

h8jmlPx.png


thinkScript Code

Code:
# RH_PreviousDayCloseGapAnalysisSTUDY.ts
# Code by rhouser
# copyright 4/23/2013 All rights reserved.
# Permission granted to use, copy, modify to members of the Yahoo TOS_thinkscript Group

#hint:<b>RH_PreviousDayCloseGapAnalysis</b>\n
declare upper;

def lastDayToday    = if GetLastDay() == GetDay() and GetLastYear() == GetYear() then yes else no;

plot PrevDayClose   = HighestAll( if lastDayToday then close( period = "DAY" )[1] else Double.NaN );
def CurrentClose   = if lastDayToday then close else Double.NaN;

AddCloud( PrevDayClose, CurrentClose, Color.PINK, Color.LIME );

#===============================[ Look & Feel ]================================
PrevDayClose.SetDefaultColor( Color.ORANGE );
PrevDayClose.SetLineWeight( 2 );
PrevDayClose.SetStyle( Curve.MEDIUM_DASH );

Shareable Link: https://tos.mx/CgUxAS
 

Attachments

  • 5ratG8M.png
    5ratG8M.png
    88.6 KB · Views: 157
  • h8jmlPx.png
    h8jmlPx.png
    88.2 KB · Views: 179
Hi Guys, I'm trying to make a scanner that shows stock crossing previous day close. Let say it opens -1% and then it will come out on the scanner when it goes +.01%. I have a script of previous day close but its on Day time frame and it goes error when I change it to 5 min.
 
FKS6Nan.png


Code:
def agPeriod = AggregationPeriod.DAY;

def cod = close(period=agPeriod);

def prevcl= cod[1];

plot PCl= prevcl;

Is there a way to get rid of the connecting line from one day to the next? I only want the display to show the price line and not the vertical movement in post market.
 
Active break above Previous Close scanner:

Code:
# Scan forActive break above Previous Close
# Mobius
def prevClose = if getTime() crosses above RegularTradingEnd(getYYYYMMDD())
                then close
                else prevClose[1];
def Active = if SecondsTillTime(0830) > 0 and
                SecondsFromTime(0915) <= 0
             then 1
             else 0;
plot Break = Active and close crosses above prevClose;
#plot BreakoutDn = Active and close crosses below prevClose;

Percentage away from previous close:

Code:
# Scan for 1 Percent gap from Previous Close
# Scan at 5 min aggregation
# Mobius
# Chat Room Request

def PrevClose = if SecondsTillTime(1555) == 0 and
                   SecondsFromTime(1555) == 0
                then close
                else PrevClose[1];
def ScanActive = if SecondsTillTime(0930) >= 0 and
                    SecondsFromTime(0730) > 0
                 then 1
                 else 0;
def ll = if ScanActive and !ScanActive[1]
         then low
         else if !ScanActive
         then double.nan
         else if ScanActive and low < ll[1]
         then low
         else ll[1];
def hh = if ScanActive and !ScanActive[1]
         then high
         else if !ScanActive
         then double.nan
         else if ScanActive and high > hh[1]
         then high
         else hh[1];
# Comment out (#) Plot NOT wanted
plot gapUP = if ScanActive and ll > PrevClose * 1.01
             then 1
             else 0;
#plot gapDN = if ScanActive and hh < PrevClose * .99
#             then 1
#             else 0;
 
For this to work, you must have extended hours enabled, and the data is only accurate once the market is open.

Code:
# GlobeX or Overnight High / Low v.07.2017
# Mobius
# V01.2012
# V07.2017 Replaced Time Brackets with GetTime() function which works better with Mobile
# Modified by BenTen at UseThinkScript.com

input PlotOverNightExtremes = yes;

def h = high;
def l = low;
def bar = BarNumber();
def GlobeX = GetTime() < RegularTradingStart(GetYYYYMMDD());
def ONhigh = if GlobeX and !Globex[1]
             then h
             else if Globex and
                     h > ONhigh[1]
                  then h
                  else ONhigh[1];
def ONhighBar = if GlobeX and h == ONhigh
                then Bar
                else double.nan;
def ONlow = if GlobeX and !GlobeX[1]
            then l
            else if GlobeX and
                    l < ONlow[1]
                 then l
                 else ONlow[1];
def ONlowBar = if GlobeX and l == ONlow
               then Bar
               else double.nan;
def OverNightHigh = if BarNumber() == HighestAll(ONhighBar)
                    then ONhigh
                    else OverNightHigh[1];
def ONH = if OverNightHigh > 0
           then OverNightHigh
           else Double.NaN;

def prev_close = close(period = "day" )[1];

def Range = prev_close - ONH;

AddLabel(yes, Concat("Range = ", Range), color.orange);
 
Hi all, I have been trying and trying to put together two scripts and am frustrated...I just don't have a programmer's instincts I guess. Would you kindly help me with these two scripts?

1. Script that shows stocks that opened a certain percentage (let's say 5% or more) lower than yesterday's close.

2. Script that shows how many percent the stocks is down from yesterday's close at any time that I run the script. So if at 9:40 the stock is down 1%, and it shows 1% and if I run it again at 9:45 and it's down 2%, it shows 2%.

Many thanks in advance!
 
Hi Generic, thanks for your input, but I am trying to set up a scanner that shows me the list of stocks that match those criteria.
 
@shahgols There's a gap up and gap down scanner. You should also have a %change column to compare current price to previous close.

Here is the scanner code I set up.
Code:
#Wizard text: Current bar's
#Wizard input: price1
#Wizard text: gaps 
#Wizard input: percentage
#Wizard text: % or more below the previous
#Wizard input: price2

input price1 = high;
input percentage = 5.0;
input price2 = low;
def x = 1-percentage/100;
def term = x*price2[1];
plot scan = price1 <= term;
 
@shahgols This should scan for the percentage down - plot scan = close < .95*close[1];. As for the second request, I have no idea what you are trying to achieve. It sounds like a watchlist column, maybe try the built-in %Change column.

Edit: Guess @generic and I posted at the same time :ROFLMAO:
 
Thank you both, so very much! You have no idea how frustrated I have become trying to code this. I am not any good at thinkscript!!!!

Also, I apologize, my 2nd request was totally wrong, I am looking for percentage down from today's open actually. So the correct question is:

Script that shows how many percent the stocks is down from "today's open" at any time that I run the script. So if at 9:40 the stock is down 1%, and it shows 1% and if I run it again at 9:45 and it's down 2%, it shows 2%.
 
This isn't my code, but I got it from Matt Diamond on Youtube:

# input aggregationPeriod = AggregationPeriod.DAY;
input length = 1;
input displace = -1;
input showOnlyLastPeriod = no;
plot PrevDayClose;
if showOnlyLastPeriod and !IsNaN(close(period = aggregationPeriod)[-1]) { PrevDayClose = Double.NaN;
} else { PrevDayClose = Highest(close(period = aggregationPeriod)[-displace], length); }
PrevDayClose.SetDefaultColor(GetColor(9));
PrevDayClose.SetPaintingStrategy(PaintingStrategy.HORIZONTAL);
 

Join useThinkScript to post your question to a community of 21,000+ developers and traders.

Not the exact question you're looking for?

Start a new thread and receive assistance from our community.

87k+ Posts
481 Online
Create Post

The Market Trading Game Changer

Join 2,500+ subscribers inside the useThinkScript VIP Membership Club
  • Exclusive indicators
  • Proven strategies & setups
  • Private Discord community
  • ‘Buy The Dip’ signal alerts
  • Exclusive members-only content
  • Add-ons and resources
  • 1 full year of unlimited support

Frequently Asked Questions

What is useThinkScript?

useThinkScript is the #1 community of stock market investors using indicators and other tools to power their trading strategies. Traders of all skill levels use our forums to learn about scripting and indicators, help each other, and discover new ways to gain an edge in the markets.

How do I get started?

We get it. Our forum can be intimidating, if not overwhelming. With thousands of topics, tens of thousands of posts, our community has created an incredibly deep knowledge base for stock traders. No one can ever exhaust every resource provided on our site.

If you are new, or just looking for guidance, here are some helpful links to get you started.

What are the benefits of VIP Membership?
VIP members get exclusive access to these proven and tested premium indicators: Buy the Dip, Advanced Market Moves 2.0, Take Profit, and Volatility Trading Range. In addition, VIP members get access to over 50 VIP-only custom indicators, add-ons, and strategies, private VIP-only forums, private Discord channel to discuss trades and strategies in real-time, customer support, trade alerts, and much more. Learn all about VIP membership here.
How can I access the premium indicators?
To access the premium indicators, which are plug and play ready, sign up for VIP membership here.
Back
Top