Plot Previous Day Close in ThinkorSwim

ThinkScript wizards, I need your help:

So I checked both the code provided at the beginning of this page and the code from Matt Diamond I listed in my previous comment, and they are both very slightly off from the actual previous day close (<1%). If you go to style>settings>price axis>"show price as percentage" and then in your chart if you right click the last bar of the previous day and click "Set Bar as 0%" then that creates a line at the close of the previous day. The indicator created with thinkscript is usually off from that by 0.2-0.8%. I get that's close but is there anyway to make this exactly accurate?

(!) The other thing I would like to figure out is for my 0% level to automatically adjust to the Previous Day Close indicator. I could manually set it, but I would have to do that with EVERY chart I view and that is quite a hassle. Doing this allows me to see how much the stock has changed in percent from the previous day's close on the y axis.

(note you can only set the 0% level if your price axis is set to view as percentages).

Any help here would be greatly appreciated!!
Tanner
 

Join useThinkScript to post your question to a community of 21,000+ developers and traders.

Good morning,

I have previous day close, high and low code but it labels al days. I would need help in displaying only last two days high close and low levels. Can anyone help. Thanks and appreciated.

#Study:Common Level
#by thetrader.top
declare hide_on_daily;
declare once_per_bar;

input timeFrame = {default DAY, WEEK, MONTH};

plot high = If(GetAggregationPeriod() <= AggregationPeriod.FIFTEEN_MIN, high(period = timeFrame)[1], Double.NaN);
plot Low = If(GetAggregationPeriod() <= AggregationPeriod.FIFTEEN_MIN, low(period = timeFrame)[1], Double.NaN);
plot Close = If(GetAggregationPeriod() <= AggregationPeriod.FIFTEEN_MIN, close(period = timeFrame)[1], Double.NaN);

high.SetDefaultColor (Color.GREEN);
high.SetPaintingStrategy(PaintingStrategy.DASHES);
Low.SetDefaultColor(Color.RED);
Low.SetPaintingStrategy(PaintingStrategy.DASHES);
Close.SetDefaultColor (Color.GRAY);
Close.SetPaintingStrategy(PaintingStrategy.DASHES);
 
A thinkscript code to help you plot previous close to your ThinkorSwim chart. The previous day's close level is important to determine intraday directional bias.

Code:
# Previous Day Closing Price (PCL)
input aggregationPeriod = AggregationPeriod.DAY;
def close = close(period = aggregationPeriod)[1];
plot previous_close = close;
Is there a way to only show the previous day close line for only the current day.
 
  • 100 %
Reactions: KD3
A thinkscript code to help you plot previous close to your ThinkorSwim chart. The previous day's close level is important to determine intraday directional bias.

Code:
# Previous Day Closing Price (PCL)
input aggregationPeriod = AggregationPeriod.DAY;
def close = close(period = aggregationPeriod)[1];
plot previous_close = close;
as the previous post was asking. i too am wondering how to set the previous day close for RTH, not ETH. is that possible?
 
Is there a way to only show the previous day close line for only the current day.
This will plot the last RTH close from the previous day
Code:
# Previous Day Closing Price (PCL)
input showtodayonly = yes;
input aggregationPeriod = AggregationPeriod.DAY;
def pc = close(period = aggregationPeriod)[1];
plot previous_close = if showtodayonly and GetDay() != GetLastDay() then Double.NaN else pc;
previous_close.SetPaintingStrategy(PaintingStrategy.HORIZONTAL);
 
This will plot the last RTH close from the previous day
that is not working for me. im still getting 5pm EST closing price on /ES (2 hours after closing time), not 3pm EST (RTH closing time). this only works if i have afterhours turned off, which i dont want to do. any suggesting?
 
that is not working for me. im still getting 5pm EST closing price on /ES (2 hours after closing time), not 3pm EST (RTH closing time). this only works if i have afterhours turned off, which i dont want to do. any suggesting?

I have added some code that will allow you to choose the end time for the previous day.

With the displace set to 0, it will match the close of the bar at the input end. This matches the RTH close as displayed at a Daily chart setting, which does not include afterhours.

With a displace set to 1, it will match last bar's close of the intraday chart, set without afterhours, using the close of the bar prior to input end. This generally does not match the close of RTH as disclosed by close of the Daily bar,

The image shows the 2 Methods in the upperpane.
The middle pane is the intraday chart's close of the previous day.
The lower pane is the Daily chart's previous day's close, which is generally referred to as the RTHrs close, and the close of the middle pane's close with afterhours turned off.

This allows you to choose the code for whatever you feel most comfortable using.

Screenshot-2023-02-18-083257.jpg
Code:
#Method1 - Previous Day Closing Price (PCL)
input display_method1 = yes;
input showtodayonly = yes;
input aggregationPeriod = AggregationPeriod.DAY;
def pc = close(period = aggregationPeriod)[1];
plot previous_close = if showtodayonly and GetDay() != GetLastDay() then Double.NaN else pc;
previous_close.SetPaintingStrategy(PaintingStrategy.HORIZONTAL);
previous_close.SetLineWeight(2);
previous_close.SetHiding(!display_method1);

#Method2
input display_method2 = yes;
input end = 1600;
input displace = 1;
def yesterday  = GetDay() == GetLastDay() - 1;
def pclose     = if yesterday and SecondsFromTime(end) == 0 then close[displace] else pclose[1];
def pcbar      = if yesterday and SecondsFromTime(end) == 0 then BarNumber() else pcbar[1];
plot prevclose = if BarNumber() < HighestAll(pcbar) then Double.NaN else pclose;
prevclose.SetStyle(Curve.LONG_DASH);
prevclose.SetDefaultColor(Color.YELLOW);
prevclose.SetLineWeight(3);
prevclose.SetHiding(!display_method2);
 
I have added some code that will allow you to choose the end time for the previous day.

With the displace set to 0, it will match the close of the bar at the input end. This matches the RTH close as displayed at a Daily chart setting, which does not include afterhours.

With a displace set to 1, it will match last bar's close of the intraday chart, set without afterhours, using the close of the bar prior to input end. This generally does not match the close of RTH as disclosed by close of the Daily bar,

The image shows the 2 Methods in the upperpane.
The middle pane is the intraday chart's close of the previous day.
The lower pane is the Daily chart's previous day's close, which is generally referred to as the RTHrs close, and the close of the middle pane's close with afterhours turned off.

This allows you to choose the code for whatever you feel most comfortable using.
for some reason, i cant seem to get it to plot it. nothing is showing up on my chart.
 
for some reason, i cant seem to get it to plot it. nothing is showing up on my chart.

With yesterday being a holiday, it disclosed that the script needed to be more complex than that above. So this should hopefully now work if there are holidays or with or without afterhours selected to display on your chart.

Screenshot-2023-02-21-052319.png
Code:
#Previous_Day_Close_with_or_Without_AfterHours_Displayed

#Method1 - Previous Day Closing Price (PCL)
input display_method1 = yes;
input showtodayonly = yes;
input aggregationPeriod = AggregationPeriod.DAY;
def pc = close(period = aggregationPeriod)[1];
plot previous_close = if showtodayonly and GetDay() != GetLastDay() then Double.NaN else pc;
previous_close.SetPaintingStrategy(PaintingStrategy.HORIZONTAL);
previous_close.SetLineWeight(2);
previous_close.SetHiding(!display_method1);

#Method2
input display_method2 = yes;
input displace = 1;
def ymd      = GetYYYYMMDD();
def candles  = !IsNaN(close);
def capture  = candles and ymd != ymd[1];
def dayCount = CompoundValue(1, if capture then dayCount[1] + 1 else dayCount[1], 0);
def thisDay  = (HighestAll(dayCount) - dayCount) ;
def pclose   = if thisDay == 1 and
                  GetTime() crosses above RegularTradingEnd(ymd)
                then close[displace]
                else if IsNaN(pclose[1]) and
                        thisDay[1] == 1 and
                        thisDay == 0
                then close[displace]
                else pclose[1];
plot prevclose = pclose;
prevclose.SetStyle(Curve.LONG_DASH);
prevclose.SetDefaultColor(Color.YELLOW);
prevclose.SetLineWeight(3);
prevclose.SetHiding(!display_method2);
 
View attachment 4925
View attachment 4928

thinkScript Code

Code:
# RH_PreviousDayCloseGapAnalysisSTUDY.ts
# Code by rhouser
# copyright 4/23/2013 All rights reserved.
# Permission granted to use, copy, modify to members of the Yahoo TOS_thinkscript Group

#hint:<b>RH_PreviousDayCloseGapAnalysis</b>\n
declare upper;

def lastDayToday    = if GetLastDay() == GetDay() and GetLastYear() == GetYear() then yes else no;

plot PrevDayClose   = HighestAll( if lastDayToday then close( period = "DAY" )[1] else Double.NaN );
def CurrentClose   = if lastDayToday then close else Double.NaN;

AddCloud( PrevDayClose, CurrentClose, Color.PINK, Color.LIME );

#===============================[ Look & Feel ]================================
PrevDayClose.SetDefaultColor( Color.ORANGE );
PrevDayClose.SetLineWeight( 2 );
PrevDayClose.SetStyle( Curve.MEDIUM_DASH );

Shareable Link: https://tos.mx/CgUxAS

Good Day All,

Can someone please modify this code so that specific times can be used for close and or open times and have the option to see history, these additional features would be greatly appreciated.

Thank You !!!
Dorian
 
A thinkscript code to help you plot previous close to your ThinkorSwim chart. The previous day's close level is important to determine intraday directional bias.

Code:
# Previous Day Closing Price (PCL)
input aggregationPeriod = AggregationPeriod.DAY;
def close = close(period = aggregationPeriod)[1];
plot previous_close = close;


Hi @BenTen
I have used the same code to plot open of Day but it includes premarket as well can you help me plot starting only after 9:30 untill 4
 
This One @BenTen

def agg = AggregationPeriod.DAY;
plot OpenLine = open(period = agg);

OpenLine.setpaintingStrategy(paintingStrategy.LINE);
OpenLine.setlineWeight(2);
OpenLine.setdefaultColor(color.white);
#OpenLine.hideBubble();

#input aggregationPeriod = AggregationPeriod.DAY;
def close = close(period = agg)[1];
plot previous_close = close;
previous_close.setPaintingStrategy(PaintingStrategy.LINE);
previous_close.setLineWeight(2);
previous_close.setdefaultColor(color.Light_red);

I don't see anything wrong with that code. What exactly are you trying to fix?
 
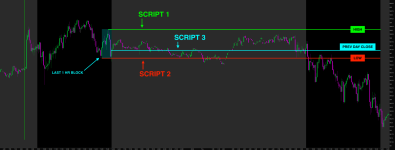
Hello! I was hoping someone could help me create a script that captures the Previous Day's Close and the high and low data from the last hour of trading for that day. I have an illustrative chart attached that shows how I would like the data to be represented. Any assistance would be greatly appreciated!
 

Attachments

  • Screenshot 2024-11-16 at 11.07.57 AM.png
    Screenshot 2024-11-16 at 11.07.57 AM.png
    89.6 KB · Views: 28

Not the exact question you're looking for?

Start a new thread and receive assistance from our community.

87k+ Posts
178 Online
Create Post

The Market Trading Game Changer

Join 2,500+ subscribers inside the useThinkScript VIP Membership Club
  • Exclusive indicators
  • Proven strategies & setups
  • Private Discord community
  • ‘Buy The Dip’ signal alerts
  • Exclusive members-only content
  • Add-ons and resources
  • 1 full year of unlimited support

Frequently Asked Questions

What is useThinkScript?

useThinkScript is the #1 community of stock market investors using indicators and other tools to power their trading strategies. Traders of all skill levels use our forums to learn about scripting and indicators, help each other, and discover new ways to gain an edge in the markets.

How do I get started?

We get it. Our forum can be intimidating, if not overwhelming. With thousands of topics, tens of thousands of posts, our community has created an incredibly deep knowledge base for stock traders. No one can ever exhaust every resource provided on our site.

If you are new, or just looking for guidance, here are some helpful links to get you started.

What are the benefits of VIP Membership?
VIP members get exclusive access to these proven and tested premium indicators: Buy the Dip, Advanced Market Moves 2.0, Take Profit, and Volatility Trading Range. In addition, VIP members get access to over 50 VIP-only custom indicators, add-ons, and strategies, private VIP-only forums, private Discord channel to discuss trades and strategies in real-time, customer support, trade alerts, and much more. Learn all about VIP membership here.
How can I access the premium indicators?
To access the premium indicators, which are plug and play ready, sign up for VIP membership here.
Back
Top