And for
@MBF. I found a trader with this script in a discord group I recently joined and was able to get him to explain it to me. This is from Signet from the Pro Option Education Discord group.
"
PUT / CALL Graph This study is a bit tricky to use and the settings are gonna seem a little complex at first, but once you get comfortable with it you will come to love it.
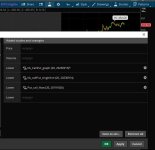
I like to set it on a 1 minute chart with other indicators like Cumulative TICK. To set the date, the format is YEAR | Month | Day & the day is always the NEXT DAY after the date you see.
Example, if I want to set this on Facebook, I know that Friday is the last trading day for the options. I would need to set the date one day later for Saturday. This study is looking back @ a lot of options series & finds the aggregate.
PUT / CALL Graph
+ (
https://tos.mx/7Tck6mY )
PUT / CALL Graph (Single Series) This is the same study, but only looks for a single expiry. + (
https://tos.mx/voWo7Hb )
ThinkScript study_20191020
ThinkScript study_20191020
Tip: watch how you set the date
Year, month, day.
Options are only gonna be intraday while market is open
"
I've spent some time messing around with the graphs tonight on OnDemand thinkorswim and can answer some basic questions if you have any with it. It takes a little bit to load after you put it in and you can mess with some of the settings to look at exactly what you're interested in. Hope this helps.
Steve

