Opening Range (ORB) Watchlist Column for ThinkorSwim

markos

Well-known member
VIP
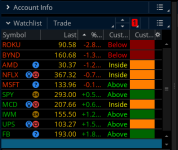
Below are two custom watchlist columns for the Opening Range Breakout indicator. Add either one to your watchlist of stocks and it will tell you which tickers are currently breaking out, breaking down, or within the trading range of the first 30mins.

Both work the same way - just visually different. First one was created by Mobius and the second one by @WalkingBallista.

e2W9TwY.png


Mobius ThinkScript Lounge 2017

Rich (BB code):
# ORB Watch List Column
input StartTime = 0930;
input EndTime = 1000;
def h = high;
def l = low;
def c = close;
def ORActive = if SecondsFromTime(StartTime) > 0 and
                   SecondsTillTime(EndTime) >= 0
                then 1
                else 0;
def ORH = if ORActive and !ORActive[1]
           then h
           else if ORActive and
                   h > ORH[1]
                then h
                else ORH[1];
def ORL = if ORActive and !ORActive[1]
           then l
           else if ORActive and
                   l < ORL[1]
                then l
                else ORL[1];
def ORhigh = if !ORActive
              then ORH
               else Double.NaN;
def ORlow = if !ORActive
              then ORL
              else Double.NaN;
AddLabel(1, if close > ORhigh
             then "Above"
             else if close < ORlow
                  then "Below"
                  else "Inside",
             if close > ORhigh
             then color.green
             else if close < ORlow
                  then color.red
                  else color.yellow);

WalkingBallista's thinkScript Code

Code:
# 30 min opening range
# Robert Payne
# WalkingBallista Watchlist

def OpenRangeMinutes = 30;
def MarketOpenTime = 0930;
input ShowTodayOnly = yes;

def Today = if GetDay() == GetLastDay() then 1 else 0;
def FirstMinute = if SecondsFromTime(MarketOpenTime) < 60 then 1 else 0;
def OpenRangeTime = if SecondsFromTime(MarketOpenTime) < 60 * OpenRangeMinutes then 1 else 0;

def ORHigh =  if FirstMinute then high else if OpenRangeTime and high > ORHigh[1] then high else ORHigh[1];
def ORLow = if FirstMinute then low else if OpenRangeTime and low < ORLow[1] then low else ORLow[1];

def OpenRangeHigh = if ShowTodayOnly and !Today then Double.NaN else if !OpenRangeTime then ORHigh else Double.NaN;
def OpenRangeLow = if ShowTodayOnly and !Today then Double.NaN else if !OpenRangeTime then ORLow else Double.NaN;

def dailyRange = high(period = "day" )[1] - low(period = "day" )[1];
def range = Average(dailyRange, 10);

plot status = if close > OpenRangeHigh then 1 else if close < OpenRangeLow then 0 else -1;
status.AssignValueColor(if status == 1 then Color.Dark_Green else if status == 0 then Color.Dark_Red else Color.Dark_Orange);
AssignBackgroundCOlor(if status == 1 then Color.Dark_Green else if status == 0 then Color.Dark_Red else Color.Dark_Orange);

Shareable Links

@BenTen contributed to this post.
 

Attachments

  • e2W9TwY.png
    e2W9TwY.png
    45.2 KB · Views: 170
Last edited:
Great. You can define a custom column with the above code. And then add this custom column into a stock watchlist. You can quickly figure out which stocks in the watchlist break out from open range.

hJ4srL5.png


ORB_StatusWatchlistColumn_JQ

Code:
##
##  Watchlist: ORB_Status_JQ
##


# All code from Mobius.above  JQ simply replaced iData with variables to reduce data calls
# 11:57 Mobius:
# Watchlist ORB Status
# Mobius
# V01 using getTIme()
# Note: Column Aggregation MUST be 30min or less

def o = open; # defs added by JQ
def h = high;
def l = low;
def c = close;
def x = barNumber();
def v = volume;


def Active = getTime() >= RegularTradingStart(getYYYYMMDD()) and
             getTime() <= RegularTradingStart(getYYYYMMDD()) + AggregationPeriod.Thirty_Min;
def hh = if Active and !Active[1]
         then h
         else if Active and h > hh[1]
         then h
         else hh[1];
def ll = if Active and !Active[1]
         then l
         else if Active and l < ll[1]
         then l
         else ll[1];
def current = if between(c, ll, hh)
              then 0
              else if c > hh
              then 1
              else if c < ll
              then -1
              else double.nan;
AddLabel(1, if current == 0
            then "In OR"
            else if current == 1
            then "ABOVE"
            else if current == -1
            then "BELOW"
            else "NAN",
            if current == 0
            then color.yellow
            else if current == 1
            then color.green
            else if current == -1
            then color.red
            else color.current);
AssignBackgroundColor( if current == 0

            then createColor(180,180,5)
            else if current == 1
            then createColor(51,102,0)
            else if current == -1
            then createColor(155,0,0)
            else color.current);
# End Code ORB Status
 
Last edited:
@ykd2018x Click on the option to Customize your watchlist column (it's the gear icon). Under the dropdown menu > select Custom Quotes > Pick one of the Custom Quotes > Delete the current setting > Switch over to thinkScript Editor > Paste either one of the code above.

0QfOuDy.png


Step 2 in the screenshot above is wrong. It's supposed to be pointing at the Delete button instead of the Edit button.
 
I tried using custom quote with the code and doesnt seem to work. Getting "above" on all stocks on watchlist.
 
Hey, can you guys piggy back on this? I use ORB ( i have a 5 minute fib one that works great. But I want to do a column like this but that also states how wide the opening rage was. As I trade options you need some distance, say your opening range was 2.75%, Like ZM today. Now, you know if it failed at the first fib, it would go back in range and potentially go to opposite side. So 2.75% on zoom is a nice payday. Any idea how I would set the text in the column to tell me how much the opening range was?

OBR autofibs https://tos.mx/tiFlbaK
 
Same problem. I'm getting above on all. I changed the script from 9:30 to 9:45 because I like the 15ORB, but still didn't work. Was above before the start of the market and all through the day.
 
@Pumper @Brethan Change to a different time frame or try a different watch list.

This is the code I have. And it works just fine. I have it set to 5 minutes at the top next to the name.

Code:
# ORB Watch List Column

input StartTime = 0930;

input EndTime = 0935;

def h = high;

def l = low;

def c = close;

def ORActive = if SecondsFromTime(StartTime) > 0 and

                   SecondsTillTime(EndTime) >= 0

                then 1

                else 0;

def ORH = if ORActive and !ORActive[1]

           then h

           else if ORActive and

                   h > ORH[1]

                then h

                else ORH[1];

def ORL = if ORActive and !ORActive[1]

           then l

           else if ORActive and

                   l < ORL[1]

                then l

                else ORL[1];

def ORhigh = if !ORActive

              then ORH

               else Double.NaN;

def ORlow = if !ORActive

              then ORL

              else Double.NaN;

AddLabel(1, if close > ORhigh

             then "Above"

             else if close < ORlow

                  then "Below"

                  else "Inside",

             if close > ORhigh

             then color.green

             else if close < ORlow

                  then color.red

                  else color.yellow);
 
@VicD I got your custom watch list code working but I still didn't get it.

Would you mind to explain the below values?
Inside
Above
Below

qES5h3w.jpg
 
If the price is inside the opening range it says Inside, if below it says below and if above it says above. You set your time period as you like. Say 5 minute range, if your price above the range will say above, if below below. If you are looking to trade trending, you buy if it breaks out from range or when it back tests OR, if below same rule, if it's breaking out and trending down or it comes back to OR an rejects you get puts or sell short whatever your cup o tea is. If it is a nice fat range you can sell for premium or trade from failure to reach or rejection of range top (or typically failed breakouts to first SD or first Fib extension. And you buy off the rejection of bottom. I trade options and one of my favorite trades is morning breakout to 2nd fib (cause if you have a certain set up that trade works like 90% of the time) and then you sell out and reverse at rejection to the lower end of range. (There is another set up, the gap and run, typically goes 3-4 fibs out of the gate but it does like a pivot and comes back to like 75% of move before it breaks out, making an opening range)

There you go I saved you on Steven Dux and Ricky Gutierrez class.
 
I trade options and one of my favorite trades is morning breakout to 2nd fib (cause if you have a certain set up that trade works like 90% of the time)

What time frame? Would you care to share a screenshot of said 2nd fib? I dont know 2nd fib, I know 38% or 61% Thanks
 
@technicallydreaming yes, but you would have to bring in the logic to put in the overnight high and low. Below is the study I use to show prior day and premarket open and close on my chart. If you edit the column to show above, below, or inside the premarket, please post it here.

Code:
# Custom Multi Plot ThinkScript by 7of9 for BRT
# edited 3/5/19

# Inputs

input PlotPreMktLinesHrsPastOpen = 0;

input PlotRegMktLinesHrsPastOpen = 0;

input PlotYesterdayMktLinesHrsPastOpen = 0;

input PlotActiveRegMktLinesOnPrevDays = 0;

input DisplayPreMarketPriceBubbles = yes;

input DisplayCurrentDayPriceBubbles = yes;

input DisplayPreviousDayPriceBubbles = yes;

# Pre market / Regular market definitions

def ExtPMOut = PlotPreMktLinesHrsPastOpen * 3610000;

def ExtRMOut = PlotRegMktLinesHrsPastOpen * 3610000;

def ExtYMOut = PlotYesterdayMktLinesHrsPastOpen * 3610000;

def MktPlot = GetLastDay() - PlotActiveRegMktLinesOnPrevDays <= GetDay() and GetLastYear() - 0 <= GetYear();

def PMhrs = RegularTradingStart (GetYYYYMMDD()) > GetTime();

def RMhrs = RegularTradingStart (GetYYYYMMDD()) < GetTime();

def PMplots = RegularTradingStart (GetYYYYMMDD()) > GetTime() - ExtPMOut;

def RMplots = RegularTradingStart (GetYYYYMMDD()) > GetTime() - ExtRMOut;

def YMplots = RegularTradingStart (GetYYYYMMDD()) > GetTime() - ExtYMOut;

def PMStart = RMhrs[1] and PMhrs;

def RMStart = PMhrs[1] and RMhrs;

def PMHigh = CompoundValue(1, if PMStart then high else if PMhrs then Max(high, PMHigh[1]) else PMHigh[1], 0);

def PMLow = CompoundValue (1, if PMStart then low else if PMhrs then Min(low, PMLow[1]) else PMLow[1], 0);

def bar = BarNumber();

def highBar = if PMhrs and high == PMHigh then bar else Double.NaN;

def lowBar = if PMhrs and low == PMLow then bar else Double.NaN;

# Current price line tracker code

plot PriceLine = HighestAll (if IsNaN(close[-1]) and !IsNaN(close) then close else Double.NaN);

PriceLine.SetDefaultColor (Color.GRAY);
PriceLine.SetStyle (Curve.SHORT_DASH);

# Pre market open code

def HidePMO = if GetAggregationPeriod() <= AggregationPeriod.FIFTEEN_MIN then yes else no;

def day = GetDay();

def PMopenBar = day != day[1];

def PMOpen = if PMopenBar then open else PMOpen[1];

plot PMO = if HidePMO and MktPlot and PMplots then PMOpen else Double.NaN;

PMO.SetDefaultColor (CreateColor (234, 136, 255));

# Pre market high code

def HidePMH = if GetAggregationPeriod() <= AggregationPeriod.FIFTEEN_MIN then yes else no;

def PMHighBar = if bar == HighestAll(highBar) then PMHigh else PMHighBar[1];

plot PMH = if HidePMH and PMplots and PMHighBar > 0 then PMHighBar else Double.NaN;

PMH.SetDefaultColor (CreateColor (116, 189, 232));

# Pre market low code

def HidePML = if GetAggregationPeriod() <= AggregationPeriod.FIFTEEN_MIN then yes else no;

def PMLowBar = if bar == HighestAll(lowBar) then PMLow else PMLowBar[1];

plot PML = if HidePML and PMplots and PMLowBar > 0 then PMLowBar else Double.NaN;

PML.SetDefaultColor (CreateColor (116, 189, 232));

# Current day open code

def HideCDO = if GetAggregationPeriod() <= AggregationPeriod.FIFTEEN_MIN then yes else no;

def CDOpen = if !day then Double.NaN else open (period = "day");

plot CDO = if HideCDO and MktPlot and RMplots then CDOpen else Double.NaN;

CDO.SetDefaultColor (Color.WHITE);
CDO.SetStyle (Curve.SHORT_DASH);

#Current day high code

def HideCDH = if GetAggregationPeriod() <= AggregationPeriod.FIFTEEN_MIN then yes else no;

def CDHigh = if !day then Double.NaN else high (period = "day");

plot CDH = if HideCDH and MktPlot and RMplots then CDHigh else Double.NaN;

CDH.SetDefaultColor (Color.GREEN);
CDH.SetStyle (Curve.SHORT_DASH);

#Current day low code

def HideCDL = if GetAggregationPeriod() <= AggregationPeriod.FIFTEEN_MIN then yes else no;

def CDLow = if !day then Double.NaN else low (period = "day");

plot CDL = if HideCDL and MktPlot and RMplots then CDLow else Double.NaN;

CDL.SetDefaultColor (Color.RED);
CDL.SetStyle (Curve.SHORT_DASH);

#Previous day high code

def HidePDH = if GetAggregationPeriod() <= AggregationPeriod.FIFTEEN_MIN then yes else no;

def PDHigh = if !day then Double.NaN else high (period = "day")[1];

plot PDH = if HidePDH and MktPlot and YMplots then PDHigh else Double.NaN;

PDH.SetDefaultColor (CreateColor (153, 255, 153));
PDH.SetStyle (Curve.SHORT_DASH);

#Previous day low code

def HidePDL = if GetAggregationPeriod() <= AggregationPeriod.FIFTEEN_MIN then yes else no;

def PDLow = if !day then Double.NaN else low (period = "day")[1];

plot PDL = if HidePDL and MktPlot and YMplots then PDLow else Double.NaN;

PDL.SetDefaultColor (CreateColor (255, 126, 156));
PDL.SetStyle (Curve.SHORT_DASH);

#Previous day close code

def HidePDC = if GetAggregationPeriod() <= AggregationPeriod.FIFTEEN_MIN then yes else no;

def PDClose = if !day then Double.NaN else close (period = "day")[1];

plot PDC = if HidePDC and MktPlot and YMplots then PDClose else Double.NaN;

PDC.SetDefaultColor (CreateColor (231, 190, 0));
PDC.SetStyle (Curve.SHORT_DASH);

#Pre market bubbles code

def PMBubbles = if GetAggregationPeriod() <= AggregationPeriod.FIFTEEN_MIN then DisplayPreMarketPriceBubbles else no;

AddChartBubble (PMopenBar and PMBubbles, PMO, ("PMO:") + PMO,
CreateColor (204, 204, 255));

AddChartBubble (highBar and PMBubbles, PMH, ("PMH:") + PMH,
CreateColor (204, 204, 255));

AddChartBubble (lowBar and PMBubbles, PML, ("PML:") + PML,
CreateColor (204, 204, 255), no);

#Current day bubbles code

def CDBubbles = if GetAggregationPeriod() <= AggregationPeriod.FIFTEEN_MIN then DisplayCurrentDayPriceBubbles else no;

def CDFirstBar = SecondsFromTime (0800) >= 0 and SecondsFromTime (0800) < 60;

AddChartBubble (CDFirstBar and CDBubbles, CDO, ("CDO:") + CDO,
CreateColor (204, 204, 255));

AddChartBubble (CDFirstBar and CDBubbles, CDH, ("CDH:") + CDH,
CreateColor (204, 204, 255));

AddChartBubble (CDFirstBar and CDBubbles, CDL, ("CDL:") + CDL,
CreateColor (204, 204, 255), no);

#Previous day bubbles code

def PDBubbles = if GetAggregationPeriod() <= AggregationPeriod.FIFTEEN_MIN then DisplayPreviousDayPriceBubbles else no;

def PDFirstBar = SecondsFromTime (0700) >= 0 and SecondsFromTime (0700) < 60;

AddChartBubble (PDFirstBar and PDBubbles, PDH, ("PDH:") + PDH,
CreateColor (204, 204, 255));

AddChartBubble (PDFirstBar and PDBubbles, PDL, ("PDL:") + PDL,
CreateColor (204, 204, 255), no);

AddChartBubble (PDFirstBar and PDBubbles, PDC, ("PDC:") + PDC,
CreateColor (204, 204, 255));

plot PMHclose = PMH;
plot ArrowUp = Crosses(close, PMHclose, CrossingDirection.ABOVE);
ArrowUp.SetPaintingStrategy(PaintingStrategy.BOOLEAN_ARROW_UP);


plot PMLclose = PML;
plot ArrowDown = Crosses(close, PMLclose, CrossingDirection.BELOW);
ArrowDown.SetPaintingStrategy(PaintingStrategy.BOOLEAN_ARROW_DOWN);

Alert(ArrowUp, " ", Alert.BAR, Sound.Chimes);
Alert(ArrowDown, " ", Alert.BAR, Sound.Bell);

@ezrollin Target levels on the fibonacci extensions are T1: 161.8% and T2 261.8%.

The logic:

Code:
input fibext1 = .272;
input fibext2 = .618;
input fibext3 = 1.618;
input fibext4 = 2.618;

I don't know how to insert image here, it asks for a URL. Alas. If you overlay the fib extensions on the 5 minute bar, it will be the exact match
 
Last edited by a moderator:

Join useThinkScript to post your question to a community of 21,000+ developers and traders.

Similar threads

Not the exact question you're looking for?

Start a new thread and receive assistance from our community.

87k+ Posts
448 Online
Create Post

Similar threads

Similar threads

The Market Trading Game Changer

Join 2,500+ subscribers inside the useThinkScript VIP Membership Club
  • Exclusive indicators
  • Proven strategies & setups
  • Private Discord community
  • ‘Buy The Dip’ signal alerts
  • Exclusive members-only content
  • Add-ons and resources
  • 1 full year of unlimited support

Frequently Asked Questions

What is useThinkScript?

useThinkScript is the #1 community of stock market investors using indicators and other tools to power their trading strategies. Traders of all skill levels use our forums to learn about scripting and indicators, help each other, and discover new ways to gain an edge in the markets.

How do I get started?

We get it. Our forum can be intimidating, if not overwhelming. With thousands of topics, tens of thousands of posts, our community has created an incredibly deep knowledge base for stock traders. No one can ever exhaust every resource provided on our site.

If you are new, or just looking for guidance, here are some helpful links to get you started.

What are the benefits of VIP Membership?
VIP members get exclusive access to these proven and tested premium indicators: Buy the Dip, Advanced Market Moves 2.0, Take Profit, and Volatility Trading Range. In addition, VIP members get access to over 50 VIP-only custom indicators, add-ons, and strategies, private VIP-only forums, private Discord channel to discuss trades and strategies in real-time, customer support, trade alerts, and much more. Learn all about VIP membership here.
How can I access the premium indicators?
To access the premium indicators, which are plug and play ready, sign up for VIP membership here.
Back
Top