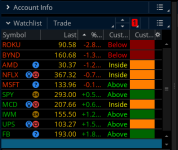
Below are two custom watchlist columns for the Opening Range Breakout indicator. Add either one to your watchlist of stocks and it will tell you which tickers are currently breaking out, breaking down, or within the trading range of the first 30mins.
Both work the same way - just visually different. First one was created by Mobius and the second one by @WalkingBallista.

Both work the same way - just visually different. First one was created by Mobius and the second one by @WalkingBallista.
Mobius ThinkScript Lounge 2017
Rich (BB code):
# ORB Watch List Column
input StartTime = 0930;
input EndTime = 1000;
def h = high;
def l = low;
def c = close;
def ORActive = if SecondsFromTime(StartTime) > 0 and
                   SecondsTillTime(EndTime) >= 0
                then 1
                else 0;
def ORH = if ORActive and !ORActive[1]
           then h
           else if ORActive and
                   h > ORH[1]
                then h
                else ORH[1];
def ORL = if ORActive and !ORActive[1]
           then l
           else if ORActive and
                   l < ORL[1]
                then l
                else ORL[1];
def ORhigh = if !ORActive
              then ORH
               else Double.NaN;
def ORlow = if !ORActive
              then ORL
              else Double.NaN;
AddLabel(1, if close > ORhigh
             then "Above"
             else if close < ORlow
                  then "Below"
                  else "Inside",
             if close > ORhigh
             then color.green
             else if close < ORlow
                  then color.red
                  else color.yellow);
WalkingBallista's thinkScript Code
Code:
# 30 min opening range
# Robert Payne
# WalkingBallista Watchlist

def OpenRangeMinutes = 30;
def MarketOpenTime = 0930;
input ShowTodayOnly = yes;

def Today = if GetDay() == GetLastDay() then 1 else 0;
def FirstMinute = if SecondsFromTime(MarketOpenTime) < 60 then 1 else 0;
def OpenRangeTime = if SecondsFromTime(MarketOpenTime) < 60 * OpenRangeMinutes then 1 else 0;

def ORHigh =  if FirstMinute then high else if OpenRangeTime and high > ORHigh[1] then high else ORHigh[1];
def ORLow = if FirstMinute then low else if OpenRangeTime and low < ORLow[1] then low else ORLow[1];

def OpenRangeHigh = if ShowTodayOnly and !Today then Double.NaN else if !OpenRangeTime then ORHigh else Double.NaN;
def OpenRangeLow = if ShowTodayOnly and !Today then Double.NaN else if !OpenRangeTime then ORLow else Double.NaN;

def dailyRange = high(period = "day" )[1] - low(period = "day" )[1];
def range = Average(dailyRange, 10);

plot status = if close > OpenRangeHigh then 1 else if close < OpenRangeLow then 0 else -1;
status.AssignValueColor(if status == 1 then Color.Dark_Green else if status == 0 then Color.Dark_Red else Color.Dark_Orange);
AssignBackgroundCOlor(if status == 1 then Color.Dark_Green else if status == 0 then Color.Dark_Red else Color.Dark_Orange);
Shareable Links
@BenTen contributed to this post.Attachments
Last edited:

