I'm wondering if someone might be able to help me add two lines to the above ORB study (Shareable Link: https://tos.mx/qu3Cu0).Recently came across this cool indicator called Opening Range Breakout by Mobius. This is more than just an indicator. There is also a strategy with risk and target lines included.
thinkScript Code
After adding the indicator, I couldn't quite understand it much. From looking at it, seems more like a support and resistance indicator to me. I watched a few YouTube videos about the Opening Range Breakout and was able to make some changes to the current code. As a result, I was able to have a clear picture of what this indicator does.
Here is my own version of it:
Rich (BB code):declare Hide_On_Daily; declare Once_per_bar; input OrMeanS = 0930.0; #hint OrMeanS: Begin Mean Period. Usually Market Open EST. input OrMeanE = 0935.0; #hint OrMeanE: End Mean period. Usually End of first bar. input OrBegin = 0930.0; #hint OrBegin: Beginning for Period of Opening Range Breakout. input OrEnd = 1000.0; #hint OrEnd: End of Period of Opening Range Breakout. input CloudOn = no; #hint CloudOn: Clouds Opening Range. input AlertOn = yes; #hint AlertOn: Alerts on cross of Opening Range. input ShowTodayOnly = {"No", default "Yes"}; input nAtr = 4; #hint nATR: Lenght for the ATR Risk and Target Lines. input AtrTargetMult = 2.0; #hint ATRmult: Multiplier for the ATR calculations. def h = high; def l = low; def c = close; def bar = barNumber(); def s = ShowTodayOnly; def ORActive = if secondsTillTime(OrMeanE) > 0 and secondsFromTime(OrMeanS) >= 0 then 1 else 0; def today = if s == 0 or getDay() == getLastDay() and secondsFromTime(OrMeanS) >= 0 then 1 else 0; def ORHigh = if ORHigh[1] == 0 or ORActive[1] == 0 and ORActive == 1 then h else if ORActive and h > ORHigh[1] then h else ORHigh[1]; def ORLow = if ORLow[1] == 0 or ORActive[1] == 0 and ORActive == 1 then l else if ORActive and l < ORLow[1] then l else ORLow[1]; def ORWidth = ORHigh - ORLow; def na = double.nan; def ORHA = if ORActive or today < 1 then na else ORHigh; def ORLA = if ORActive or today < 1 then na else ORLow; def O = ORHA - Round(((ORHA - ORLA) / 2) / TickSize(), 0) * TickSize(); def ORActive2 = if secondsTillTime(OREnd) > 0 and secondsFromTime(ORBegin) >= 0 then 1 else 0; def ORHigh2 = if ORHigh2[1] == 0 or ORActive2[1] == 0 and ORActive2 == 1 then h else if ORActive2 and h > ORHigh2[1] then h else ORHigh2[1]; def ORLow2 = if ORLow2[1] == 0 or ORActive2[1] == 0 and ORActive2 == 1 then l else if ORActive2 and l < ORLow2[1] then l else ORLow2[1]; def ORWidth2 = ORHigh2 - ORLow2; def TimeLine = if secondsTillTime(OREnd) == 0 then 1 else 0; def ORmeanBar = if !ORActive and ORActive[1] then barNumber() else ORmeanBar[1]; def ORendBar = if !ORActive2 and ORActive2[1] then barNumber() else ORendBar[1]; def ORL = if (o == 0 , na, o); plot ORLext = if barNumber() >= highestAll(ORmeanBar) then HighestAll(if isNaN(c[-1]) then ORL[1] else double.nan) else double.nan; ORLext.SetDefaultColor(color.Yellow); ORLext.SetStyle(curve.Long_DASH); ORLext.SetLineWeight(3); ORLext.HideTitle(); def ORH2 = if ORActive2 or today < 1 then na else ORHigh2; plot ORH2ext = if barNumber() >= highestAll(ORendBar) then HighestAll(if isNaN(c[-1]) then ORH2[1] else double.nan) else double.nan; ORH2ext.SetDefaultColor(color.Green); ORH2ext.SetStyle(curve.Long_DASH); ORH2ext.SetLineWeight(3); ORH2ext.HideTitle(); def ORL2 = if ORActive2 or today < 1 then na else ORLow2; plot ORL2ext = if barNumber() >= highestAll(ORendBar) then HighestAll(if isNaN(c[-1]) then ORL2[1] else double.nan) else double.nan; ORL2ext.SetDefaultColor(color.Red); ORL2ext.SetStyle(curve.Long_DASH); ORL2ext.SetLineWeight(3); ORL2ext.HideTitle(); def RelDay = (ORL - ORL2) / (ORH2 - ORL2); def dColor = if RelDay > .5 then 5 else if RelDay < .5 then 6 else 4; def pos = (ORH2 - ORL2)/10; plot d1 = if (TimeLine , ORH2, na); plot d2 = if (TimeLine , ORH2 - ( pos * 2), na); plot d3 = if (TimeLine , ORH2 - ( pos * 3), na); plot d4 = if (TimeLine , ORH2 - ( pos * 4), na); plot d5 = if (TimeLine , ORH2 - ( pos * 5), na); plot d6 = if (TimeLine , ORH2 - ( pos * 6), na); plot d7 = if (TimeLine , ORH2 - ( pos * 7), na); plot d8 = if (TimeLine , ORH2 - ( pos * 8), na); plot d9 = if (TimeLine , ORH2 - ( pos * 9), na); plot d10 = if (TimeLine ,(ORL2), na); d1.SetPaintingStrategy(PaintingStrategy.POINTS); d2.SetPaintingStrategy(PaintingStrategy.POINTS); d3.SetPaintingStrategy(PaintingStrategy.POINTS); d4.SetPaintingStrategy(PaintingStrategy.POINTS); d5.SetPaintingStrategy(PaintingStrategy.POINTS); d6.SetPaintingStrategy(PaintingStrategy.POINTS); d7.SetPaintingStrategy(PaintingStrategy.POINTS); d8.SetPaintingStrategy(PaintingStrategy.POINTS); d9.SetPaintingStrategy(PaintingStrategy.POINTS); d10.SetPaintingStrategy(PaintingStrategy.POINTS); d1.AssignValueColor(GetColor(Dcolor)); d2.AssignValueColor(GetColor(Dcolor)); d3.AssignValueColor(GetColor(Dcolor)); d4.AssignValueColor(GetColor(Dcolor)); d5.AssignValueColor(GetColor(Dcolor)); d6.AssignValueColor(GetColor(Dcolor)); d7.AssignValueColor(GetColor(Dcolor)); d8.AssignValueColor(GetColor(Dcolor)); d9.AssignValueColor(GetColor(Dcolor)); d10.AssignValueColor(GetColor(Dcolor)); d1.HideBubble(); d2.HideBubble(); d3.HideBubble(); d4.HideBubble(); d5.HideBubble(); d6.HideBubble(); d7.HideBubble(); d8.HideBubble(); d9.HideBubble(); d10.HideBubble(); d1.HideTitle(); d2.HideTitle(); d3.HideTitle(); d4.HideTitle(); d5.HideTitle(); d6.HideTitle(); d7.HideTitle(); d8.HideTitle(); d9.HideTitle(); d10.HideTitle(); addCloud(if CloudOn == yes then orl else double.nan , orl2,createColor(244,83,66), createColor(244,83,66)); addCloud(if CloudOn == yes then orl else double.nan , orh2,createColor(66,244,131), createColor(66,244,131)); # Begin Risk Algorithm # First Breakout or Breakdown bars def Bubbleloc1 = isNaN(close[-1]); def BreakoutBar = if ORActive then double.nan else if !ORActive and c crosses above ORH2 then bar else if !isNaN(BreakoutBar[1]) and c crosses ORH2 then BreakoutBar[1] else BreakoutBar[1]; def ATR = if ORActive2 then Round((Average(TrueRange(h, c, l), nATR)) / TickSize(), 0) * TickSize() else ATR[1]; def cond1 = if h > ORH2 and h[1] <= ORH2 then Round((ORH2 + (ATR * AtrTargetMult)) / TickSize(), 0) * TickSize() else cond1[1]; plot ORLriskUP = if bar >= OREndBar and !ORActive and today then HighestAll(ORH2ext - 2) else double.nan; ORLriskUP.SetStyle(Curve.Long_Dash); ORLriskUP.SetDefaultColor(Color.Green); ORLriskUP.HideTitle(); def crossUpBar = if close crosses above ORH2 then bar else double.nan; AddChartBubble(bar == HighestAll(crossUpBar), ORLriskUP, "RiskON ORH", color.green, no); plot ORLriskDN = if bar >= OREndBar and !ORActive and close < ORL then HighestAll(ORL2ext + 2) else double.nan; ORLriskDN.SetStyle(Curve.Long_Dash); ORLriskDN.SetDefaultColor(Color.Red); ORLriskDN.HideTitle(); def crossDnBar = if close crosses below ORL2ext then bar else double.nan; AddChartBubble(bar == HighestAll(crossDnBar), HighestAll(ORLriskDN), "Risk ON ORL", color.red, yes); # High Targets plot Htarget = if bar >= BreakoutBar then cond1 else double.nan; Htarget.SetPaintingStrategy(paintingStrategy.Squares); Htarget.SetLineWeight(1); Htarget.SetDefaultColor(Color.White); Htarget.HideTitle(); AddChartBubble(BubbleLoc1, Htarget, "RO", color.white, if c > Htarget then no else yes); def condHtarget2 = if c crosses above cond1 then Round((cond1 + (ATR * AtrTargetMult)) / TickSize(), 0) * TickSize() else condHtarget2[1]; plot Htarget2 = if bar >= BreakoutBar then condHtarget2 else double.nan; Htarget2.SetPaintingStrategy(PaintingStrategy.Squares); Htarget2.SetLineWeight(1); Htarget2.SetDefaultColor(Color.Plum); Htarget2.HideTitle(); AddChartBubble(BubbleLoc1, Htarget2, "2nd T", color.plum, if c > Htarget2 then no else yes); def condHtarget3 = if c crosses above condHtarget2 then Round((condHtarget2 + (ATR * AtrTargetMult)) / TickSize(), 0) * TickSize() else condHtarget3[1]; plot Htarget3 = if bar >= BreakoutBar then condHtarget3 else double.nan; Htarget3.SetPaintingStrategy(PaintingStrategy.Squares); Htarget3.SetLineWeight(1); Htarget3.SetDefaultColor(Color.Plum); Htarget3.HideTitle(); AddChartBubble(isNaN(C[-1]), Htarget3, "3rd T", color.plum, if c > Htarget3 then no else yes); def condHtarget4 = if c crosses above condHtarget3 then Round((condHtarget3 + (ATR * AtrTargetMult)) / TickSize(), 0) * TickSize() else condHtarget4[1]; plot Htarget4 = if bar >= HighestAll(BreakoutBar) then condHtarget4 else double.nan; Htarget4.SetPaintingStrategy(PaintingStrategy.Squares); Htarget4.SetLineWeight(1); Htarget4.SetDefaultColor(Color.Plum); Htarget4.HideTitle(); AddChartBubble(BubbleLoc1, Htarget4, "4th T", color.plum, if c > Htarget4 then no else yes); def condHtarget5 = if c crosses above condHtarget4 then Round((condHtarget4 + (ATR * AtrTargetMult)) / TickSize(), 0) * TickSize() else condHtarget5[1]; plot Htarget5 = if bar >= BreakoutBar then condHtarget5 else double.nan; Htarget5.SetPaintingStrategy(PaintingStrategy.Squares); Htarget5.SetLineWeight(1); Htarget5.SetDefaultColor(Color.Plum); Htarget5.HideTitle(); AddChartBubble(BubbleLoc1, Htarget5, "5th T", color.plum, if c > Htarget5 then no else yes); # Low Targets def cond2 = if L < ORL2 and L[1] >= ORL2 then Round((ORL2 - (AtrTargetMult * ATR)) / TickSize(), 0) * TickSize() else cond2[1]; plot Ltarget = if bar >= HighestAll(OREndBar) then highestAll(if isNaN(c[-1]) then cond2 else double.nan) else double.nan; Ltarget.SetPaintingStrategy(PaintingStrategy.Squares); Ltarget.SetLineWeight(1); Ltarget.SetDefaultColor(Color.White); Ltarget.HideTitle(); AddChartBubble(BubbleLoc1, cond2, "RO", color.white, if c < Ltarget then yes else no); def condLtarget2 = if c crosses below cond2 then Round((cond2 - (AtrTargetMult * ATR)) / TickSize(), 0) * TickSize() else condLtarget2[1]; plot Ltarget2 = if bar >= HighestAll(OREndBar) then highestAll(if isNaN(c[-1]) then condLtarget2 else double.nan) else double.nan; Ltarget2.SetPaintingStrategy(PaintingStrategy.Squares); Ltarget2.SetLineWeight(1); Ltarget2.SetDefaultColor(Color.Plum); Ltarget2.HideTitle(); AddChartBubble(BubbleLoc1, condLtarget2, "2nd T", color.plum, if c < condLtarget2 then yes else no); def condLtarget3 = if c crosses below condLtarget2 then Round((condLtarget2 - (AtrTargetMult * ATR)) / TickSize(), 0) * TickSize() else condLtarget3[1]; plot Ltarget3 = if bar >= HighestAll(OREndBar) then highestAll(if isNaN(c[-1]) then condLtarget3 else double.nan) else double.nan; Ltarget3.SetPaintingStrategy(PaintingStrategy.Squares); Ltarget3.SetLineWeight(1); Ltarget3.SetDefaultColor(Color.Plum); Ltarget3.HideTitle(); AddChartBubble(BubbleLoc1, condLtarget3, "3rd T", color.plum, if c < Ltarget3 then yes else no); def condLtarget4 = if c crosses condLtarget3 then Round((condLtarget3 - (AtrTargetMult * ATR)) / TickSize(), 0) * TickSize() else condLtarget4[1]; plot Ltarget4 = if bar >= HighestAll(OREndBar) then highestAll(if isNaN(c[-1]) then condLtarget4 else double.nan) else double.nan; Ltarget4.SetPaintingStrategy(PaintingStrategy.Squares); Ltarget4.SetLineWeight(1); Ltarget4.SetDefaultColor(Color.Plum); Ltarget4.HideTitle(); AddChartBubble(BubbleLoc1, condLtarget4, "4th T", color.plum, if c < Ltarget4 then yes else no); def condLtarget5 = if c crosses condLtarget4 then Round((condLtarget4 - (AtrTargetMult * ATR)) / TickSize(), 0) * TickSize() else condLtarget5[1]; plot Ltarget5 = if bar >= HighestAll(OREndBar) then highestAll(if isNaN(c[-1]) then condLtarget5 else double.nan) else double.nan; Ltarget5.SetPaintingStrategy(PaintingStrategy.Squares); Ltarget5.SetLineWeight(1); Ltarget5.SetDefaultColor(Color.Plum); Ltarget5.HideTitle(); AddChartBubble(BubbleLoc1, condLtarget5, "5th T", color.plum, if c < Ltarget5 then yes else no); def last = if secondsTillTime(1600) == 0 and secondsFromTime(1600) == 0 then c[1] else last[1]; plot LastClose = if Today and last != 0 then last else Double.NaN; LastClose.SetPaintingStrategy(PaintingStrategy.Dashes); LastClose.SetDefaultColor(Color.White); LastClose.HideBubble(); LastClose.HideTitle(); AddChartBubble(SecondsTillTime(0930) == 0, LastClose, "PC", color.gray, yes); alert(c crosses above ORH2, "", Alert.Bar, Sound.Bell); alert(c crosses below ORL2, "", Alert.Bar, Sound.Ring); # End Code ORB with Risk and targets
Shareable Link: https://tos.mx/qu3Cu0
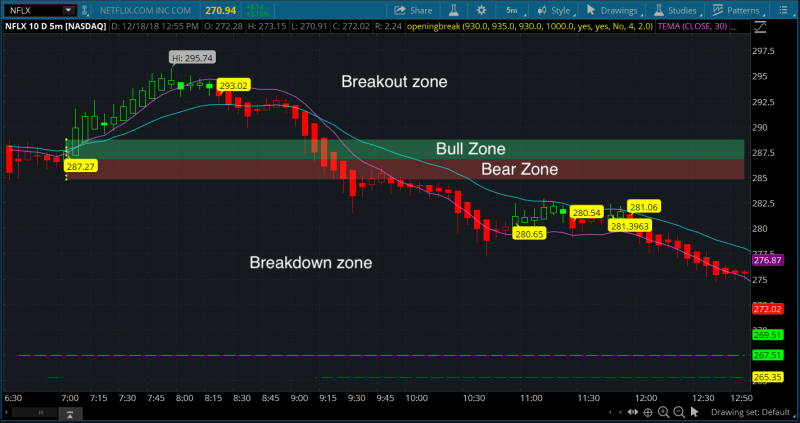
Now that you have the indicator added, let's get some terminology out of the way.
- The green shadow is called the Bull Zone
- The red shadow is called Bear Zone
- Anywhere above the Bull Zone is called the Breakout Zone
- Anywhere below the Bear Zone is called the Breakdown Zone
Hopefully you were able to understand those terms from this picture.

The Setup
- 5 or 15 minutes timeframe
- Heikin-Ashi candlestick
- Disable pre-market and after-hour market
- TEMA (30)
- EMA (20)
- Supertrend Indicator
Usage #1: Taking Advantage of Breakout Zone
Once the stock reaches above the breakout zone, we buy calls.
Usage #2: Taking Advantage of Breakdown Zone
Do the same as above. If the stock start to go from Bear Zone to breakdown zone, we start shorting it.
Usage #3: Avoid Misleading Signals given by Supertrend
A lot of people brought up a really good point about Supertrend. That is sometimes it would give false signals. And I also seen it first hand too. The Opening Range Breakout Indicator will allows us to resolve that.
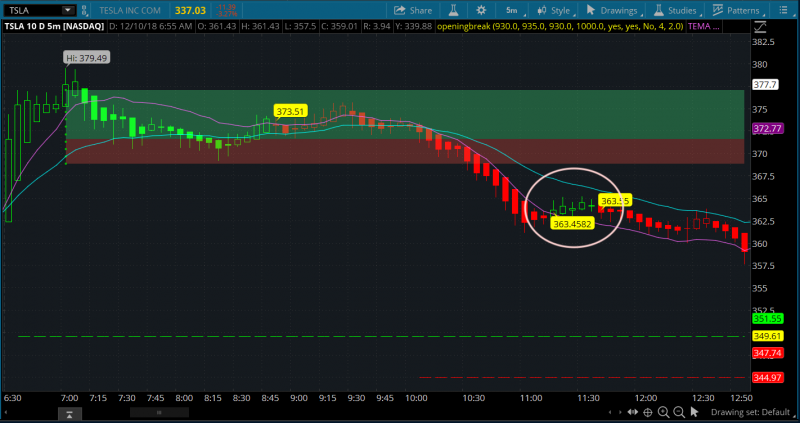
Example #1: Don't short when the candles are still in the Bull Zone.

The only time that it is reasonable to short while the candles are still in Bull Zone is: IF the candle are by the border of Bull Zone and Bear Zone. Even better if it's already crossing the border into Bear Zone.
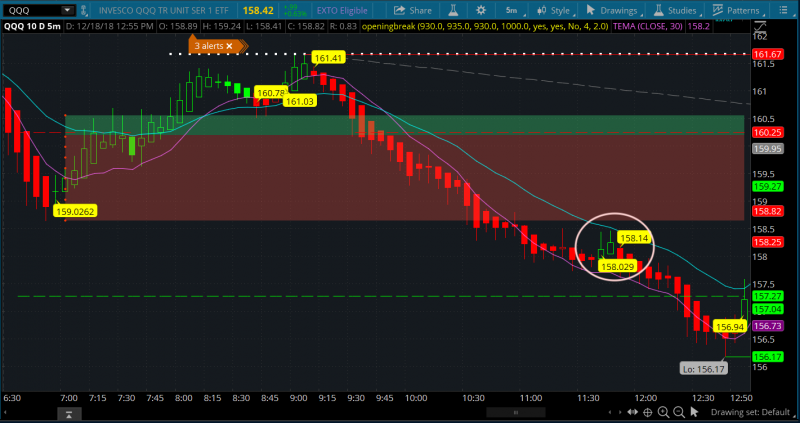
Example #2: Don't Buy Calls in Breakdown Zone
If you think the Bear Zone is worst, wait until you buy calls in the Breakdown Zone. That's a hard pass.

Again, sometimes it may be reasonable to buy calls if the candles are crossing the border going back to Bear Zone, then you may have a chance to pull thru and get above it. But anywhere between the Bear Zone and Breakdown Zone, be cautious, especially if you're already deep down in the Breakdown Zone.
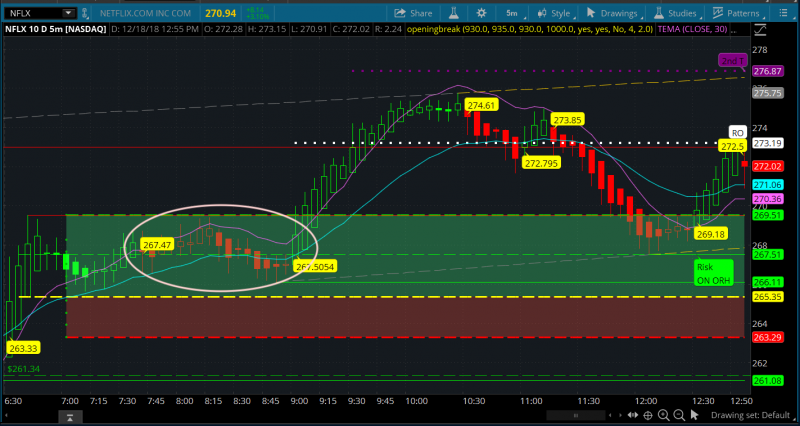
Here is another example of "don't buy calls in the Breakdown zone"

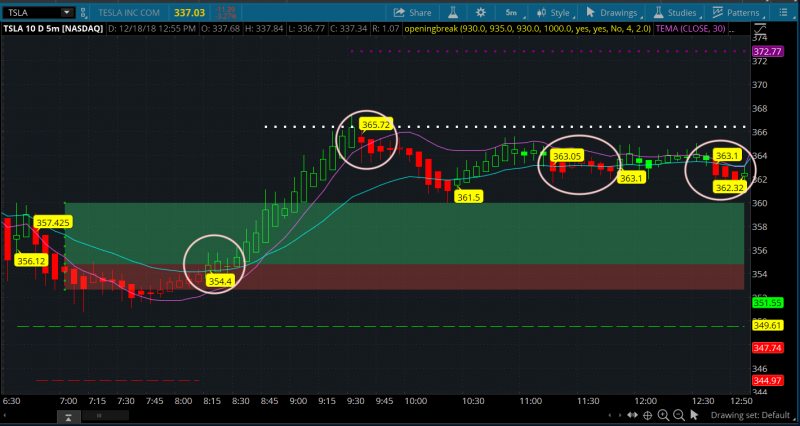
The following screenshot will tell us a few things.

- When the Supertrend is giving us a buy signal, and that candle is crossing from Bear Zone into Bull Zone, then it's potentially setting up for a call play. (circle #1)
- Unlike the rule of not buying calls when you're in Breakdown Zone, shorting when in Breakout Zone could potentially be profitable too. But only if it's reasonable. Look at circle #2. It rejected the white dotted line, which is an additional border to enter another Breakout Zone. Since it rejected the second breakout area, we could take advantage of the Supertrend signal to go short.
- Circle #3 and #4, don't short in Breakout Zone without reasonable evidence (I like to use Support and Resistance during the Breakout and Breakdown Zone).
When the Supertrend is showing a buy signal while the candle is in Bull Zone then it's fairly safe to take it. When Supertrend is showing a short signal while the candle s in Bear Zone, then it's fairly safe to short at that point. Treat these zones as the home of Bears and Bulls.
I think the concept is pretty simple and straightforward here. Give it a spin and let me know how it goes for you guys.
Feel free to post questions, ideas, or any additional finding from this indicator.
P.S: I'll let Steve talk more about the usage of TEMA and EMA when he's on.
Update: A different version with Fibonacci Levels.
Here is the scanner for anyone interested.
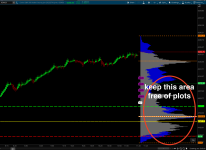
I've been trying to figure it out, but not quite getting it.
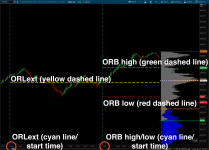
Line 1: a line exactly like ORH2ext, but instead of the highest high of the opening range...
- Have it find the highest open or highest close (use whichever value is higher)
Line 2: a line exactly like ORL2ext, but instead of the lowest low of the opening range...
- Have it find the lowest open or lowest close (use whichever value is lower)
I feel like it might just be a couple additional lines of code, but cannot quite get it right.
Thanks to anyone who can assist here!
")