
Fantastic work SleepyZ! Just Genius!!The adds :
input ORHL_S = 0930;
input ORHL_E = 0945;
def ORActiveHL = if SecondsTillTime(ORHL_E) > 0 and
SecondsFromTime(ORHL_S) >= 0
then 1
else 0;
The changes:
ORHigh/Low to be dependent on the "adds"
Last close and ORLriskUP and ORLriskDN were fixed when !onexpansion to limited plot.
Any plots that you do not want can be unchecked at the input screen.
As I do not use this indicator, please let me know if the adds/changes are not working the way you expected.
You are using an out of date browser. It may not display this or other websites correctly.
You should upgrade or use an alternative browser.
You should upgrade or use an alternative browser.
Opening Range Breakout Indicator for ThinkorSwim
- Thread starter BenTen
- Start date
First I want to thank you all that produce all these wonderful TOS indicators.Recently came across this cool indicator called Opening Range Breakout by Mobius. This is more than just an indicator. There is also a strategy with risk and target lines included.
thinkScript Code
After adding the indicator, I couldn't quite understand it much. From looking at it, seems more like a support and resistance indicator to me. I watched a few YouTube videos about the Opening Range Breakout and was able to make some changes to the current code. As a result, I was able to have a clear picture of what this indicator does.
Here is my own version of it:
Rich (BB code):declare Hide_On_Daily; declare Once_per_bar; input OrMeanS = 0930.0; #hint OrMeanS: Begin Mean Period. Usually Market Open EST. input OrMeanE = 0935.0; #hint OrMeanE: End Mean period. Usually End of first bar. input OrBegin = 0930.0; #hint OrBegin: Beginning for Period of Opening Range Breakout. input OrEnd = 1000.0; #hint OrEnd: End of Period of Opening Range Breakout. input CloudOn = no; #hint CloudOn: Clouds Opening Range. input AlertOn = yes; #hint AlertOn: Alerts on cross of Opening Range. input ShowTodayOnly = {"No", default "Yes"}; input nAtr = 4; #hint nATR: Lenght for the ATR Risk and Target Lines. input AtrTargetMult = 2.0; #hint ATRmult: Multiplier for the ATR calculations. def h = high; def l = low; def c = close; def bar = barNumber(); def s = ShowTodayOnly; def ORActive = if secondsTillTime(OrMeanE) > 0 and secondsFromTime(OrMeanS) >= 0 then 1 else 0; def today = if s == 0 or getDay() == getLastDay() and secondsFromTime(OrMeanS) >= 0 then 1 else 0; def ORHigh = if ORHigh[1] == 0 or ORActive[1] == 0 and ORActive == 1 then h else if ORActive and h > ORHigh[1] then h else ORHigh[1]; def ORLow = if ORLow[1] == 0 or ORActive[1] == 0 and ORActive == 1 then l else if ORActive and l < ORLow[1] then l else ORLow[1]; def ORWidth = ORHigh - ORLow; def na = double.nan; def ORHA = if ORActive or today < 1 then na else ORHigh; def ORLA = if ORActive or today < 1 then na else ORLow; def O = ORHA - Round(((ORHA - ORLA) / 2) / TickSize(), 0) * TickSize(); def ORActive2 = if secondsTillTime(OREnd) > 0 and secondsFromTime(ORBegin) >= 0 then 1 else 0; def ORHigh2 = if ORHigh2[1] == 0 or ORActive2[1] == 0 and ORActive2 == 1 then h else if ORActive2 and h > ORHigh2[1] then h else ORHigh2[1]; def ORLow2 = if ORLow2[1] == 0 or ORActive2[1] == 0 and ORActive2 == 1 then l else if ORActive2 and l < ORLow2[1] then l else ORLow2[1]; def ORWidth2 = ORHigh2 - ORLow2; def TimeLine = if secondsTillTime(OREnd) == 0 then 1 else 0; def ORmeanBar = if !ORActive and ORActive[1] then barNumber() else ORmeanBar[1]; def ORendBar = if !ORActive2 and ORActive2[1] then barNumber() else ORendBar[1]; def ORL = if (o == 0 , na, o); plot ORLext = if barNumber() >= highestAll(ORmeanBar) then HighestAll(if isNaN(c[-1]) then ORL[1] else double.nan) else double.nan; ORLext.SetDefaultColor(color.Yellow); ORLext.SetStyle(curve.Long_DASH); ORLext.SetLineWeight(3); ORLext.HideTitle(); def ORH2 = if ORActive2 or today < 1 then na else ORHigh2; plot ORH2ext = if barNumber() >= highestAll(ORendBar) then HighestAll(if isNaN(c[-1]) then ORH2[1] else double.nan) else double.nan; ORH2ext.SetDefaultColor(color.Green); ORH2ext.SetStyle(curve.Long_DASH); ORH2ext.SetLineWeight(3); ORH2ext.HideTitle(); def ORL2 = if ORActive2 or today < 1 then na else ORLow2; plot ORL2ext = if barNumber() >= highestAll(ORendBar) then HighestAll(if isNaN(c[-1]) then ORL2[1] else double.nan) else double.nan; ORL2ext.SetDefaultColor(color.Red); ORL2ext.SetStyle(curve.Long_DASH); ORL2ext.SetLineWeight(3); ORL2ext.HideTitle(); def RelDay = (ORL - ORL2) / (ORH2 - ORL2); def dColor = if RelDay > .5 then 5 else if RelDay < .5 then 6 else 4; def pos = (ORH2 - ORL2)/10; plot d1 = if (TimeLine , ORH2, na); plot d2 = if (TimeLine , ORH2 - ( pos * 2), na); plot d3 = if (TimeLine , ORH2 - ( pos * 3), na); plot d4 = if (TimeLine , ORH2 - ( pos * 4), na); plot d5 = if (TimeLine , ORH2 - ( pos * 5), na); plot d6 = if (TimeLine , ORH2 - ( pos * 6), na); plot d7 = if (TimeLine , ORH2 - ( pos * 7), na); plot d8 = if (TimeLine , ORH2 - ( pos * 8), na); plot d9 = if (TimeLine , ORH2 - ( pos * 9), na); plot d10 = if (TimeLine ,(ORL2), na); d1.SetPaintingStrategy(PaintingStrategy.POINTS); d2.SetPaintingStrategy(PaintingStrategy.POINTS); d3.SetPaintingStrategy(PaintingStrategy.POINTS); d4.SetPaintingStrategy(PaintingStrategy.POINTS); d5.SetPaintingStrategy(PaintingStrategy.POINTS); d6.SetPaintingStrategy(PaintingStrategy.POINTS); d7.SetPaintingStrategy(PaintingStrategy.POINTS); d8.SetPaintingStrategy(PaintingStrategy.POINTS); d9.SetPaintingStrategy(PaintingStrategy.POINTS); d10.SetPaintingStrategy(PaintingStrategy.POINTS); d1.AssignValueColor(GetColor(Dcolor)); d2.AssignValueColor(GetColor(Dcolor)); d3.AssignValueColor(GetColor(Dcolor)); d4.AssignValueColor(GetColor(Dcolor)); d5.AssignValueColor(GetColor(Dcolor)); d6.AssignValueColor(GetColor(Dcolor)); d7.AssignValueColor(GetColor(Dcolor)); d8.AssignValueColor(GetColor(Dcolor)); d9.AssignValueColor(GetColor(Dcolor)); d10.AssignValueColor(GetColor(Dcolor)); d1.HideBubble(); d2.HideBubble(); d3.HideBubble(); d4.HideBubble(); d5.HideBubble(); d6.HideBubble(); d7.HideBubble(); d8.HideBubble(); d9.HideBubble(); d10.HideBubble(); d1.HideTitle(); d2.HideTitle(); d3.HideTitle(); d4.HideTitle(); d5.HideTitle(); d6.HideTitle(); d7.HideTitle(); d8.HideTitle(); d9.HideTitle(); d10.HideTitle(); addCloud(if CloudOn == yes then orl else double.nan , orl2,createColor(244,83,66), createColor(244,83,66)); addCloud(if CloudOn == yes then orl else double.nan , orh2,createColor(66,244,131), createColor(66,244,131)); # Begin Risk Algorithm # First Breakout or Breakdown bars def Bubbleloc1 = isNaN(close[-1]); def BreakoutBar = if ORActive then double.nan else if !ORActive and c crosses above ORH2 then bar else if !isNaN(BreakoutBar[1]) and c crosses ORH2 then BreakoutBar[1] else BreakoutBar[1]; def ATR = if ORActive2 then Round((Average(TrueRange(h, c, l), nATR)) / TickSize(), 0) * TickSize() else ATR[1]; def cond1 = if h > ORH2 and h[1] <= ORH2 then Round((ORH2 + (ATR * AtrTargetMult)) / TickSize(), 0) * TickSize() else cond1[1]; plot ORLriskUP = if bar >= OREndBar and !ORActive and today then HighestAll(ORH2ext - 2) else double.nan; ORLriskUP.SetStyle(Curve.Long_Dash); ORLriskUP.SetDefaultColor(Color.Green); ORLriskUP.HideTitle(); def crossUpBar = if close crosses above ORH2 then bar else double.nan; AddChartBubble(bar == HighestAll(crossUpBar), ORLriskUP, "RiskON ORH", color.green, no); plot ORLriskDN = if bar >= OREndBar and !ORActive and close < ORL then HighestAll(ORL2ext + 2) else double.nan; ORLriskDN.SetStyle(Curve.Long_Dash); ORLriskDN.SetDefaultColor(Color.Red); ORLriskDN.HideTitle(); def crossDnBar = if close crosses below ORL2ext then bar else double.nan; AddChartBubble(bar == HighestAll(crossDnBar), HighestAll(ORLriskDN), "Risk ON ORL", color.red, yes); # High Targets plot Htarget = if bar >= BreakoutBar then cond1 else double.nan; Htarget.SetPaintingStrategy(paintingStrategy.Squares); Htarget.SetLineWeight(1); Htarget.SetDefaultColor(Color.White); Htarget.HideTitle(); AddChartBubble(BubbleLoc1, Htarget, "RO", color.white, if c > Htarget then no else yes); def condHtarget2 = if c crosses above cond1 then Round((cond1 + (ATR * AtrTargetMult)) / TickSize(), 0) * TickSize() else condHtarget2[1]; plot Htarget2 = if bar >= BreakoutBar then condHtarget2 else double.nan; Htarget2.SetPaintingStrategy(PaintingStrategy.Squares); Htarget2.SetLineWeight(1); Htarget2.SetDefaultColor(Color.Plum); Htarget2.HideTitle(); AddChartBubble(BubbleLoc1, Htarget2, "2nd T", color.plum, if c > Htarget2 then no else yes); def condHtarget3 = if c crosses above condHtarget2 then Round((condHtarget2 + (ATR * AtrTargetMult)) / TickSize(), 0) * TickSize() else condHtarget3[1]; plot Htarget3 = if bar >= BreakoutBar then condHtarget3 else double.nan; Htarget3.SetPaintingStrategy(PaintingStrategy.Squares); Htarget3.SetLineWeight(1); Htarget3.SetDefaultColor(Color.Plum); Htarget3.HideTitle(); AddChartBubble(isNaN(C[-1]), Htarget3, "3rd T", color.plum, if c > Htarget3 then no else yes); def condHtarget4 = if c crosses above condHtarget3 then Round((condHtarget3 + (ATR * AtrTargetMult)) / TickSize(), 0) * TickSize() else condHtarget4[1]; plot Htarget4 = if bar >= HighestAll(BreakoutBar) then condHtarget4 else double.nan; Htarget4.SetPaintingStrategy(PaintingStrategy.Squares); Htarget4.SetLineWeight(1); Htarget4.SetDefaultColor(Color.Plum); Htarget4.HideTitle(); AddChartBubble(BubbleLoc1, Htarget4, "4th T", color.plum, if c > Htarget4 then no else yes); def condHtarget5 = if c crosses above condHtarget4 then Round((condHtarget4 + (ATR * AtrTargetMult)) / TickSize(), 0) * TickSize() else condHtarget5[1]; plot Htarget5 = if bar >= BreakoutBar then condHtarget5 else double.nan; Htarget5.SetPaintingStrategy(PaintingStrategy.Squares); Htarget5.SetLineWeight(1); Htarget5.SetDefaultColor(Color.Plum); Htarget5.HideTitle(); AddChartBubble(BubbleLoc1, Htarget5, "5th T", color.plum, if c > Htarget5 then no else yes); # Low Targets def cond2 = if L < ORL2 and L[1] >= ORL2 then Round((ORL2 - (AtrTargetMult * ATR)) / TickSize(), 0) * TickSize() else cond2[1]; plot Ltarget = if bar >= HighestAll(OREndBar) then highestAll(if isNaN(c[-1]) then cond2 else double.nan) else double.nan; Ltarget.SetPaintingStrategy(PaintingStrategy.Squares); Ltarget.SetLineWeight(1); Ltarget.SetDefaultColor(Color.White); Ltarget.HideTitle(); AddChartBubble(BubbleLoc1, cond2, "RO", color.white, if c < Ltarget then yes else no); def condLtarget2 = if c crosses below cond2 then Round((cond2 - (AtrTargetMult * ATR)) / TickSize(), 0) * TickSize() else condLtarget2[1]; plot Ltarget2 = if bar >= HighestAll(OREndBar) then highestAll(if isNaN(c[-1]) then condLtarget2 else double.nan) else double.nan; Ltarget2.SetPaintingStrategy(PaintingStrategy.Squares); Ltarget2.SetLineWeight(1); Ltarget2.SetDefaultColor(Color.Plum); Ltarget2.HideTitle(); AddChartBubble(BubbleLoc1, condLtarget2, "2nd T", color.plum, if c < condLtarget2 then yes else no); def condLtarget3 = if c crosses below condLtarget2 then Round((condLtarget2 - (AtrTargetMult * ATR)) / TickSize(), 0) * TickSize() else condLtarget3[1]; plot Ltarget3 = if bar >= HighestAll(OREndBar) then highestAll(if isNaN(c[-1]) then condLtarget3 else double.nan) else double.nan; Ltarget3.SetPaintingStrategy(PaintingStrategy.Squares); Ltarget3.SetLineWeight(1); Ltarget3.SetDefaultColor(Color.Plum); Ltarget3.HideTitle(); AddChartBubble(BubbleLoc1, condLtarget3, "3rd T", color.plum, if c < Ltarget3 then yes else no); def condLtarget4 = if c crosses condLtarget3 then Round((condLtarget3 - (AtrTargetMult * ATR)) / TickSize(), 0) * TickSize() else condLtarget4[1]; plot Ltarget4 = if bar >= HighestAll(OREndBar) then highestAll(if isNaN(c[-1]) then condLtarget4 else double.nan) else double.nan; Ltarget4.SetPaintingStrategy(PaintingStrategy.Squares); Ltarget4.SetLineWeight(1); Ltarget4.SetDefaultColor(Color.Plum); Ltarget4.HideTitle(); AddChartBubble(BubbleLoc1, condLtarget4, "4th T", color.plum, if c < Ltarget4 then yes else no); def condLtarget5 = if c crosses condLtarget4 then Round((condLtarget4 - (AtrTargetMult * ATR)) / TickSize(), 0) * TickSize() else condLtarget5[1]; plot Ltarget5 = if bar >= HighestAll(OREndBar) then highestAll(if isNaN(c[-1]) then condLtarget5 else double.nan) else double.nan; Ltarget5.SetPaintingStrategy(PaintingStrategy.Squares); Ltarget5.SetLineWeight(1); Ltarget5.SetDefaultColor(Color.Plum); Ltarget5.HideTitle(); AddChartBubble(BubbleLoc1, condLtarget5, "5th T", color.plum, if c < Ltarget5 then yes else no); def last = if secondsTillTime(1600) == 0 and secondsFromTime(1600) == 0 then c[1] else last[1]; plot LastClose = if Today and last != 0 then last else Double.NaN; LastClose.SetPaintingStrategy(PaintingStrategy.Dashes); LastClose.SetDefaultColor(Color.White); LastClose.HideBubble(); LastClose.HideTitle(); AddChartBubble(SecondsTillTime(0930) == 0, LastClose, "PC", color.gray, yes); alert(c crosses above ORH2, "", Alert.Bar, Sound.Bell); alert(c crosses below ORL2, "", Alert.Bar, Sound.Ring); # End Code ORB with Risk and targets
Shareable Link: https://tos.mx/qu3Cu0
Now that you have the indicator added, let's get some terminology out of the way.
- The green shadow is called the Bull Zone
- The red shadow is called Bear Zone
- Anywhere above the Bull Zone is called the Breakout Zone
- Anywhere below the Bear Zone is called the Breakdown Zone
Hopefully you were able to understand those terms from this picture.
View attachment 4237
The Setup
- 5 or 15 minutes timeframe
- Heikin-Ashi candlestick
- Disable pre-market and after-hour market
- TEMA (30)
- EMA (20)
- Supertrend Indicator
Usage #1: Taking Advantage of Breakout Zone
Once the stock reaches above the breakout zone, we buy calls.
Usage #2: Taking Advantage of Breakdown Zone
Do the same as above. If the stock start to go from Bear Zone to breakdown zone, we start shorting it.
Usage #3: Avoid Misleading Signals given by Supertrend
A lot of people brought up a really good point about Supertrend. That is sometimes it would give false signals. And I also seen it first hand too. The Opening Range Breakout Indicator will allows us to resolve that.
Example #1: Don't short when the candles are still in the Bull Zone.
View attachment 4238
The only time that it is reasonable to short while the candles are still in Bull Zone is: IF the candle are by the border of Bull Zone and Bear Zone. Even better if it's already crossing the border into Bear Zone.
Example #2: Don't Buy Calls in Breakdown Zone
If you think the Bear Zone is worst, wait until you buy calls in the Breakdown Zone. That's a hard pass.
View attachment 4239
Again, sometimes it may be reasonable to buy calls if the candles are crossing the border going back to Bear Zone, then you may have a chance to pull thru and get above it. But anywhere between the Bear Zone and Breakdown Zone, be cautious, especially if you're already deep down in the Breakdown Zone.
Here is another example of "don't buy calls in the Breakdown zone"
View attachment 4240
The following screenshot will tell us a few things.
View attachment 4241
- When the Supertrend is giving us a buy signal, and that candle is crossing from Bear Zone into Bull Zone, then it's potentially setting up for a call play. (circle #1)
- Unlike the rule of not buying calls when you're in Breakdown Zone, shorting when in Breakout Zone could potentially be profitable too. But only if it's reasonable. Look at circle #2. It rejected the white dotted line, which is an additional border to enter another Breakout Zone. Since it rejected the second breakout area, we could take advantage of the Supertrend signal to go short.
- Circle #3 and #4, don't short in Breakout Zone without reasonable evidence (I like to use Support and Resistance during the Breakout and Breakdown Zone).
When the Supertrend is showing a buy signal while the candle is in Bull Zone then it's fairly safe to take it. When Supertrend is showing a short signal while the candle s in Bear Zone, then it's fairly safe to short at that point. Treat these zones as the home of Bears and Bulls.
I think the concept is pretty simple and straightforward here. Give it a spin and let me know how it goes for you guys.
Feel free to post questions, ideas, or any additional finding from this indicator.
P.S: I'll let Steve talk more about the usage of TEMA and EMA when he's on.
Update: A different version with Fibonacci Levels.
Here is the scanner for anyone interested.
My question relates to the "Open Range Breakout Indicator" (ORB) The version I'm currently using doesn't have a version number showing in the ThinkScript coding that I can find. But I think I'm using this shareable link version "Shareable Link: https://tos.mx/qu3Cu0" Which seems to be the same as the one Ben Ten wrote.
When the script is running it places a Chart Bubble of "RO" at the high and the low white square dotted horizontal lines.
Here is the Script that places the "RO" on the charting.
<AddChartBubble(Bubbleloc1, Htarget, "RO", Color.WHITE, if c > Htarget then no else yes);
<AddChartBubble(Bubbleloc2, cond2, "RO", Color.WHITE, if c < Ltarget
What does "RO" mean? I can't find a meaning in the script nor can I find any mention in all discussions of ORB indicator. Sorry if I missed it. Can someone please provide me with the meaning of "RO".
Thanks
https://usethinkscript.com/threads/...dicator-for-thinkorswim.16/page-7#post-104940First I want to thank you all that produce all these wonderful TOS indicators.
My question relates to the "Open Range Breakout Indicator" (ORB) The version I'm currently using doesn't have a version number showing in the ThinkScript coding that I can find. But I think I'm using this shareable link version "Shareable Link: https://tos.mx/qu3Cu0" Which seems to be the same as the one Ben Ten wrote.
When the script is running it places a Chart Bubble of "RO" at the high and the low white square dotted horizontal lines.
Here is the Script that places the "RO" on the charting.
<AddChartBubble(Bubbleloc1, Htarget, "RO", Color.WHITE, if c > Htarget then no else yes);
<AddChartBubble(Bubbleloc2, cond2, "RO", Color.WHITE, if c < Ltarget
What does "RO" mean? I can't find a meaning in the script nor can I find any mention in all discussions of ORB indicator. Sorry if I missed it. Can someone please provide me with the meaning of "RO".
Thanks
https://usethinkscript.com/threads/...dicator-for-thinkorswim.16/page-7#post-110987
Risk OnWhat does RO mean?
Hi! Thanks for posting this. Is there a legend where I can see what the line graph indicators at the bottom are?I added the
to the Openign Range Breakout.
- Momentum Keltner Channel
- Ultimate MACD
- VWAP
Look at the possibel trade entry:
MACD crosses aboge yellow signal line
- Price in Bull Zone
- Prive above VWAP
- Long Siganl on Momentum Keltner "green arrow"
Does that make sense?
View attachment 8468
Maybe you can add the BB Stop for taking profit
View attachment 8469
The lower study is the Ultimate MACDHi! Thanks for posting this. Is there a legend where I can see what the line graph indicators at the bottom are?
read more here:
https://usethinkscript.com/threads/ultimate-macd-indicator-for-thinkorswim.558/
What does the purple and white lines represent?Recently came across this cool indicator called Opening Range Breakout by Mobius. This is more than just an indicator. There is also a strategy with risk and target lines included.
thinkScript Code
After adding the indicator, I couldn't quite understand it much. From looking at it, seems more like a support and resistance indicator to me. I watched a few YouTube videos about the Opening Range Breakout and was able to make some changes to the current code. As a result, I was able to have a clear picture of what this indicator does.
Here is my own version of it:
Rich (BB code):declare Hide_On_Daily; declare Once_per_bar; input OrMeanS = 0930.0; #hint OrMeanS: Begin Mean Period. Usually Market Open EST. input OrMeanE = 0935.0; #hint OrMeanE: End Mean period. Usually End of first bar. input OrBegin = 0930.0; #hint OrBegin: Beginning for Period of Opening Range Breakout. input OrEnd = 1000.0; #hint OrEnd: End of Period of Opening Range Breakout. input CloudOn = no; #hint CloudOn: Clouds Opening Range. input AlertOn = yes; #hint AlertOn: Alerts on cross of Opening Range. input ShowTodayOnly = {"No", default "Yes"}; input nAtr = 4; #hint nATR: Lenght for the ATR Risk and Target Lines. input AtrTargetMult = 2.0; #hint ATRmult: Multiplier for the ATR calculations. def h = high; def l = low; def c = close; def bar = barNumber(); def s = ShowTodayOnly; def ORActive = if secondsTillTime(OrMeanE) > 0 and secondsFromTime(OrMeanS) >= 0 then 1 else 0; def today = if s == 0 or getDay() == getLastDay() and secondsFromTime(OrMeanS) >= 0 then 1 else 0; def ORHigh = if ORHigh[1] == 0 or ORActive[1] == 0 and ORActive == 1 then h else if ORActive and h > ORHigh[1] then h else ORHigh[1]; def ORLow = if ORLow[1] == 0 or ORActive[1] == 0 and ORActive == 1 then l else if ORActive and l < ORLow[1] then l else ORLow[1]; def ORWidth = ORHigh - ORLow; def na = double.nan; def ORHA = if ORActive or today < 1 then na else ORHigh; def ORLA = if ORActive or today < 1 then na else ORLow; def O = ORHA - Round(((ORHA - ORLA) / 2) / TickSize(), 0) * TickSize(); def ORActive2 = if secondsTillTime(OREnd) > 0 and secondsFromTime(ORBegin) >= 0 then 1 else 0; def ORHigh2 = if ORHigh2[1] == 0 or ORActive2[1] == 0 and ORActive2 == 1 then h else if ORActive2 and h > ORHigh2[1] then h else ORHigh2[1]; def ORLow2 = if ORLow2[1] == 0 or ORActive2[1] == 0 and ORActive2 == 1 then l else if ORActive2 and l < ORLow2[1] then l else ORLow2[1]; def ORWidth2 = ORHigh2 - ORLow2; def TimeLine = if secondsTillTime(OREnd) == 0 then 1 else 0; def ORmeanBar = if !ORActive and ORActive[1] then barNumber() else ORmeanBar[1]; def ORendBar = if !ORActive2 and ORActive2[1] then barNumber() else ORendBar[1]; def ORL = if (o == 0 , na, o); plot ORLext = if barNumber() >= highestAll(ORmeanBar) then HighestAll(if isNaN(c[-1]) then ORL[1] else double.nan) else double.nan; ORLext.SetDefaultColor(color.Yellow); ORLext.SetStyle(curve.Long_DASH); ORLext.SetLineWeight(3); ORLext.HideTitle(); def ORH2 = if ORActive2 or today < 1 then na else ORHigh2; plot ORH2ext = if barNumber() >= highestAll(ORendBar) then HighestAll(if isNaN(c[-1]) then ORH2[1] else double.nan) else double.nan; ORH2ext.SetDefaultColor(color.Green); ORH2ext.SetStyle(curve.Long_DASH); ORH2ext.SetLineWeight(3); ORH2ext.HideTitle(); def ORL2 = if ORActive2 or today < 1 then na else ORLow2; plot ORL2ext = if barNumber() >= highestAll(ORendBar) then HighestAll(if isNaN(c[-1]) then ORL2[1] else double.nan) else double.nan; ORL2ext.SetDefaultColor(color.Red); ORL2ext.SetStyle(curve.Long_DASH); ORL2ext.SetLineWeight(3); ORL2ext.HideTitle(); def RelDay = (ORL - ORL2) / (ORH2 - ORL2); def dColor = if RelDay > .5 then 5 else if RelDay < .5 then 6 else 4; def pos = (ORH2 - ORL2)/10; plot d1 = if (TimeLine , ORH2, na); plot d2 = if (TimeLine , ORH2 - ( pos * 2), na); plot d3 = if (TimeLine , ORH2 - ( pos * 3), na); plot d4 = if (TimeLine , ORH2 - ( pos * 4), na); plot d5 = if (TimeLine , ORH2 - ( pos * 5), na); plot d6 = if (TimeLine , ORH2 - ( pos * 6), na); plot d7 = if (TimeLine , ORH2 - ( pos * 7), na); plot d8 = if (TimeLine , ORH2 - ( pos * 8), na); plot d9 = if (TimeLine , ORH2 - ( pos * 9), na); plot d10 = if (TimeLine ,(ORL2), na); d1.SetPaintingStrategy(PaintingStrategy.POINTS); d2.SetPaintingStrategy(PaintingStrategy.POINTS); d3.SetPaintingStrategy(PaintingStrategy.POINTS); d4.SetPaintingStrategy(PaintingStrategy.POINTS); d5.SetPaintingStrategy(PaintingStrategy.POINTS); d6.SetPaintingStrategy(PaintingStrategy.POINTS); d7.SetPaintingStrategy(PaintingStrategy.POINTS); d8.SetPaintingStrategy(PaintingStrategy.POINTS); d9.SetPaintingStrategy(PaintingStrategy.POINTS); d10.SetPaintingStrategy(PaintingStrategy.POINTS); d1.AssignValueColor(GetColor(Dcolor)); d2.AssignValueColor(GetColor(Dcolor)); d3.AssignValueColor(GetColor(Dcolor)); d4.AssignValueColor(GetColor(Dcolor)); d5.AssignValueColor(GetColor(Dcolor)); d6.AssignValueColor(GetColor(Dcolor)); d7.AssignValueColor(GetColor(Dcolor)); d8.AssignValueColor(GetColor(Dcolor)); d9.AssignValueColor(GetColor(Dcolor)); d10.AssignValueColor(GetColor(Dcolor)); d1.HideBubble(); d2.HideBubble(); d3.HideBubble(); d4.HideBubble(); d5.HideBubble(); d6.HideBubble(); d7.HideBubble(); d8.HideBubble(); d9.HideBubble(); d10.HideBubble(); d1.HideTitle(); d2.HideTitle(); d3.HideTitle(); d4.HideTitle(); d5.HideTitle(); d6.HideTitle(); d7.HideTitle(); d8.HideTitle(); d9.HideTitle(); d10.HideTitle(); addCloud(if CloudOn == yes then orl else double.nan , orl2,createColor(244,83,66), createColor(244,83,66)); addCloud(if CloudOn == yes then orl else double.nan , orh2,createColor(66,244,131), createColor(66,244,131)); # Begin Risk Algorithm # First Breakout or Breakdown bars def Bubbleloc1 = isNaN(close[-1]); def BreakoutBar = if ORActive then double.nan else if !ORActive and c crosses above ORH2 then bar else if !isNaN(BreakoutBar[1]) and c crosses ORH2 then BreakoutBar[1] else BreakoutBar[1]; def ATR = if ORActive2 then Round((Average(TrueRange(h, c, l), nATR)) / TickSize(), 0) * TickSize() else ATR[1]; def cond1 = if h > ORH2 and h[1] <= ORH2 then Round((ORH2 + (ATR * AtrTargetMult)) / TickSize(), 0) * TickSize() else cond1[1]; plot ORLriskUP = if bar >= OREndBar and !ORActive and today then HighestAll(ORH2ext - 2) else double.nan; ORLriskUP.SetStyle(Curve.Long_Dash); ORLriskUP.SetDefaultColor(Color.Green); ORLriskUP.HideTitle(); def crossUpBar = if close crosses above ORH2 then bar else double.nan; AddChartBubble(bar == HighestAll(crossUpBar), ORLriskUP, "RiskON ORH", color.green, no); plot ORLriskDN = if bar >= OREndBar and !ORActive and close < ORL then HighestAll(ORL2ext + 2) else double.nan; ORLriskDN.SetStyle(Curve.Long_Dash); ORLriskDN.SetDefaultColor(Color.Red); ORLriskDN.HideTitle(); def crossDnBar = if close crosses below ORL2ext then bar else double.nan; AddChartBubble(bar == HighestAll(crossDnBar), HighestAll(ORLriskDN), "Risk ON ORL", color.red, yes); # High Targets plot Htarget = if bar >= BreakoutBar then cond1 else double.nan; Htarget.SetPaintingStrategy(paintingStrategy.Squares); Htarget.SetLineWeight(1); Htarget.SetDefaultColor(Color.White); Htarget.HideTitle(); AddChartBubble(BubbleLoc1, Htarget, "RO", color.white, if c > Htarget then no else yes); def condHtarget2 = if c crosses above cond1 then Round((cond1 + (ATR * AtrTargetMult)) / TickSize(), 0) * TickSize() else condHtarget2[1]; plot Htarget2 = if bar >= BreakoutBar then condHtarget2 else double.nan; Htarget2.SetPaintingStrategy(PaintingStrategy.Squares); Htarget2.SetLineWeight(1); Htarget2.SetDefaultColor(Color.Plum); Htarget2.HideTitle(); AddChartBubble(BubbleLoc1, Htarget2, "2nd T", color.plum, if c > Htarget2 then no else yes); def condHtarget3 = if c crosses above condHtarget2 then Round((condHtarget2 + (ATR * AtrTargetMult)) / TickSize(), 0) * TickSize() else condHtarget3[1]; plot Htarget3 = if bar >= BreakoutBar then condHtarget3 else double.nan; Htarget3.SetPaintingStrategy(PaintingStrategy.Squares); Htarget3.SetLineWeight(1); Htarget3.SetDefaultColor(Color.Plum); Htarget3.HideTitle(); AddChartBubble(isNaN(C[-1]), Htarget3, "3rd T", color.plum, if c > Htarget3 then no else yes); def condHtarget4 = if c crosses above condHtarget3 then Round((condHtarget3 + (ATR * AtrTargetMult)) / TickSize(), 0) * TickSize() else condHtarget4[1]; plot Htarget4 = if bar >= HighestAll(BreakoutBar) then condHtarget4 else double.nan; Htarget4.SetPaintingStrategy(PaintingStrategy.Squares); Htarget4.SetLineWeight(1); Htarget4.SetDefaultColor(Color.Plum); Htarget4.HideTitle(); AddChartBubble(BubbleLoc1, Htarget4, "4th T", color.plum, if c > Htarget4 then no else yes); def condHtarget5 = if c crosses above condHtarget4 then Round((condHtarget4 + (ATR * AtrTargetMult)) / TickSize(), 0) * TickSize() else condHtarget5[1]; plot Htarget5 = if bar >= BreakoutBar then condHtarget5 else double.nan; Htarget5.SetPaintingStrategy(PaintingStrategy.Squares); Htarget5.SetLineWeight(1); Htarget5.SetDefaultColor(Color.Plum); Htarget5.HideTitle(); AddChartBubble(BubbleLoc1, Htarget5, "5th T", color.plum, if c > Htarget5 then no else yes); # Low Targets def cond2 = if L < ORL2 and L[1] >= ORL2 then Round((ORL2 - (AtrTargetMult * ATR)) / TickSize(), 0) * TickSize() else cond2[1]; plot Ltarget = if bar >= HighestAll(OREndBar) then highestAll(if isNaN(c[-1]) then cond2 else double.nan) else double.nan; Ltarget.SetPaintingStrategy(PaintingStrategy.Squares); Ltarget.SetLineWeight(1); Ltarget.SetDefaultColor(Color.White); Ltarget.HideTitle(); AddChartBubble(BubbleLoc1, cond2, "RO", color.white, if c < Ltarget then yes else no); def condLtarget2 = if c crosses below cond2 then Round((cond2 - (AtrTargetMult * ATR)) / TickSize(), 0) * TickSize() else condLtarget2[1]; plot Ltarget2 = if bar >= HighestAll(OREndBar) then highestAll(if isNaN(c[-1]) then condLtarget2 else double.nan) else double.nan; Ltarget2.SetPaintingStrategy(PaintingStrategy.Squares); Ltarget2.SetLineWeight(1); Ltarget2.SetDefaultColor(Color.Plum); Ltarget2.HideTitle(); AddChartBubble(BubbleLoc1, condLtarget2, "2nd T", color.plum, if c < condLtarget2 then yes else no); def condLtarget3 = if c crosses below condLtarget2 then Round((condLtarget2 - (AtrTargetMult * ATR)) / TickSize(), 0) * TickSize() else condLtarget3[1]; plot Ltarget3 = if bar >= HighestAll(OREndBar) then highestAll(if isNaN(c[-1]) then condLtarget3 else double.nan) else double.nan; Ltarget3.SetPaintingStrategy(PaintingStrategy.Squares); Ltarget3.SetLineWeight(1); Ltarget3.SetDefaultColor(Color.Plum); Ltarget3.HideTitle(); AddChartBubble(BubbleLoc1, condLtarget3, "3rd T", color.plum, if c < Ltarget3 then yes else no); def condLtarget4 = if c crosses condLtarget3 then Round((condLtarget3 - (AtrTargetMult * ATR)) / TickSize(), 0) * TickSize() else condLtarget4[1]; plot Ltarget4 = if bar >= HighestAll(OREndBar) then highestAll(if isNaN(c[-1]) then condLtarget4 else double.nan) else double.nan; Ltarget4.SetPaintingStrategy(PaintingStrategy.Squares); Ltarget4.SetLineWeight(1); Ltarget4.SetDefaultColor(Color.Plum); Ltarget4.HideTitle(); AddChartBubble(BubbleLoc1, condLtarget4, "4th T", color.plum, if c < Ltarget4 then yes else no); def condLtarget5 = if c crosses condLtarget4 then Round((condLtarget4 - (AtrTargetMult * ATR)) / TickSize(), 0) * TickSize() else condLtarget5[1]; plot Ltarget5 = if bar >= HighestAll(OREndBar) then highestAll(if isNaN(c[-1]) then condLtarget5 else double.nan) else double.nan; Ltarget5.SetPaintingStrategy(PaintingStrategy.Squares); Ltarget5.SetLineWeight(1); Ltarget5.SetDefaultColor(Color.Plum); Ltarget5.HideTitle(); AddChartBubble(BubbleLoc1, condLtarget5, "5th T", color.plum, if c < Ltarget5 then yes else no); def last = if secondsTillTime(1600) == 0 and secondsFromTime(1600) == 0 then c[1] else last[1]; plot LastClose = if Today and last != 0 then last else Double.NaN; LastClose.SetPaintingStrategy(PaintingStrategy.Dashes); LastClose.SetDefaultColor(Color.White); LastClose.HideBubble(); LastClose.HideTitle(); AddChartBubble(SecondsTillTime(0930) == 0, LastClose, "PC", color.gray, yes); alert(c crosses above ORH2, "", Alert.Bar, Sound.Bell); alert(c crosses below ORL2, "", Alert.Bar, Sound.Ring); # End Code ORB with Risk and targets
Shareable Link: https://tos.mx/qu3Cu0
Now that you have the indicator added, let's get some terminology out of the way.
- The green shadow is called the Bull Zone
- The red shadow is called Bear Zone
- Anywhere above the Bull Zone is called the Breakout Zone
- Anywhere below the Bear Zone is called the Breakdown Zone
Hopefully you were able to understand those terms from this picture.
View attachment 4237
The Setup
- 5 or 15 minutes timeframe
- Heikin-Ashi candlestick
- Disable pre-market and after-hour market
- TEMA (30)
- EMA (20)
- Supertrend Indicator
Usage #1: Taking Advantage of Breakout Zone
Once the stock reaches above the breakout zone, we buy calls.
Usage #2: Taking Advantage of Breakdown Zone
Do the same as above. If the stock start to go from Bear Zone to breakdown zone, we start shorting it.
Usage #3: Avoid Misleading Signals given by Supertrend
A lot of people brought up a really good point about Supertrend. That is sometimes it would give false signals. And I also seen it first hand too. The Opening Range Breakout Indicator will allows us to resolve that.
Example #1: Don't short when the candles are still in the Bull Zone.
View attachment 4238
The only time that it is reasonable to short while the candles are still in Bull Zone is: IF the candle are by the border of Bull Zone and Bear Zone. Even better if it's already crossing the border into Bear Zone.
Example #2: Don't Buy Calls in Breakdown Zone
If you think the Bear Zone is worst, wait until you buy calls in the Breakdown Zone. That's a hard pass.
View attachment 4239
Again, sometimes it may be reasonable to buy calls if the candles are crossing the border going back to Bear Zone, then you may have a chance to pull thru and get above it. But anywhere between the Bear Zone and Breakdown Zone, be cautious, especially if you're already deep down in the Breakdown Zone.
Here is another example of "don't buy calls in the Breakdown zone"
View attachment 4240
The following screenshot will tell us a few things.
View attachment 4241
- When the Supertrend is giving us a buy signal, and that candle is crossing from Bear Zone into Bull Zone, then it's potentially setting up for a call play. (circle #1)
- Unlike the rule of not buying calls when you're in Breakdown Zone, shorting when in Breakout Zone could potentially be profitable too. But only if it's reasonable. Look at circle #2. It rejected the white dotted line, which is an additional border to enter another Breakout Zone. Since it rejected the second breakout area, we could take advantage of the Supertrend signal to go short.
- Circle #3 and #4, don't short in Breakout Zone without reasonable evidence (I like to use Support and Resistance during the Breakout and Breakdown Zone).
When the Supertrend is showing a buy signal while the candle is in Bull Zone then it's fairly safe to take it. When Supertrend is showing a short signal while the candle s in Bear Zone, then it's fairly safe to short at that point. Treat these zones as the home of Bears and Bulls.
I think the concept is pretty simple and straightforward here. Give it a spin and let me know how it goes for you guys.
Feel free to post questions, ideas, or any additional finding from this indicator.
P.S: I'll let Steve talk more about the usage of TEMA and EMA when he's on.
Update: A different version with Fibonacci Levels.
Here is
Recently came across this cool indicator called Opening Range Breakout by Mobius. This is more than just an indicator. There is also a strategy with risk and target lines included.
thinkScript Code
After adding the indicator, I couldn't quite understand it much. From looking at it, seems more like a support and resistance indicator to me. I watched a few YouTube videos about the Opening Range Breakout and was able to make some changes to the current code. As a result, I was able to have a clear picture of what this indicator does.
Here is my own version of it:
Rich (BB code):declare Hide_On_Daily; declare Once_per_bar; input OrMeanS = 0930.0; #hint OrMeanS: Begin Mean Period. Usually Market Open EST. input OrMeanE = 0935.0; #hint OrMeanE: End Mean period. Usually End of first bar. input OrBegin = 0930.0; #hint OrBegin: Beginning for Period of Opening Range Breakout. input OrEnd = 1000.0; #hint OrEnd: End of Period of Opening Range Breakout. input CloudOn = no; #hint CloudOn: Clouds Opening Range. input AlertOn = yes; #hint AlertOn: Alerts on cross of Opening Range. input ShowTodayOnly = {"No", default "Yes"}; input nAtr = 4; #hint nATR: Lenght for the ATR Risk and Target Lines. input AtrTargetMult = 2.0; #hint ATRmult: Multiplier for the ATR calculations. def h = high; def l = low; def c = close; def bar = barNumber(); def s = ShowTodayOnly; def ORActive = if secondsTillTime(OrMeanE) > 0 and secondsFromTime(OrMeanS) >= 0 then 1 else 0; def today = if s == 0 or getDay() == getLastDay() and secondsFromTime(OrMeanS) >= 0 then 1 else 0; def ORHigh = if ORHigh[1] == 0 or ORActive[1] == 0 and ORActive == 1 then h else if ORActive and h > ORHigh[1] then h else ORHigh[1]; def ORLow = if ORLow[1] == 0 or ORActive[1] == 0 and ORActive == 1 then l else if ORActive and l < ORLow[1] then l else ORLow[1]; def ORWidth = ORHigh - ORLow; def na = double.nan; def ORHA = if ORActive or today < 1 then na else ORHigh; def ORLA = if ORActive or today < 1 then na else ORLow; def O = ORHA - Round(((ORHA - ORLA) / 2) / TickSize(), 0) * TickSize(); def ORActive2 = if secondsTillTime(OREnd) > 0 and secondsFromTime(ORBegin) >= 0 then 1 else 0; def ORHigh2 = if ORHigh2[1] == 0 or ORActive2[1] == 0 and ORActive2 == 1 then h else if ORActive2 and h > ORHigh2[1] then h else ORHigh2[1]; def ORLow2 = if ORLow2[1] == 0 or ORActive2[1] == 0 and ORActive2 == 1 then l else if ORActive2 and l < ORLow2[1] then l else ORLow2[1]; def ORWidth2 = ORHigh2 - ORLow2; def TimeLine = if secondsTillTime(OREnd) == 0 then 1 else 0; def ORmeanBar = if !ORActive and ORActive[1] then barNumber() else ORmeanBar[1]; def ORendBar = if !ORActive2 and ORActive2[1] then barNumber() else ORendBar[1]; def ORL = if (o == 0 , na, o); plot ORLext = if barNumber() >= highestAll(ORmeanBar) then HighestAll(if isNaN(c[-1]) then ORL[1] else double.nan) else double.nan; ORLext.SetDefaultColor(color.Yellow); ORLext.SetStyle(curve.Long_DASH); ORLext.SetLineWeight(3); ORLext.HideTitle(); def ORH2 = if ORActive2 or today < 1 then na else ORHigh2; plot ORH2ext = if barNumber() >= highestAll(ORendBar) then HighestAll(if isNaN(c[-1]) then ORH2[1] else double.nan) else double.nan; ORH2ext.SetDefaultColor(color.Green); ORH2ext.SetStyle(curve.Long_DASH); ORH2ext.SetLineWeight(3); ORH2ext.HideTitle(); def ORL2 = if ORActive2 or today < 1 then na else ORLow2; plot ORL2ext = if barNumber() >= highestAll(ORendBar) then HighestAll(if isNaN(c[-1]) then ORL2[1] else double.nan) else double.nan; ORL2ext.SetDefaultColor(color.Red); ORL2ext.SetStyle(curve.Long_DASH); ORL2ext.SetLineWeight(3); ORL2ext.HideTitle(); def RelDay = (ORL - ORL2) / (ORH2 - ORL2); def dColor = if RelDay > .5 then 5 else if RelDay < .5 then 6 else 4; def pos = (ORH2 - ORL2)/10; plot d1 = if (TimeLine , ORH2, na); plot d2 = if (TimeLine , ORH2 - ( pos * 2), na); plot d3 = if (TimeLine , ORH2 - ( pos * 3), na); plot d4 = if (TimeLine , ORH2 - ( pos * 4), na); plot d5 = if (TimeLine , ORH2 - ( pos * 5), na); plot d6 = if (TimeLine , ORH2 - ( pos * 6), na); plot d7 = if (TimeLine , ORH2 - ( pos * 7), na); plot d8 = if (TimeLine , ORH2 - ( pos * 8), na); plot d9 = if (TimeLine , ORH2 - ( pos * 9), na); plot d10 = if (TimeLine ,(ORL2), na); d1.SetPaintingStrategy(PaintingStrategy.POINTS); d2.SetPaintingStrategy(PaintingStrategy.POINTS); d3.SetPaintingStrategy(PaintingStrategy.POINTS); d4.SetPaintingStrategy(PaintingStrategy.POINTS); d5.SetPaintingStrategy(PaintingStrategy.POINTS); d6.SetPaintingStrategy(PaintingStrategy.POINTS); d7.SetPaintingStrategy(PaintingStrategy.POINTS); d8.SetPaintingStrategy(PaintingStrategy.POINTS); d9.SetPaintingStrategy(PaintingStrategy.POINTS); d10.SetPaintingStrategy(PaintingStrategy.POINTS); d1.AssignValueColor(GetColor(Dcolor)); d2.AssignValueColor(GetColor(Dcolor)); d3.AssignValueColor(GetColor(Dcolor)); d4.AssignValueColor(GetColor(Dcolor)); d5.AssignValueColor(GetColor(Dcolor)); d6.AssignValueColor(GetColor(Dcolor)); d7.AssignValueColor(GetColor(Dcolor)); d8.AssignValueColor(GetColor(Dcolor)); d9.AssignValueColor(GetColor(Dcolor)); d10.AssignValueColor(GetColor(Dcolor)); d1.HideBubble(); d2.HideBubble(); d3.HideBubble(); d4.HideBubble(); d5.HideBubble(); d6.HideBubble(); d7.HideBubble(); d8.HideBubble(); d9.HideBubble(); d10.HideBubble(); d1.HideTitle(); d2.HideTitle(); d3.HideTitle(); d4.HideTitle(); d5.HideTitle(); d6.HideTitle(); d7.HideTitle(); d8.HideTitle(); d9.HideTitle(); d10.HideTitle(); addCloud(if CloudOn == yes then orl else double.nan , orl2,createColor(244,83,66), createColor(244,83,66)); addCloud(if CloudOn == yes then orl else double.nan , orh2,createColor(66,244,131), createColor(66,244,131)); # Begin Risk Algorithm # First Breakout or Breakdown bars def Bubbleloc1 = isNaN(close[-1]); def BreakoutBar = if ORActive then double.nan else if !ORActive and c crosses above ORH2 then bar else if !isNaN(BreakoutBar[1]) and c crosses ORH2 then BreakoutBar[1] else BreakoutBar[1]; def ATR = if ORActive2 then Round((Average(TrueRange(h, c, l), nATR)) / TickSize(), 0) * TickSize() else ATR[1]; def cond1 = if h > ORH2 and h[1] <= ORH2 then Round((ORH2 + (ATR * AtrTargetMult)) / TickSize(), 0) * TickSize() else cond1[1]; plot ORLriskUP = if bar >= OREndBar and !ORActive and today then HighestAll(ORH2ext - 2) else double.nan; ORLriskUP.SetStyle(Curve.Long_Dash); ORLriskUP.SetDefaultColor(Color.Green); ORLriskUP.HideTitle(); def crossUpBar = if close crosses above ORH2 then bar else double.nan; AddChartBubble(bar == HighestAll(crossUpBar), ORLriskUP, "RiskON ORH", color.green, no); plot ORLriskDN = if bar >= OREndBar and !ORActive and close < ORL then HighestAll(ORL2ext + 2) else double.nan; ORLriskDN.SetStyle(Curve.Long_Dash); ORLriskDN.SetDefaultColor(Color.Red); ORLriskDN.HideTitle(); def crossDnBar = if close crosses below ORL2ext then bar else double.nan; AddChartBubble(bar == HighestAll(crossDnBar), HighestAll(ORLriskDN), "Risk ON ORL", color.red, yes); # High Targets plot Htarget = if bar >= BreakoutBar then cond1 else double.nan; Htarget.SetPaintingStrategy(paintingStrategy.Squares); Htarget.SetLineWeight(1); Htarget.SetDefaultColor(Color.White); Htarget.HideTitle(); AddChartBubble(BubbleLoc1, Htarget, "RO", color.white, if c > Htarget then no else yes); def condHtarget2 = if c crosses above cond1 then Round((cond1 + (ATR * AtrTargetMult)) / TickSize(), 0) * TickSize() else condHtarget2[1]; plot Htarget2 = if bar >= BreakoutBar then condHtarget2 else double.nan; Htarget2.SetPaintingStrategy(PaintingStrategy.Squares); Htarget2.SetLineWeight(1); Htarget2.SetDefaultColor(Color.Plum); Htarget2.HideTitle(); AddChartBubble(BubbleLoc1, Htarget2, "2nd T", color.plum, if c > Htarget2 then no else yes); def condHtarget3 = if c crosses above condHtarget2 then Round((condHtarget2 + (ATR * AtrTargetMult)) / TickSize(), 0) * TickSize() else condHtarget3[1]; plot Htarget3 = if bar >= BreakoutBar then condHtarget3 else double.nan; Htarget3.SetPaintingStrategy(PaintingStrategy.Squares); Htarget3.SetLineWeight(1); Htarget3.SetDefaultColor(Color.Plum); Htarget3.HideTitle(); AddChartBubble(isNaN(C[-1]), Htarget3, "3rd T", color.plum, if c > Htarget3 then no else yes); def condHtarget4 = if c crosses above condHtarget3 then Round((condHtarget3 + (ATR * AtrTargetMult)) / TickSize(), 0) * TickSize() else condHtarget4[1]; plot Htarget4 = if bar >= HighestAll(BreakoutBar) then condHtarget4 else double.nan; Htarget4.SetPaintingStrategy(PaintingStrategy.Squares); Htarget4.SetLineWeight(1); Htarget4.SetDefaultColor(Color.Plum); Htarget4.HideTitle(); AddChartBubble(BubbleLoc1, Htarget4, "4th T", color.plum, if c > Htarget4 then no else yes); def condHtarget5 = if c crosses above condHtarget4 then Round((condHtarget4 + (ATR * AtrTargetMult)) / TickSize(), 0) * TickSize() else condHtarget5[1]; plot Htarget5 = if bar >= BreakoutBar then condHtarget5 else double.nan; Htarget5.SetPaintingStrategy(PaintingStrategy.Squares); Htarget5.SetLineWeight(1); Htarget5.SetDefaultColor(Color.Plum); Htarget5.HideTitle(); AddChartBubble(BubbleLoc1, Htarget5, "5th T", color.plum, if c > Htarget5 then no else yes); # Low Targets def cond2 = if L < ORL2 and L[1] >= ORL2 then Round((ORL2 - (AtrTargetMult * ATR)) / TickSize(), 0) * TickSize() else cond2[1]; plot Ltarget = if bar >= HighestAll(OREndBar) then highestAll(if isNaN(c[-1]) then cond2 else double.nan) else double.nan; Ltarget.SetPaintingStrategy(PaintingStrategy.Squares); Ltarget.SetLineWeight(1); Ltarget.SetDefaultColor(Color.White); Ltarget.HideTitle(); AddChartBubble(BubbleLoc1, cond2, "RO", color.white, if c < Ltarget then yes else no); def condLtarget2 = if c crosses below cond2 then Round((cond2 - (AtrTargetMult * ATR)) / TickSize(), 0) * TickSize() else condLtarget2[1]; plot Ltarget2 = if bar >= HighestAll(OREndBar) then highestAll(if isNaN(c[-1]) then condLtarget2 else double.nan) else double.nan; Ltarget2.SetPaintingStrategy(PaintingStrategy.Squares); Ltarget2.SetLineWeight(1); Ltarget2.SetDefaultColor(Color.Plum); Ltarget2.HideTitle(); AddChartBubble(BubbleLoc1, condLtarget2, "2nd T", color.plum, if c < condLtarget2 then yes else no); def condLtarget3 = if c crosses below condLtarget2 then Round((condLtarget2 - (AtrTargetMult * ATR)) / TickSize(), 0) * TickSize() else condLtarget3[1]; plot Ltarget3 = if bar >= HighestAll(OREndBar) then highestAll(if isNaN(c[-1]) then condLtarget3 else double.nan) else double.nan; Ltarget3.SetPaintingStrategy(PaintingStrategy.Squares); Ltarget3.SetLineWeight(1); Ltarget3.SetDefaultColor(Color.Plum); Ltarget3.HideTitle(); AddChartBubble(BubbleLoc1, condLtarget3, "3rd T", color.plum, if c < Ltarget3 then yes else no); def condLtarget4 = if c crosses condLtarget3 then Round((condLtarget3 - (AtrTargetMult * ATR)) / TickSize(), 0) * TickSize() else condLtarget4[1]; plot Ltarget4 = if bar >= HighestAll(OREndBar) then highestAll(if isNaN(c[-1]) then condLtarget4 else double.nan) else double.nan; Ltarget4.SetPaintingStrategy(PaintingStrategy.Squares); Ltarget4.SetLineWeight(1); Ltarget4.SetDefaultColor(Color.Plum); Ltarget4.HideTitle(); AddChartBubble(BubbleLoc1, condLtarget4, "4th T", color.plum, if c < Ltarget4 then yes else no); def condLtarget5 = if c crosses condLtarget4 then Round((condLtarget4 - (AtrTargetMult * ATR)) / TickSize(), 0) * TickSize() else condLtarget5[1]; plot Ltarget5 = if bar >= HighestAll(OREndBar) then highestAll(if isNaN(c[-1]) then condLtarget5 else double.nan) else double.nan; Ltarget5.SetPaintingStrategy(PaintingStrategy.Squares); Ltarget5.SetLineWeight(1); Ltarget5.SetDefaultColor(Color.Plum); Ltarget5.HideTitle(); AddChartBubble(BubbleLoc1, condLtarget5, "5th T", color.plum, if c < Ltarget5 then yes else no); def last = if secondsTillTime(1600) == 0 and secondsFromTime(1600) == 0 then c[1] else last[1]; plot LastClose = if Today and last != 0 then last else Double.NaN; LastClose.SetPaintingStrategy(PaintingStrategy.Dashes); LastClose.SetDefaultColor(Color.White); LastClose.HideBubble(); LastClose.HideTitle(); AddChartBubble(SecondsTillTime(0930) == 0, LastClose, "PC", color.gray, yes); alert(c crosses above ORH2, "", Alert.Bar, Sound.Bell); alert(c crosses below ORL2, "", Alert.Bar, Sound.Ring); # End Code ORB with Risk and targets
Shareable Link: https://tos.mx/qu3Cu0
Now that you have the indicator added, let's get some terminology out of the way.
- The green shadow is called the Bull Zone
- The red shadow is called Bear Zone
- Anywhere above the Bull Zone is called the Breakout Zone
- Anywhere below the Bear Zone is called the Breakdown Zone
Hopefully you were able to understand those terms from this picture.
View attachment 4237
The Setup
- 5 or 15 minutes timeframe
- Heikin-Ashi candlestick
- Disable pre-market and after-hour market
- TEMA (30)
- EMA (20)
- Supertrend Indicator
Usage #1: Taking Advantage of Breakout Zone
Once the stock reaches above the breakout zone, we buy calls.
Usage #2: Taking Advantage of Breakdown Zone
Do the same as above. If the stock start to go from Bear Zone to breakdown zone, we start shorting it.
Usage #3: Avoid Misleading Signals given by Supertrend
A lot of people brought up a really good point about Supertrend. That is sometimes it would give false signals. And I also seen it first hand too. The Opening Range Breakout Indicator will allows us to resolve that.
Example #1: Don't short when the candles are still in the Bull Zone.
View attachment 4238
The only time that it is reasonable to short while the candles are still in Bull Zone is: IF the candle are by the border of Bull Zone and Bear Zone. Even better if it's already crossing the border into Bear Zone.
Example #2: Don't Buy Calls in Breakdown Zone
If you think the Bear Zone is worst, wait until you buy calls in the Breakdown Zone. That's a hard pass.
View attachment 4239
Again, sometimes it may be reasonable to buy calls if the candles are crossing the border going back to Bear Zone, then you may have a chance to pull thru and get above it. But anywhere between the Bear Zone and Breakdown Zone, be cautious, especially if you're already deep down in the Breakdown Zone.
Here is another example of "don't buy calls in the Breakdown zone"
View attachment 4240
The following screenshot will tell us a few things.
View attachment 4241
- When the Supertrend is giving us a buy signal, and that candle is crossing from Bear Zone into Bull Zone, then it's potentially setting up for a call play. (circle #1)
- Unlike the rule of not buying calls when you're in Breakdown Zone, shorting when in Breakout Zone could potentially be profitable too. But only if it's reasonable. Look at circle #2. It rejected the white dotted line, which is an additional border to enter another Breakout Zone. Since it rejected the second breakout area, we could take advantage of the Supertrend signal to go short.
- Circle #3 and #4, don't short in Breakout Zone without reasonable evidence (I like to use Support and Resistance during the Breakout and Breakdown Zone).
When the Supertrend is showing a buy signal while the candle is in Bull Zone then it's fairly safe to take it. When Supertrend is showing a short signal while the candle s in Bear Zone, then it's fairly safe to short at that point. Treat these zones as the home of Bears and Bulls.
I think the concept is pretty simple and straightforward here. Give it a spin and let me know how it goes for you guys.
Feel free to post questions, ideas, or any additional finding from this indicator.
P.S: I'll let Steve talk more about the usage of TEMA and EMA when he's on.
Update: A different version with Fibonacci Levels.
Here is the scanner for anyone interested.
the scanner for anyone interested.
Attachments
Those are target levels.What does the purple and white lines represent?
This works greatI edited my comment as I made a strategy, I was able to get the "RO"s to appear in the past, so it works now. Here is the link to the strategy. http://tos.mx/gKt52Xc
View attachment 18145
GreenPeny
New member
Hello will this work for option chart? ThanksI added the
to the Openign Range Breakout.
- Momentum Keltner Channel
- Ultimate MACD
- VWAP
Look at the possibel trade entry:
MACD crosses aboge yellow signal line
- Price in Bull Zone
- Prive above VWAP
- Long Siganl on Momentum Keltner "green arrow"
Does that make sense?
View attachment 8468
Maybe you can add the BB Stop for taking profit
View attachment 8469
@BenTen - Can you share the chart setup ?Recently came across this cool indicator called Opening Range Breakout by Mobius. This is more than just an indicator. There is also a strategy with risk and target lines included.
thinkScript Code
After adding the indicator, I couldn't quite understand it much. From looking at it, seems more like a support and resistance indicator to me. I watched a few YouTube videos about the Opening Range Breakout and was able to make some changes to the current code. As a result, I was able to have a clear picture of what this indicator does.
Here is my own version of it:
Rich (BB code):declare Hide_On_Daily; declare Once_per_bar; input OrMeanS = 0930.0; #hint OrMeanS: Begin Mean Period. Usually Market Open EST. input OrMeanE = 0935.0; #hint OrMeanE: End Mean period. Usually End of first bar. input OrBegin = 0930.0; #hint OrBegin: Beginning for Period of Opening Range Breakout. input OrEnd = 1000.0; #hint OrEnd: End of Period of Opening Range Breakout. input CloudOn = no; #hint CloudOn: Clouds Opening Range. input AlertOn = yes; #hint AlertOn: Alerts on cross of Opening Range. input ShowTodayOnly = {"No", default "Yes"}; input nAtr = 4; #hint nATR: Lenght for the ATR Risk and Target Lines. input AtrTargetMult = 2.0; #hint ATRmult: Multiplier for the ATR calculations. def h = high; def l = low; def c = close; def bar = barNumber(); def s = ShowTodayOnly; def ORActive = if secondsTillTime(OrMeanE) > 0 and secondsFromTime(OrMeanS) >= 0 then 1 else 0; def today = if s == 0 or getDay() == getLastDay() and secondsFromTime(OrMeanS) >= 0 then 1 else 0; def ORHigh = if ORHigh[1] == 0 or ORActive[1] == 0 and ORActive == 1 then h else if ORActive and h > ORHigh[1] then h else ORHigh[1]; def ORLow = if ORLow[1] == 0 or ORActive[1] == 0 and ORActive == 1 then l else if ORActive and l < ORLow[1] then l else ORLow[1]; def ORWidth = ORHigh - ORLow; def na = double.nan; def ORHA = if ORActive or today < 1 then na else ORHigh; def ORLA = if ORActive or today < 1 then na else ORLow; def O = ORHA - Round(((ORHA - ORLA) / 2) / TickSize(), 0) * TickSize(); def ORActive2 = if secondsTillTime(OREnd) > 0 and secondsFromTime(ORBegin) >= 0 then 1 else 0; def ORHigh2 = if ORHigh2[1] == 0 or ORActive2[1] == 0 and ORActive2 == 1 then h else if ORActive2 and h > ORHigh2[1] then h else ORHigh2[1]; def ORLow2 = if ORLow2[1] == 0 or ORActive2[1] == 0 and ORActive2 == 1 then l else if ORActive2 and l < ORLow2[1] then l else ORLow2[1]; def ORWidth2 = ORHigh2 - ORLow2; def TimeLine = if secondsTillTime(OREnd) == 0 then 1 else 0; def ORmeanBar = if !ORActive and ORActive[1] then barNumber() else ORmeanBar[1]; def ORendBar = if !ORActive2 and ORActive2[1] then barNumber() else ORendBar[1]; def ORL = if (o == 0 , na, o); plot ORLext = if barNumber() >= highestAll(ORmeanBar) then HighestAll(if isNaN(c[-1]) then ORL[1] else double.nan) else double.nan; ORLext.SetDefaultColor(color.Yellow); ORLext.SetStyle(curve.Long_DASH); ORLext.SetLineWeight(3); ORLext.HideTitle(); def ORH2 = if ORActive2 or today < 1 then na else ORHigh2; plot ORH2ext = if barNumber() >= highestAll(ORendBar) then HighestAll(if isNaN(c[-1]) then ORH2[1] else double.nan) else double.nan; ORH2ext.SetDefaultColor(color.Green); ORH2ext.SetStyle(curve.Long_DASH); ORH2ext.SetLineWeight(3); ORH2ext.HideTitle(); def ORL2 = if ORActive2 or today < 1 then na else ORLow2; plot ORL2ext = if barNumber() >= highestAll(ORendBar) then HighestAll(if isNaN(c[-1]) then ORL2[1] else double.nan) else double.nan; ORL2ext.SetDefaultColor(color.Red); ORL2ext.SetStyle(curve.Long_DASH); ORL2ext.SetLineWeight(3); ORL2ext.HideTitle(); def RelDay = (ORL - ORL2) / (ORH2 - ORL2); def dColor = if RelDay > .5 then 5 else if RelDay < .5 then 6 else 4; def pos = (ORH2 - ORL2)/10; plot d1 = if (TimeLine , ORH2, na); plot d2 = if (TimeLine , ORH2 - ( pos * 2), na); plot d3 = if (TimeLine , ORH2 - ( pos * 3), na); plot d4 = if (TimeLine , ORH2 - ( pos * 4), na); plot d5 = if (TimeLine , ORH2 - ( pos * 5), na); plot d6 = if (TimeLine , ORH2 - ( pos * 6), na); plot d7 = if (TimeLine , ORH2 - ( pos * 7), na); plot d8 = if (TimeLine , ORH2 - ( pos * 8), na); plot d9 = if (TimeLine , ORH2 - ( pos * 9), na); plot d10 = if (TimeLine ,(ORL2), na); d1.SetPaintingStrategy(PaintingStrategy.POINTS); d2.SetPaintingStrategy(PaintingStrategy.POINTS); d3.SetPaintingStrategy(PaintingStrategy.POINTS); d4.SetPaintingStrategy(PaintingStrategy.POINTS); d5.SetPaintingStrategy(PaintingStrategy.POINTS); d6.SetPaintingStrategy(PaintingStrategy.POINTS); d7.SetPaintingStrategy(PaintingStrategy.POINTS); d8.SetPaintingStrategy(PaintingStrategy.POINTS); d9.SetPaintingStrategy(PaintingStrategy.POINTS); d10.SetPaintingStrategy(PaintingStrategy.POINTS); d1.AssignValueColor(GetColor(Dcolor)); d2.AssignValueColor(GetColor(Dcolor)); d3.AssignValueColor(GetColor(Dcolor)); d4.AssignValueColor(GetColor(Dcolor)); d5.AssignValueColor(GetColor(Dcolor)); d6.AssignValueColor(GetColor(Dcolor)); d7.AssignValueColor(GetColor(Dcolor)); d8.AssignValueColor(GetColor(Dcolor)); d9.AssignValueColor(GetColor(Dcolor)); d10.AssignValueColor(GetColor(Dcolor)); d1.HideBubble(); d2.HideBubble(); d3.HideBubble(); d4.HideBubble(); d5.HideBubble(); d6.HideBubble(); d7.HideBubble(); d8.HideBubble(); d9.HideBubble(); d10.HideBubble(); d1.HideTitle(); d2.HideTitle(); d3.HideTitle(); d4.HideTitle(); d5.HideTitle(); d6.HideTitle(); d7.HideTitle(); d8.HideTitle(); d9.HideTitle(); d10.HideTitle(); addCloud(if CloudOn == yes then orl else double.nan , orl2,createColor(244,83,66), createColor(244,83,66)); addCloud(if CloudOn == yes then orl else double.nan , orh2,createColor(66,244,131), createColor(66,244,131)); # Begin Risk Algorithm # First Breakout or Breakdown bars def Bubbleloc1 = isNaN(close[-1]); def BreakoutBar = if ORActive then double.nan else if !ORActive and c crosses above ORH2 then bar else if !isNaN(BreakoutBar[1]) and c crosses ORH2 then BreakoutBar[1] else BreakoutBar[1]; def ATR = if ORActive2 then Round((Average(TrueRange(h, c, l), nATR)) / TickSize(), 0) * TickSize() else ATR[1]; def cond1 = if h > ORH2 and h[1] <= ORH2 then Round((ORH2 + (ATR * AtrTargetMult)) / TickSize(), 0) * TickSize() else cond1[1]; plot ORLriskUP = if bar >= OREndBar and !ORActive and today then HighestAll(ORH2ext - 2) else double.nan; ORLriskUP.SetStyle(Curve.Long_Dash); ORLriskUP.SetDefaultColor(Color.Green); ORLriskUP.HideTitle(); def crossUpBar = if close crosses above ORH2 then bar else double.nan; AddChartBubble(bar == HighestAll(crossUpBar), ORLriskUP, "RiskON ORH", color.green, no); plot ORLriskDN = if bar >= OREndBar and !ORActive and close < ORL then HighestAll(ORL2ext + 2) else double.nan; ORLriskDN.SetStyle(Curve.Long_Dash); ORLriskDN.SetDefaultColor(Color.Red); ORLriskDN.HideTitle(); def crossDnBar = if close crosses below ORL2ext then bar else double.nan; AddChartBubble(bar == HighestAll(crossDnBar), HighestAll(ORLriskDN), "Risk ON ORL", color.red, yes); # High Targets plot Htarget = if bar >= BreakoutBar then cond1 else double.nan; Htarget.SetPaintingStrategy(paintingStrategy.Squares); Htarget.SetLineWeight(1); Htarget.SetDefaultColor(Color.White); Htarget.HideTitle(); AddChartBubble(BubbleLoc1, Htarget, "RO", color.white, if c > Htarget then no else yes); def condHtarget2 = if c crosses above cond1 then Round((cond1 + (ATR * AtrTargetMult)) / TickSize(), 0) * TickSize() else condHtarget2[1]; plot Htarget2 = if bar >= BreakoutBar then condHtarget2 else double.nan; Htarget2.SetPaintingStrategy(PaintingStrategy.Squares); Htarget2.SetLineWeight(1); Htarget2.SetDefaultColor(Color.Plum); Htarget2.HideTitle(); AddChartBubble(BubbleLoc1, Htarget2, "2nd T", color.plum, if c > Htarget2 then no else yes); def condHtarget3 = if c crosses above condHtarget2 then Round((condHtarget2 + (ATR * AtrTargetMult)) / TickSize(), 0) * TickSize() else condHtarget3[1]; plot Htarget3 = if bar >= BreakoutBar then condHtarget3 else double.nan; Htarget3.SetPaintingStrategy(PaintingStrategy.Squares); Htarget3.SetLineWeight(1); Htarget3.SetDefaultColor(Color.Plum); Htarget3.HideTitle(); AddChartBubble(isNaN(C[-1]), Htarget3, "3rd T", color.plum, if c > Htarget3 then no else yes); def condHtarget4 = if c crosses above condHtarget3 then Round((condHtarget3 + (ATR * AtrTargetMult)) / TickSize(), 0) * TickSize() else condHtarget4[1]; plot Htarget4 = if bar >= HighestAll(BreakoutBar) then condHtarget4 else double.nan; Htarget4.SetPaintingStrategy(PaintingStrategy.Squares); Htarget4.SetLineWeight(1); Htarget4.SetDefaultColor(Color.Plum); Htarget4.HideTitle(); AddChartBubble(BubbleLoc1, Htarget4, "4th T", color.plum, if c > Htarget4 then no else yes); def condHtarget5 = if c crosses above condHtarget4 then Round((condHtarget4 + (ATR * AtrTargetMult)) / TickSize(), 0) * TickSize() else condHtarget5[1]; plot Htarget5 = if bar >= BreakoutBar then condHtarget5 else double.nan; Htarget5.SetPaintingStrategy(PaintingStrategy.Squares); Htarget5.SetLineWeight(1); Htarget5.SetDefaultColor(Color.Plum); Htarget5.HideTitle(); AddChartBubble(BubbleLoc1, Htarget5, "5th T", color.plum, if c > Htarget5 then no else yes); # Low Targets def cond2 = if L < ORL2 and L[1] >= ORL2 then Round((ORL2 - (AtrTargetMult * ATR)) / TickSize(), 0) * TickSize() else cond2[1]; plot Ltarget = if bar >= HighestAll(OREndBar) then highestAll(if isNaN(c[-1]) then cond2 else double.nan) else double.nan; Ltarget.SetPaintingStrategy(PaintingStrategy.Squares); Ltarget.SetLineWeight(1); Ltarget.SetDefaultColor(Color.White); Ltarget.HideTitle(); AddChartBubble(BubbleLoc1, cond2, "RO", color.white, if c < Ltarget then yes else no); def condLtarget2 = if c crosses below cond2 then Round((cond2 - (AtrTargetMult * ATR)) / TickSize(), 0) * TickSize() else condLtarget2[1]; plot Ltarget2 = if bar >= HighestAll(OREndBar) then highestAll(if isNaN(c[-1]) then condLtarget2 else double.nan) else double.nan; Ltarget2.SetPaintingStrategy(PaintingStrategy.Squares); Ltarget2.SetLineWeight(1); Ltarget2.SetDefaultColor(Color.Plum); Ltarget2.HideTitle(); AddChartBubble(BubbleLoc1, condLtarget2, "2nd T", color.plum, if c < condLtarget2 then yes else no); def condLtarget3 = if c crosses below condLtarget2 then Round((condLtarget2 - (AtrTargetMult * ATR)) / TickSize(), 0) * TickSize() else condLtarget3[1]; plot Ltarget3 = if bar >= HighestAll(OREndBar) then highestAll(if isNaN(c[-1]) then condLtarget3 else double.nan) else double.nan; Ltarget3.SetPaintingStrategy(PaintingStrategy.Squares); Ltarget3.SetLineWeight(1); Ltarget3.SetDefaultColor(Color.Plum); Ltarget3.HideTitle(); AddChartBubble(BubbleLoc1, condLtarget3, "3rd T", color.plum, if c < Ltarget3 then yes else no); def condLtarget4 = if c crosses condLtarget3 then Round((condLtarget3 - (AtrTargetMult * ATR)) / TickSize(), 0) * TickSize() else condLtarget4[1]; plot Ltarget4 = if bar >= HighestAll(OREndBar) then highestAll(if isNaN(c[-1]) then condLtarget4 else double.nan) else double.nan; Ltarget4.SetPaintingStrategy(PaintingStrategy.Squares); Ltarget4.SetLineWeight(1); Ltarget4.SetDefaultColor(Color.Plum); Ltarget4.HideTitle(); AddChartBubble(BubbleLoc1, condLtarget4, "4th T", color.plum, if c < Ltarget4 then yes else no); def condLtarget5 = if c crosses condLtarget4 then Round((condLtarget4 - (AtrTargetMult * ATR)) / TickSize(), 0) * TickSize() else condLtarget5[1]; plot Ltarget5 = if bar >= HighestAll(OREndBar) then highestAll(if isNaN(c[-1]) then condLtarget5 else double.nan) else double.nan; Ltarget5.SetPaintingStrategy(PaintingStrategy.Squares); Ltarget5.SetLineWeight(1); Ltarget5.SetDefaultColor(Color.Plum); Ltarget5.HideTitle(); AddChartBubble(BubbleLoc1, condLtarget5, "5th T", color.plum, if c < Ltarget5 then yes else no); def last = if secondsTillTime(1600) == 0 and secondsFromTime(1600) == 0 then c[1] else last[1]; plot LastClose = if Today and last != 0 then last else Double.NaN; LastClose.SetPaintingStrategy(PaintingStrategy.Dashes); LastClose.SetDefaultColor(Color.White); LastClose.HideBubble(); LastClose.HideTitle(); AddChartBubble(SecondsTillTime(0930) == 0, LastClose, "PC", color.gray, yes); alert(c crosses above ORH2, "", Alert.Bar, Sound.Bell); alert(c crosses below ORL2, "", Alert.Bar, Sound.Ring); # End Code ORB with Risk and targets
Shareable Link: https://tos.mx/qu3Cu0
Now that you have the indicator added, let's get some terminology out of the way.
- The green shadow is called the Bull Zone
- The red shadow is called Bear Zone
- Anywhere above the Bull Zone is called the Breakout Zone
- Anywhere below the Bear Zone is called the Breakdown Zone
Hopefully you were able to understand those terms from this picture.
View attachment 4237
The Setup
- 5 or 15 minutes timeframe
- Heikin-Ashi candlestick
- Disable pre-market and after-hour market
- TEMA (30)
- EMA (20)
- Supertrend Indicator
Usage #1: Taking Advantage of Breakout Zone
Once the stock reaches above the breakout zone, we buy calls.
Usage #2: Taking Advantage of Breakdown Zone
Do the same as above. If the stock start to go from Bear Zone to breakdown zone, we start shorting it.
Usage #3: Avoid Misleading Signals given by Supertrend
A lot of people brought up a really good point about Supertrend. That is sometimes it would give false signals. And I also seen it first hand too. The Opening Range Breakout Indicator will allows us to resolve that.
Example #1: Don't short when the candles are still in the Bull Zone.
View attachment 4238
The only time that it is reasonable to short while the candles are still in Bull Zone is: IF the candle are by the border of Bull Zone and Bear Zone. Even better if it's already crossing the border into Bear Zone.
Example #2: Don't Buy Calls in Breakdown Zone
If you think the Bear Zone is worst, wait until you buy calls in the Breakdown Zone. That's a hard pass.
View attachment 4239
Again, sometimes it may be reasonable to buy calls if the candles are crossing the border going back to Bear Zone, then you may have a chance to pull thru and get above it. But anywhere between the Bear Zone and Breakdown Zone, be cautious, especially if you're already deep down in the Breakdown Zone.
Here is another example of "don't buy calls in the Breakdown zone"
View attachment 4240
The following screenshot will tell us a few things.
View attachment 4241
- When the Supertrend is giving us a buy signal, and that candle is crossing from Bear Zone into Bull Zone, then it's potentially setting up for a call play. (circle #1)
- Unlike the rule of not buying calls when you're in Breakdown Zone, shorting when in Breakout Zone could potentially be profitable too. But only if it's reasonable. Look at circle #2. It rejected the white dotted line, which is an additional border to enter another Breakout Zone. Since it rejected the second breakout area, we could take advantage of the Supertrend signal to go short.
- Circle #3 and #4, don't short in Breakout Zone without reasonable evidence (I like to use Support and Resistance during the Breakout and Breakdown Zone).
When the Supertrend is showing a buy signal while the candle is in Bull Zone then it's fairly safe to take it. When Supertrend is showing a short signal while the candle s in Bear Zone, then it's fairly safe to short at that point. Treat these zones as the home of Bears and Bulls.
I think the concept is pretty simple and straightforward here. Give it a spin and let me know how it goes for you guys.
Feel free to post questions, ideas, or any additional finding from this indicator.
P.S: I'll let Steve talk more about the usage of TEMA and EMA when he's on.
Update: A different version with Fibonacci Levels.
Here is the scanner for anyone interested.
GreenPeny
New member
Can someone please explain to me what are the "RO doted white line, Risk ON ORH, doted yellow line and doted red line means. Thank youLearning log v12.19
Today is the first day I got the chance to use this indicator using real money. The learning experience has been phenomenal.
Apple Calls
First position I got into was AAPL 165.5 call. I got in at 6:56 am PST (yellow arrow). I saw that the candle was really near the border of Bull Zone and Breakout Zone. Market was pulling up so I thought Apple may follow suit. I got in but then 10-15 mins later it rejected Breakout Zone and fall back down (orange arrow).
View attachment 4243
Note to self: Wait for confirmation.
P/L: -15% / -$54
Netflix Puts
The second position was NFLX 277.5 put. For this one, the reasoning was pretty simple and straightforward. Partially went above Breakout Zone, rejected it. Supertrend signaled a short so I took it. Rode it down but market kinda reversed a bit. I saw that NFLX was very weak in term of that reversal so I continue to hold to see what happen.
Later on, NFLX tested entering the Breakout Zone but it failed. Furthermore, Supertrend signaled a short so I added an additional contract and rode it down again.
View attachment 4244
Note to self: pay attention to trend line, support / resistance for additional confirmation.
P/L: +$73
Microsoft Put
Microsoft was really strong today compared to other tickers. As soon as the 30-min opening range is over, it just skipped the Bull Zone and went straight toward the Breakout Zone.
I knew it was gonna pullback some how, but then again, it's still in Breakout Zone so I needed more confirmations than just my opinion. Supertrend signaled a short, the candle was below the TEMA (30) and both trend lines. So i took a small bite at it.
View attachment 4245
Glad it worked out well.
P/L: +$16.00.
Note to self: stop the weak hands.
OS' Apple Alert
Option Snipper alerted to buy a Apple call today as a lotto. I didn't enter because Apple was trying to enter the Breakout Zone (it tried to earlier and failed), so I was cautious and I waited for it to enter the zone before I start buying. It never did.
View attachment 4246
GaltsAtlantis
New member
@MerryDay or @BenTen , and others,
Quick question... is the Mobius_ORB strategy
https://usethinkscript.com/threads/opening-range-breakout-indicator-for-thinkorswim.16/
that BenTen posted back in December 2018 still a valid strategy?
I've written in a separate thread that I am genuinely trying to learn how profitable individuals or groups are using indicators as reason to get into or out of their trades. I have been identified previously as a "price action" trader and have joined this community to submit myself to learning a new way. I am enjoying the time of learning different concepts, theories, and mathematics while I attempt to develop some sort of strategy with the intent of profits outpacing my current wage.
I recently came across this strategy (posted in the link above) and was impressed with the simplistic concepts developed by very trusted individuals (BenTen and Mobius). Then on September 22, 2021 [post # 61] MerryDay was helping another member solve a problem they were having, but in the reply a portion jumped out at me:
"... but I am not trading on the ORB anymore. ..."
1. Verified this was once a strategy that was indeed traded, and by someone I value greatly, MerryDay.
2. This strategy was discarded for something else.
With application of some of the great VIP Indicators provided in our membership and/or adjusted application of trading theory, I believe I am seeing a potential basis of a profitable day trading or scalping strategy develop, but am plagued with a question of concern: If MerryDay, who has excessively greater trading experience that I, passed on this ORB concept, then I must be missing something, maybe in the end the ORB isn't a valid long term strategy of profit?
All my best,
Thank you for your time.
Last edited by a moderator:
@MerryDay or @BenTen , and others,
Quick question... is the Mobius_ORB strategy [click] that BenTen posted back in December 2018 still a valid strategy?
I've written in a separate thread that I am genuinely trying to learn how profitable individuals or groups are using indicators as reason to get into or out of their trades. I have been identified previously as a "price action" trader and have joined this community to submit myself to learning a new way. I am enjoying the time of learning different concepts, theories, and mathematics while I attempt to develop some sort of strategy with the intent of profits outpacing my current wage.
I recently came across this strategy (posted in the link above) and was impressed with the simplistic concepts developed by very trusted individuals (BenTen and Mobius). Then on September 22, 2021 [post # 61] MerryDay was helping another member solve a problem they were having, but in the reply a portion jumped out at me:
"... but I am not trading on the ORB anymore. ..."
1. Verified this was once a strategy that was indeed traded, and by someone I value greatly, MerryDay.
2. This strategy was discarded for something else.
With application of some of the great VIP Indicators provided in our membership and/or adjusted application of trading theory, I believe I am seeing a potential basis of a profitable day trading or scalping strategy develop, but am plagued with a question of concern: If MerryDay, who has excessively greater trading experience that I, passed on this ORB concept, then I must be missing something, maybe in the end the ORB isn't a valid long term strategy of profit?
All my best,
Thank you for your time.
You are correct, I do not trade the ORB anymore. But not because there is a problem with the strategy.
I no longer trade in these short bursts.
Here is what Mobius had to say about the ORB recently on the ToS Lounge:


You will read critical reviews of the ORB. This is because it is not the easiest strategy for newer traders to follow and implement. Thus, greatly affecting the profitability of new traders.
Market conditions, have an impact on gains. Orb strategies involve trading based on breakouts from defined price ranges. They can yield profits in certain market situations, but might not perform well in others.
Success often hinges on careful analysis, risk management, and adapting to changing market dynamics.
Newer traders would not start out with this strategy.
@khpro59, recently, wrote a VIP post on how to stack the deck in your favor when trading on these lower timeframes: https://usethinkscript.com/threads/good-day-vs-bad-day-in-thinkorswim.17236/
Hope This Helps.
Last edited:
GaltsAtlantis
New member
MerryDay,
Your reply is exactly as I had hoped it would be, informative and encouraging. Your words paired with the recent Mobius posts you’ve provided are additional affirmation that this path is worth exploring.
You are brilliant and I thank you for all that you (and others) provide to this community. It is an honor to be a member.
All my best.
GreenPeny
New member
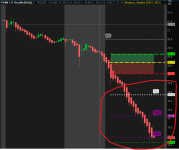
Hi Ben, is it possible to remove the upper/lower purple bubbles from from the script? I tried to unchecked show bubble from the study but still showing/printing. ThanksLearning log v12.21
I'll keep this one short. Day traded several tickers today. Made about +$110 in the morning but then lost it all to one mistake. Which was not waiting for confirmation...again!
It was the case of Netflix. Around 8:30 PST I took a Netflix call because I thought it was trying to break above the resistance. I tend to get overly confident after making money from other trades. So I took the call. Did not work out well. There was obviously no confirmation there. The market was in a downtrend as well. And I also stressed in the first post that you shouldn't be buying calls when the stock is already in Breakdown Zone.
I went against that with no obvious confirmation. All profit was gone.
View attachment 4253
Ended the day with $0.
GaltsAtlantis
New member
GreenPeny,
When you say "bubble", what are you referring to?
a. The (Color.PLUM) area on the right of the chart highlighting the indicated value.
b. The (Color.PLUM) ChartBubble that says: "2nd T", "3rd T", "4th T", etc.?
c. Something else entirely.
Cheers
When you say "bubble", what are you referring to?
a. The (Color.PLUM) area on the right of the chart highlighting the indicated value.
b. The (Color.PLUM) ChartBubble that says: "2nd T", "3rd T", "4th T", etc.?
c. Something else entirely.
Cheers

New Indicator: Buy the Dip
Check out our Buy the Dip indicator and see how it can help you find profitable swing trading ideas. Scanner, watchlist columns, and add-ons are included.
Join useThinkScript to post your question to a community of 21,000+ developers and traders.
Similar threads
-
 Opening Range Breakout Strategy with Market Volatility for ThinkorSwim
- Started by BenTen
- Replies: 168
-
Opening Range Breakout with Directional Day Filter for ThinkorSwim
- Started by BenTen
- Replies: 6
-
-
-
 Opening Range Indicator with Measured Moves and VWAP For ThinkOrSwim
- Started by FutureTony
- Replies: 46
Not the exact question you're looking for?
Start a new thread and receive assistance from our community.
87k+
Posts
1732
Online
Similar threads
-
Opening Range Breakout Strategy with Market Volatility for ThinkorSwim
- Started by BenTen
- Replies: 168
-
Opening Range Breakout with Directional Day Filter for ThinkorSwim
- Started by BenTen
- Replies: 6
-
-
-
Opening Range Indicator with Measured Moves and VWAP For ThinkOrSwim
- Started by FutureTony
- Replies: 46
The Market Trading Game Changer
Join 2,500+ subscribers inside the useThinkScript VIP Membership Club
- Exclusive indicators
- Proven strategies & setups
- Private Discord community
- ‘Buy The Dip’ signal alerts
- Exclusive members-only content
- Add-ons and resources
- 1 full year of unlimited support
Frequently Asked Questions
What is useThinkScript?
useThinkScript is the #1 community of stock market investors using indicators and other tools to power their trading strategies. Traders of all skill levels use our forums to learn about scripting and indicators, help each other, and discover new ways to gain an edge in the markets.
How do I get started?
We get it. Our forum can be intimidating, if not overwhelming. With thousands of topics, tens of thousands of posts, our community has created an incredibly deep knowledge base for stock traders. No one can ever exhaust every resource provided on our site.
If you are new, or just looking for guidance, here are some helpful links to get you started.
- The most viewed thread:
https://usethinkscript.com/threads/repainting-trend-reversal-for-thinkorswim.183/ - Our most popular indicator:
https://usethinkscript.com/threads/buy-the-dip-indicator-for-thinkorswim.3553/ - Answers to frequently asked questions:
https://usethinkscript.com/threads/answers-to-commonly-asked-questions.6006/
What are the benefits of VIP Membership?
VIP members get exclusive access to these proven and tested premium indicators: Buy the Dip, Advanced Market Moves 2.0, Take Profit, and Volatility Trading Range. In addition, VIP members get access to over 50 VIP-only custom indicators, add-ons, and strategies, private VIP-only forums, private Discord channel to discuss trades and strategies in real-time, customer support, trade alerts, and much more. Learn all about VIP membership here.
How can I access the premium indicators?
To access the premium indicators, which are plug and play ready, sign up for VIP membership here.