Hi,
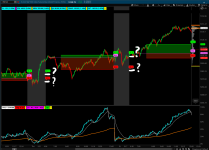
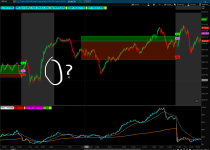
Can this be modified so each indicator can plot only for RTH when not in expansion?
https://usethinkscript.com/threads/...dicator-for-thinkorswim.16/page-8#post-113995
# Opening_Range_Breakout Strategy with Risk and Target Lines
# Mobius
# This is V03.02.2017(B) Other versions start with V01.01.2001 Ported to TOS 06.2011
#hint: Opening Range Breakout is one of the original Floor Trader Strategies.\n Why it works: Overnight orders accumulate. Those orders being placed during the first 15 minutes of Regular Trading Hours combined with the typical high volume in the first 30 minutes of trading make this the most volatile trading period of the day. Regularly released reports during the first 30 minutes of trading add to the volatility and effect the days direction.\n Features of this study: The yellow dashed line is the Day Filter Line and is used to determin the trend direction for the day. The dominant time spent above or below this line during the Opening Range Period typically determines the days trend. Green points indicate a close at EOD above the yellow line. Red Points a close below the yellow line. Yellow points a neutral or balanced day, close Between the Opening Range Extremes and often very near the Day Filter Line. The Opening Range is plotted with a green and red dashed line. Trades can be taken when there is an open outside these range lines. Up to 10 Targets are generated using Average True Range to plot target lines. When price crosses the first target line part of the trade should be taken as Risk Off profit and a stop should be placed at the entry point ensuring a profitable trade. If price crosses further targets stops should be moved to the preceeding target until stopped or your profit target is met. Initial Risk Stops are an open below the bar's low prior to entry or the Risk Lines plotted below the Opening range Lines. When price tests the opening range lines from below for the upper line or above for the lower lines trades can be taken with a first target to the yellow line from either direction and a Risk Stop line outside the opening range at the First Target lines or a close outside the Opening Range Lines. \n FYI the color of Probable close direction points are statistically accurate between 60% and 70% of the time. Trading against the direction of the ORB's Day Filtered Direction should be considered counter trend trades.\n As of 01.03.2017 You have just under a 52% probability that a DAILY bar will close green. So a 60% to 70% probability is a nice edge.
# (B)Deletions / Additions: Deleted - Globex High / Low, Globex Volume and Averages.
# Additions: Added 5 more target lines for a total of 10 on each side of the Opening Range.
#20230601 Sleepyz - Added ONExpansion option
declare hide_on_daily;
declare once_per_bar;
input onexpansion = yes;
input ORHL_Begin = 0930;
input ORHL_Start = 0935;
input MARKETOpen = 0930.0; #hint OrMeanS: Begin Mean Period. Usually Market Open EST.
input EndOfFirstBar = 0935.0; #hint OrMeanE: End Mean period. Usually End of first bar.
input ORB_HL_Begin = 0930.0; #hint OrBegin: Beginning for Period of Opening Range Breakout.
input ORB_HL_Start = 1030.0; #hint OrEnd: End of Period of Opening Range Breakout.
input CloudOn = no; #hint CloudOn: Clouds Opening Range.
input AlertOn = yes; #hint AlertOn: Alerts on cross of Opening Range.
input ShowTodayOnly = {"No", default "Yes"};
input nAtr = 4; #hint nATR: Lenght for the ATR Risk and Target Lines.
input AtrTargetMult = 2.0; #hint ATRmult: Multiplier for the ATR calculations.
input pricecolor = yes;
def h = high;
def l = low;
def c = close;
def bar = BarNumber();
def s = ShowTodayOnly;
def ORActive = if SecondsTillTime(EndOfFirstBar) > 0 and SecondsFromTime(MARKETOpen) >= 0 then 1 else 0;
def ORActiveHL = if SecondsTillTime(ORHL_Start) > 0 and
SecondsFromTime(ORHL_Begin) >= 0
then 1
else 0;
def today = if s == 0 or GetDay() == GetLastDay() and SecondsFromTime(MARKETOpen) >= 0 then 1 else 0;
def ORHigh = if ORHigh[1] == 0
or ORActiveHL[1] == 0 and
ORActiveHL == 1
then h
else if ORActiveHL and
h > ORHigh[1]
then h
else ORHigh[1];
def ORLow = if ORLow[1] == 0
or ORActiveHL[1] == 0 and
ORActiveHL == 1
then l
else if ORActiveHL and
l < ORLow[1]
then l
else ORLow[1];
def ORWidth = ORHigh - ORLow;
def na = Double.NaN;
def ORHA = if ORActiveHL or today < 1 then na else ORHigh;
def ORLA = if ORActiveHL or today < 1 then na else ORLow;
def O = ORHA - Round(((ORHA - ORLA) / 2) / TickSize(), 0) * TickSize();
def ORActive2 = if SecondsTillTime(ORB_HL_Start) > 0 and
SecondsFromTime(ORB_HL_Begin) >= 0
then 1
else 0;
def ORHigh2 = if ORHigh2[1] == 0
or ORActive2[1] == 0 and
ORActive2 == 1
then h
else if ORActive2 and
h > ORHigh2[1]
then h
else ORHigh2[1];
def ORLow2 = if ORLow2[1] == 0
or ORActive2[1] == 0 and
ORActive2 == 1
then l
else if ORActive2 and
l < ORLow2[1]
then l
else ORLow2[1];
def ORWidth2 = ORHigh2 - ORLow2;
def TimeLine = if SecondsTillTime(ORB_HL_Start) == 0
then 1
else 0;
def ORmeanBar = if !ORActive and ORActive[1] then BarNumber() else ORmeanBar[1];
def ORendBar = if !ORActive2 and ORActive2[1]
then BarNumber()
else ORendBar[1];
def ORL = If (O == 0 , na, O);
plot ORB_BAL = if onexpansion and !IsNaN(close) then Double.NaN
else if onexpansion and BarNumber() >= HighestAll(ORmeanBar)
then HighestAll(if IsNaN(c[-1])
then ORL[1]
else Double.NaN)
else if !onexpansion
then ORL
else Double.NaN;
ORB_BAL.SetDefaultColor(Color.YELLOW);
ORB_BAL.SetStyle(Curve.LONG_DASH);
ORB_BAL.SetLineWeight(3);
ORB_BAL.HideTitle();
def ORH2 = if ORActive2
or today < 1
then na
else ORHigh2;
plot ORB_H = if onexpansion and !IsNaN(close) then Double.NaN
else if !ShowTodayOnly
then ORH2[1]
else if onexpansion and BarNumber() >= HighestAll(ORendBar)
then HighestAll(if IsNaN(c[-1])
then ORH2[1]
else Double.NaN)
else if !onexpansion
then ORH2
else Double.NaN;
ORB_H.SetDefaultColor(Color.GREEN);
ORB_H.SetStyle(Curve.LONG_DASH);
ORB_H.SetLineWeight(3);
ORB_H.HideTitle();
def ORL2 = if ORActive2
or today < 1
then na
else ORLow2;
plot ORB_L = if onexpansion and !IsNaN(close) then Double.NaN
else if !ShowTodayOnly
then ORL2[1]
else if onexpansion and BarNumber() >= HighestAll(ORendBar)
then HighestAll(if IsNaN(c[-1])
then ORL2[1]
else Double.NaN)
else if !onexpansion
then ORL2
else Double.NaN;
ORB_L.SetDefaultColor(Color.RED);
ORB_L.SetStyle(Curve.LONG_DASH);
ORB_L.SetLineWeight(3);
ORB_L.HideTitle();
def RelDay = (ORL - ORL2) / (ORH2 - ORL2);
def dColor = if RelDay > .5
then 5
else if RelDay < .5
then 6
else 4;
def pos = (ORH2 - ORL2) / 10;
AddCloud(if CloudOn == yes then ORL else Double.NaN, ORL2, Color.Light_Red, Color.Light_Red);
AddCloud(if CloudOn == yes then ORL else Double.NaN, ORH2, Color.Green, Color.Green);
input vertical_line = yes;
AddVerticalLine((vertical_line and SecondsFromTime(1030) == 0), " IB ", Color.CYAN, Curve.MEDIUM_DASH);
### ADX
input ADXlength = 14;
input averageType = AverageType.WILDERS;
input show_SmartADX_label = yes;
input paintbars = yes;
def currentADX = ADX(ADXlength);
DefineGlobalColor("ADXMaxHigh2", Color.CYAN);
DefineGlobalColor("ADXMaxHigh1", Color.MAGENTA);
DefineGlobalColor("ADXHigh", Color.GREEN);
DefineGlobalColor("ADXMid", Color.WHITE);
DefineGlobalColor("ADXLow", Color.RED);
AssignPriceColor (if currentADX > 55 then GlobalColor("ADXMaxHigh2") else if currentADX > 40 then GlobalColor ("ADXMAxHigh1") else if !pricecolor then Color.CURRENT else if close > ORB_BAL then color.green else if close < ORB_BAL then color.red else color.gray);